[section label=1. Introduction]
3D V-NAND, Now Going Mainstream
 Several months ago, I attended the Samsung Global SSD Summit where I was first introduced to the Samsung 850 PRO along with its new 2nd generation 2-bit per cell MLC 3D V-NAND technology. At the time, 3D V-NAND had already been in testing internally at Samsung for almost a year and its introduction was quite revolutionary as it promised double the performance, double the endurance, and significantly better power efficiency than previous generation 2D planar NAND. Additionally, given the fact that 2D planar NAND physically hits its limits in terms of further die shrinks past the 1xnm lithography, the transition to 3D NAND was inevitable and not just for Samsung, but for the industry as a whole. For more in depth information on 3D V-NAND, be sure to check out our review on the Samsung 850 PRO here.
That said, in addition to announcing the 2-bit MLC 3D V-NAND during the SSD Global Summit, Samsung also announced that 3-bit per cell MLC (TLC) 3D V-NAND was technologically viable and that it was on its way although no further details were shared at the time. Shortly after, Samsung further discussed their TLC 3D V-NAND technology at Flash Memory Summit (FMS) and told attendees at the conference that a drive was already in the works and a launch would be coming shortly. While we expected the drive to launch sometime in October or early November to take advantage of the holiday shopping season, Samsung instead notified us that the launch would be happening in early December, which is a fairly strange time to be introducing a product this huge. Better late 2014 than 2015 I suppose.
Samsung 850 EVO Specifications
| Manufacturer | Samsung | Samsung | Samsung | Samsung |
|---|---|---|---|---|
| Model | 850 EVO | 850 EVO | 850 EVO | 850 EVO |
| Form Factor | 2.5″ 7mm | 2.5″ 7mm | 2.5″ 7mm | 2.5″ 7mm |
| Capacity | 120GB | 250GB | 500GB | 1TB |
| Controller | Samsung MGX | Samsung MGX | Samsung MGX | Samsung MEX |
| NAND | Samsung 32-layer TLC 3D V-NAND | Samsung 32-layer TLC 3D V-NAND | Samsung 32-layer TLC 3D V-NAND | Samsung 32-layer TLC 3D V-NAND |
| Sequential Reads | 540 MB/s | 540 MB/s | 540 MB/s | 540 MB/s |
| Sequential Writes | 520 MB/s | 520 MB/s | 520 MB/s | 520 MB/s |
| 4K Random Read | 94,000 | 97,000 | 98,000 | 98,000 |
| 4K Random Write | 88,000 | 88,000 | 90,000 | 90,000 |
| Interface | SATA 3 6GB/s | SATA 3 6GB/s | SATA 3 6GB/s | SATA 3 6GB/s |
| Endurance | 75TB | 75TB | 150TB | 150TB |
| Warranty | 5 Years | 5 Years | 5 Years | 5 Years |
Today we have the opportunity to be among the first to review what Samsung calls the Samsung 850 EVO, which as you may expect is Samsung’s successor to the Samsung 840 EVO launched last year. As most of us familiar with Samsung SSDs have come to expect, the Samsung EVO SSDs are designed for the mainstream SSD market so they’re going to be very cost competitive at the expense of performance and endurance. However as you’ll see in this review, this isn’t necessarily the case.
The Samsung 850 EVO is expected to be available in capacities ranging from 120GB to 1TB and will only be offered in the 2.5″ 7mm form factor. This is similar to the launch lineup for the Samsung 840 EVO although the Samsung 850 EVO is losing the 750GB capacity most likely due to lower sales. Samsung will also launch M.2 and mSATA versions of the Samsung 850 EVO sometime next year as well although no specific timeframe was provided. As for internal components, the Samsung 850 EVO will be using either the new Samsung MGX controller or the older Samsung MEX controller along with Samsung’s latest TLC (3-bit per cell MLC) 3D V-NAND. We’ll be discussing that further when we take a closer look at the drive.
Warranty on the Samsung 850 EVO is expected to be a class leading 5 years with an endurance rating of 75TB for the 120 and 250GB drives, and 150TB for the 500GB and 1TB drives. This is the first mainstream SSD product from any SSD vendor with a 5 year warranty, which reflects highly on Samsung’s confidence in their 3D V-NAND product at least for the rated endurance. Additionally, a 150TB endurance rating is also the highest we’ve seen for any mainstream SSD as most competitors drives in this segment generally carries a 72TB endurance rating or less.
Let’s go ahead take a closer look at the Samsung 850 EVO!
[section label=2. A Closer Look]
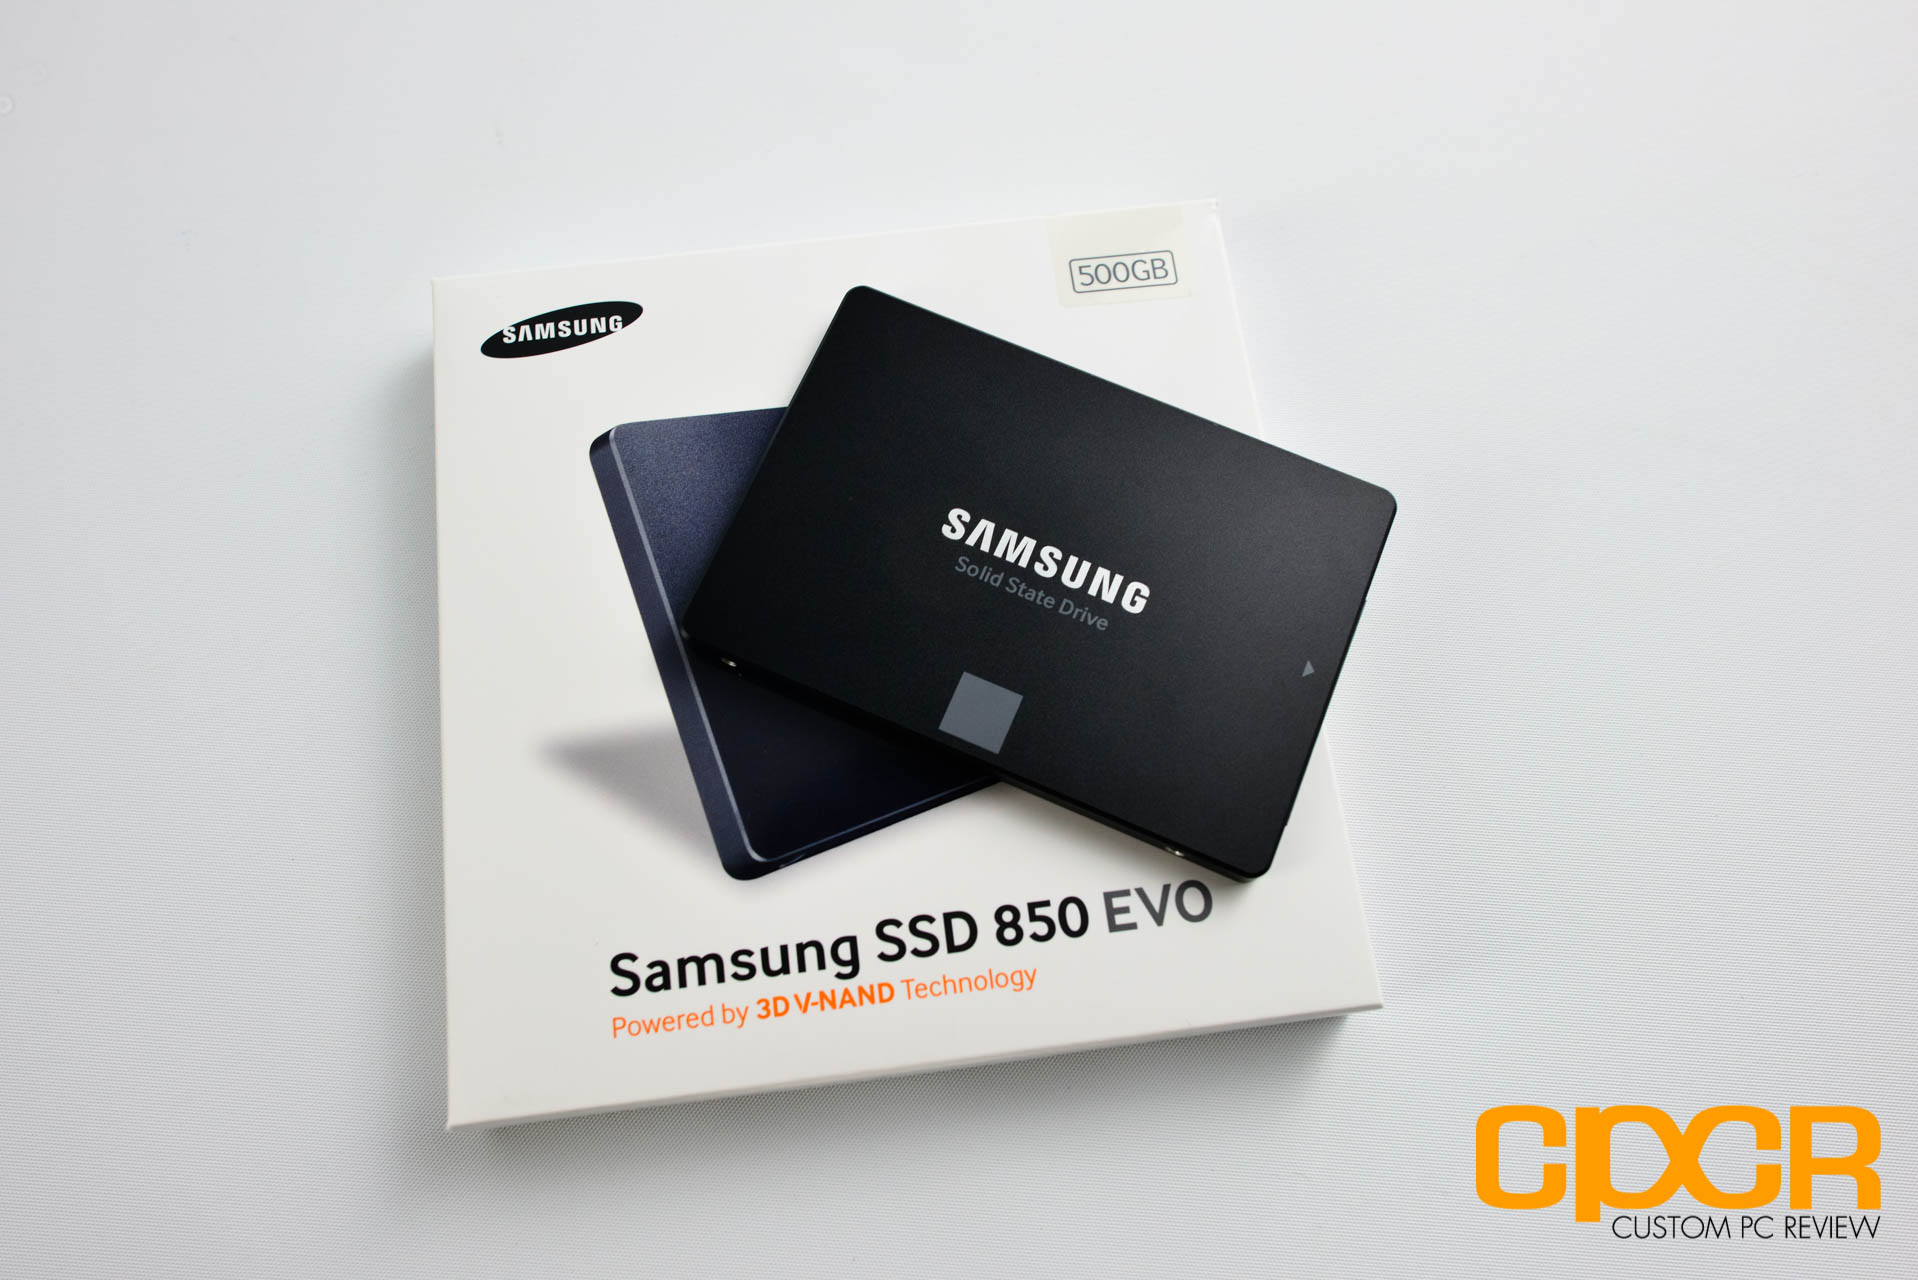
A Closer Look at the Samsung 850 EVO 500GB
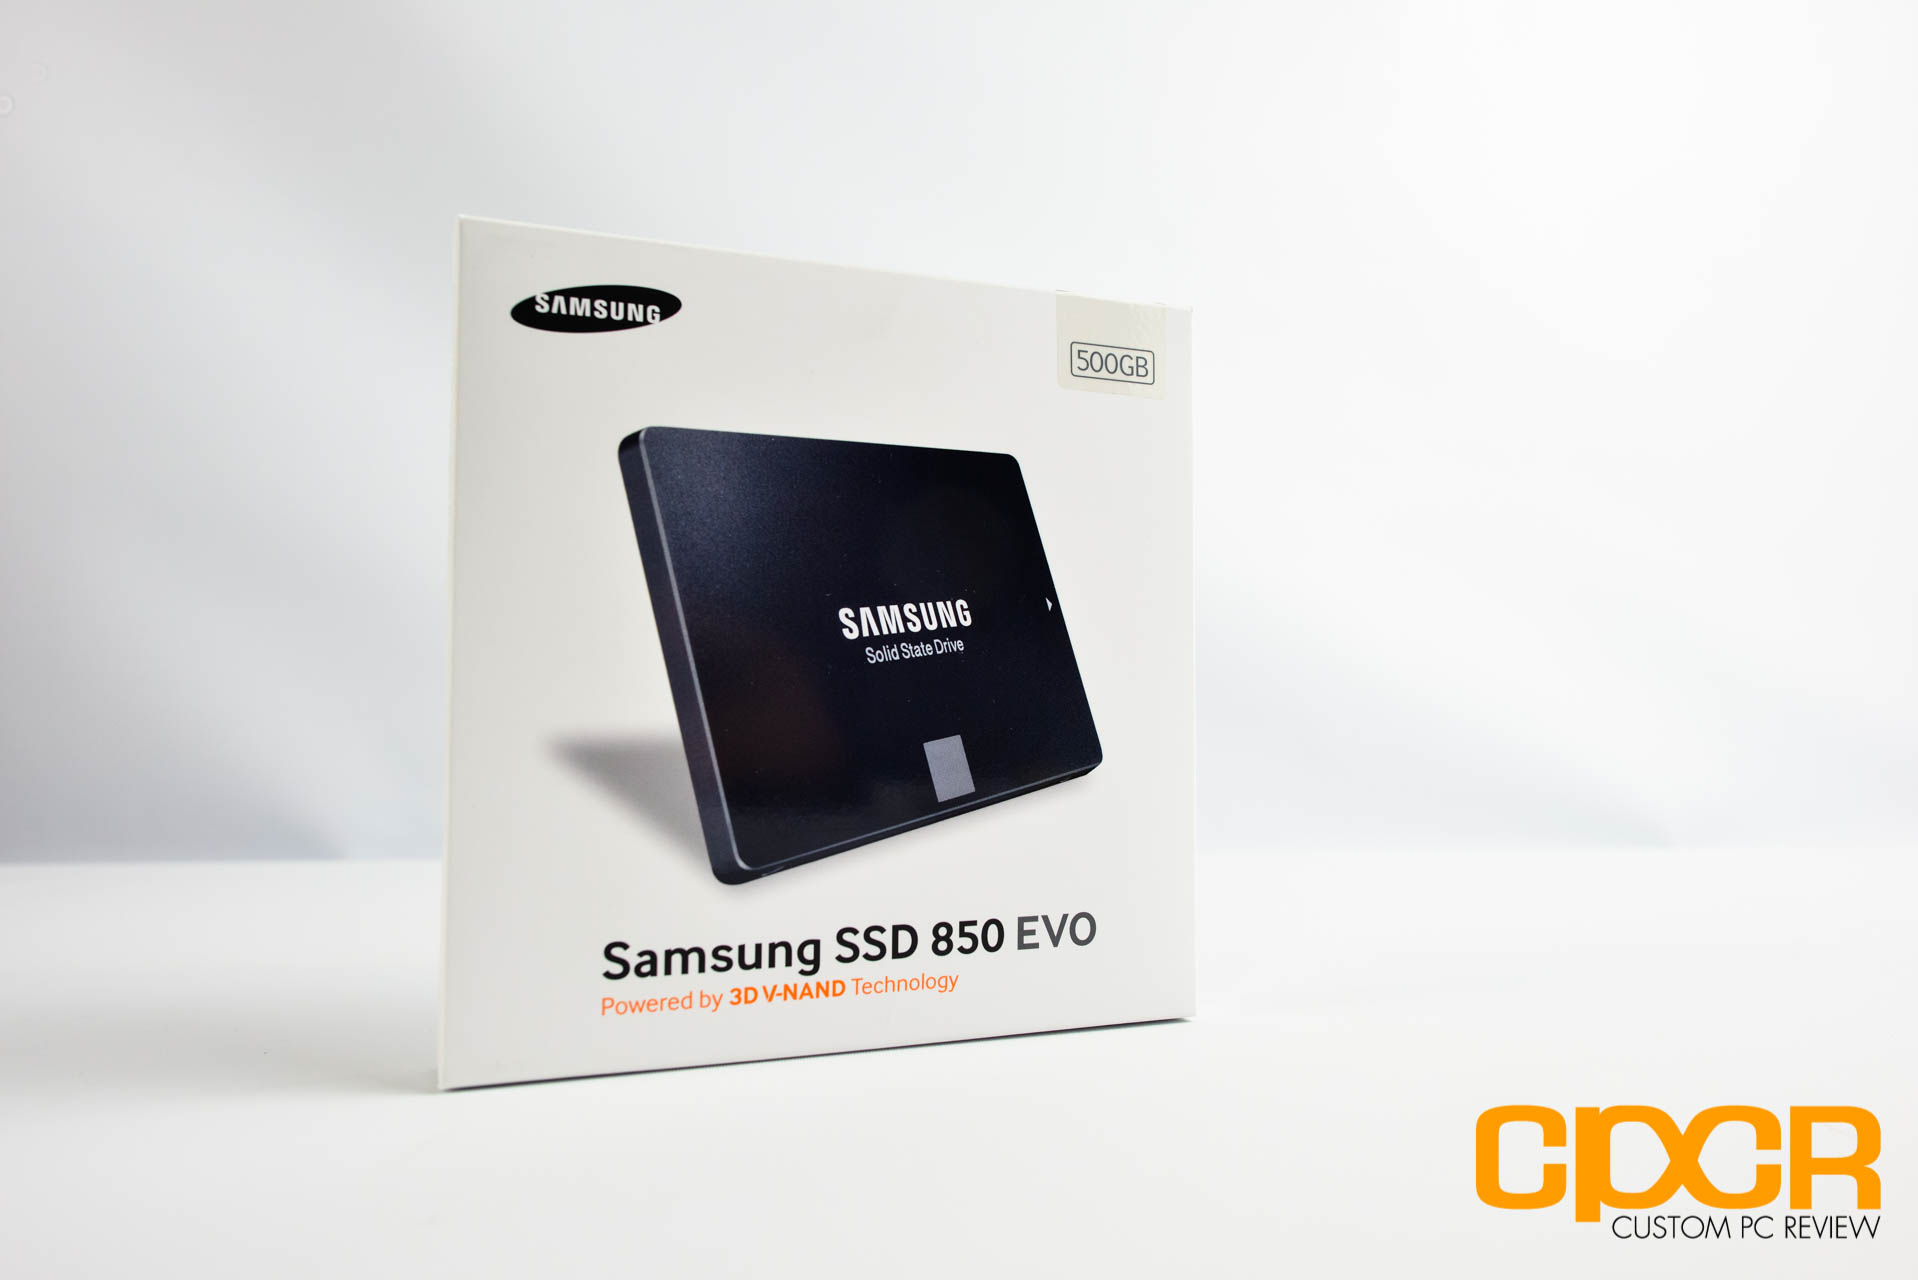
For our review, we received the Samsung 850 EVO 500GB. We expect this capacity to be the top seller in the Samsung 850 EVO lineup as it offers an adequate amount of storage space for most users, it has the 150TB warranty, and it’ll be coming in at a significantly more affordable pricepoint than the 1TB capacity drive.
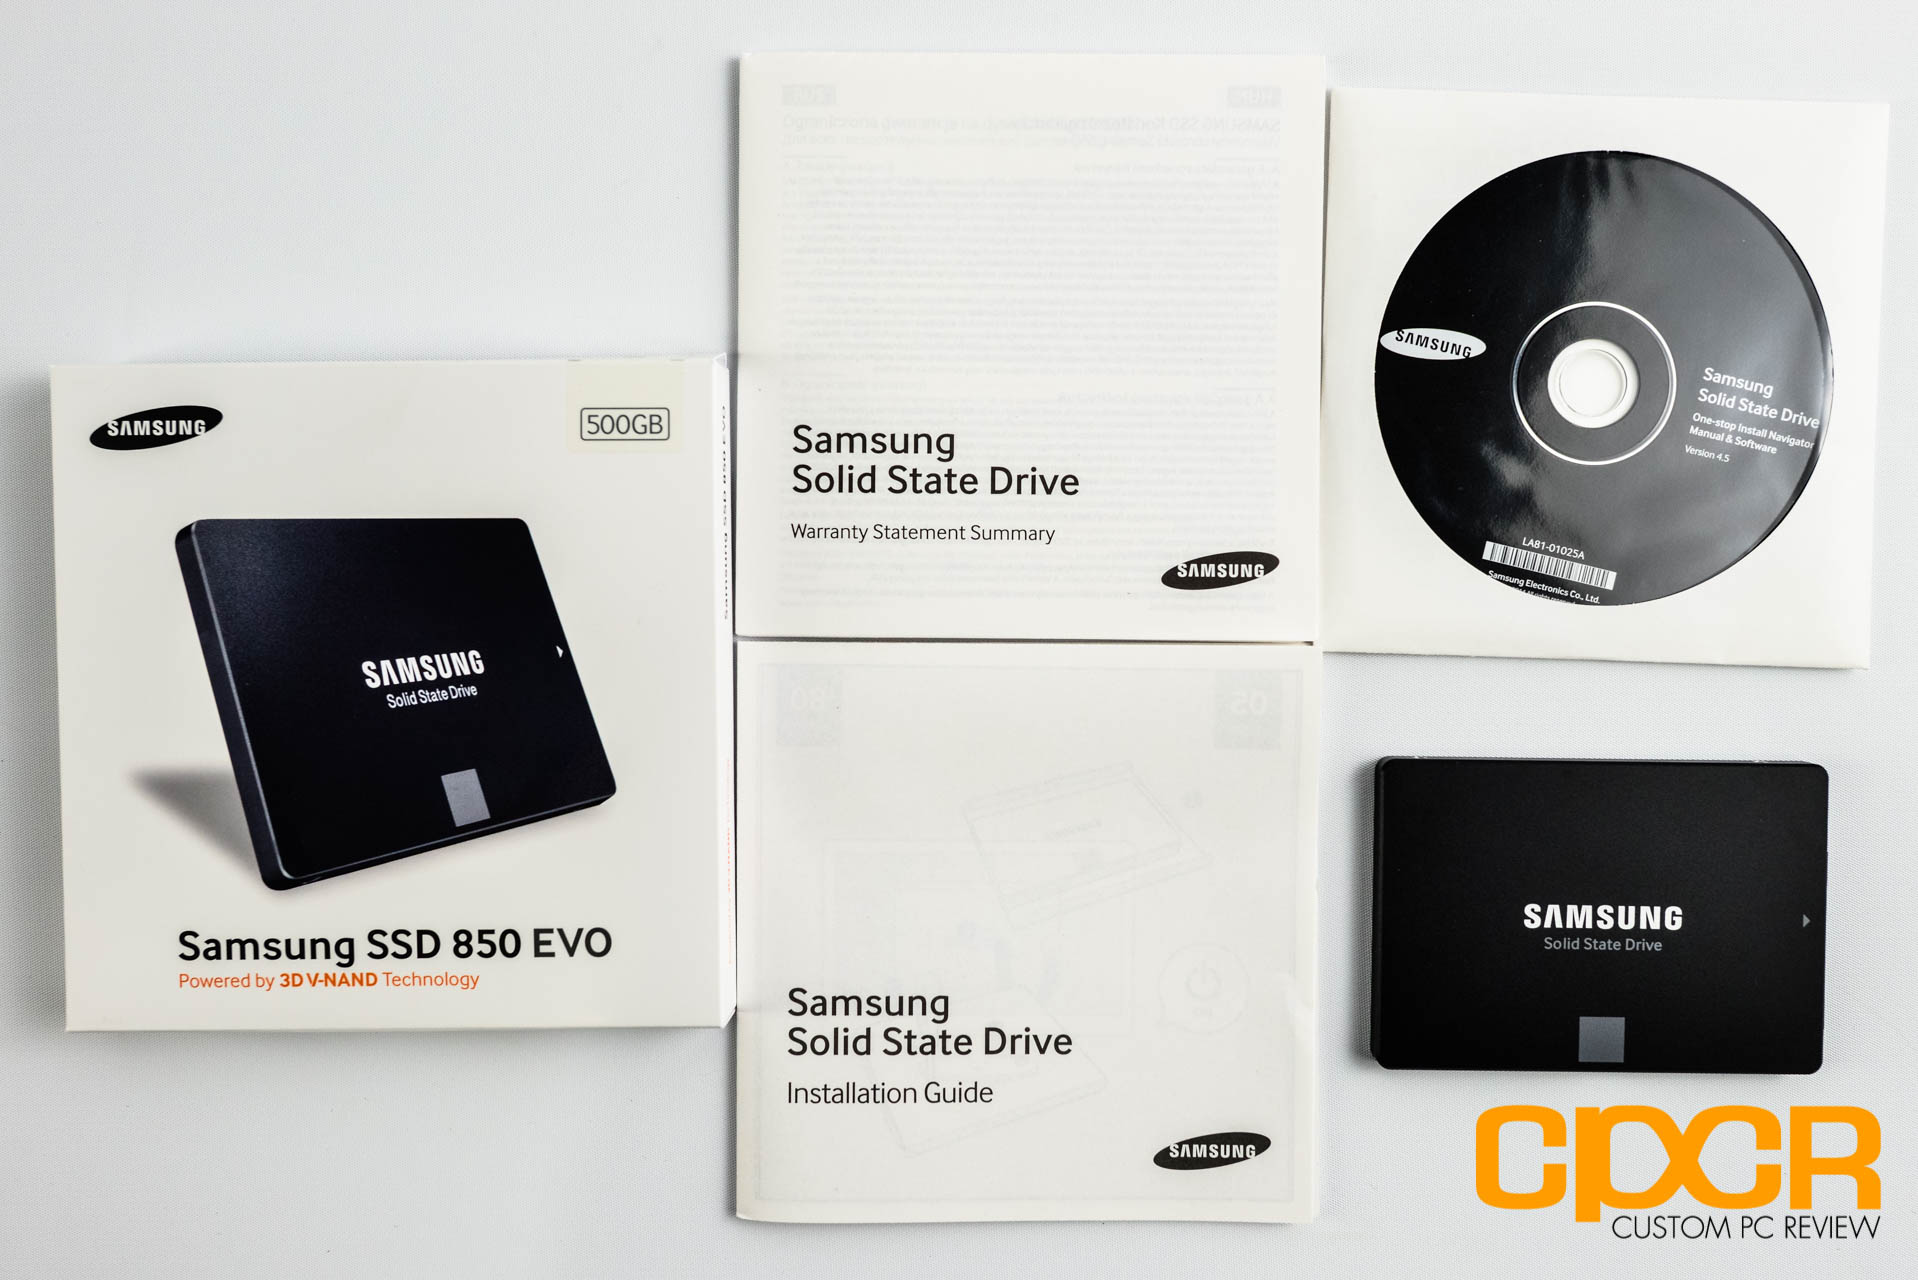
Included in the packaging we get some documentation, a software disk, and the Samsung 850 EVO itself.
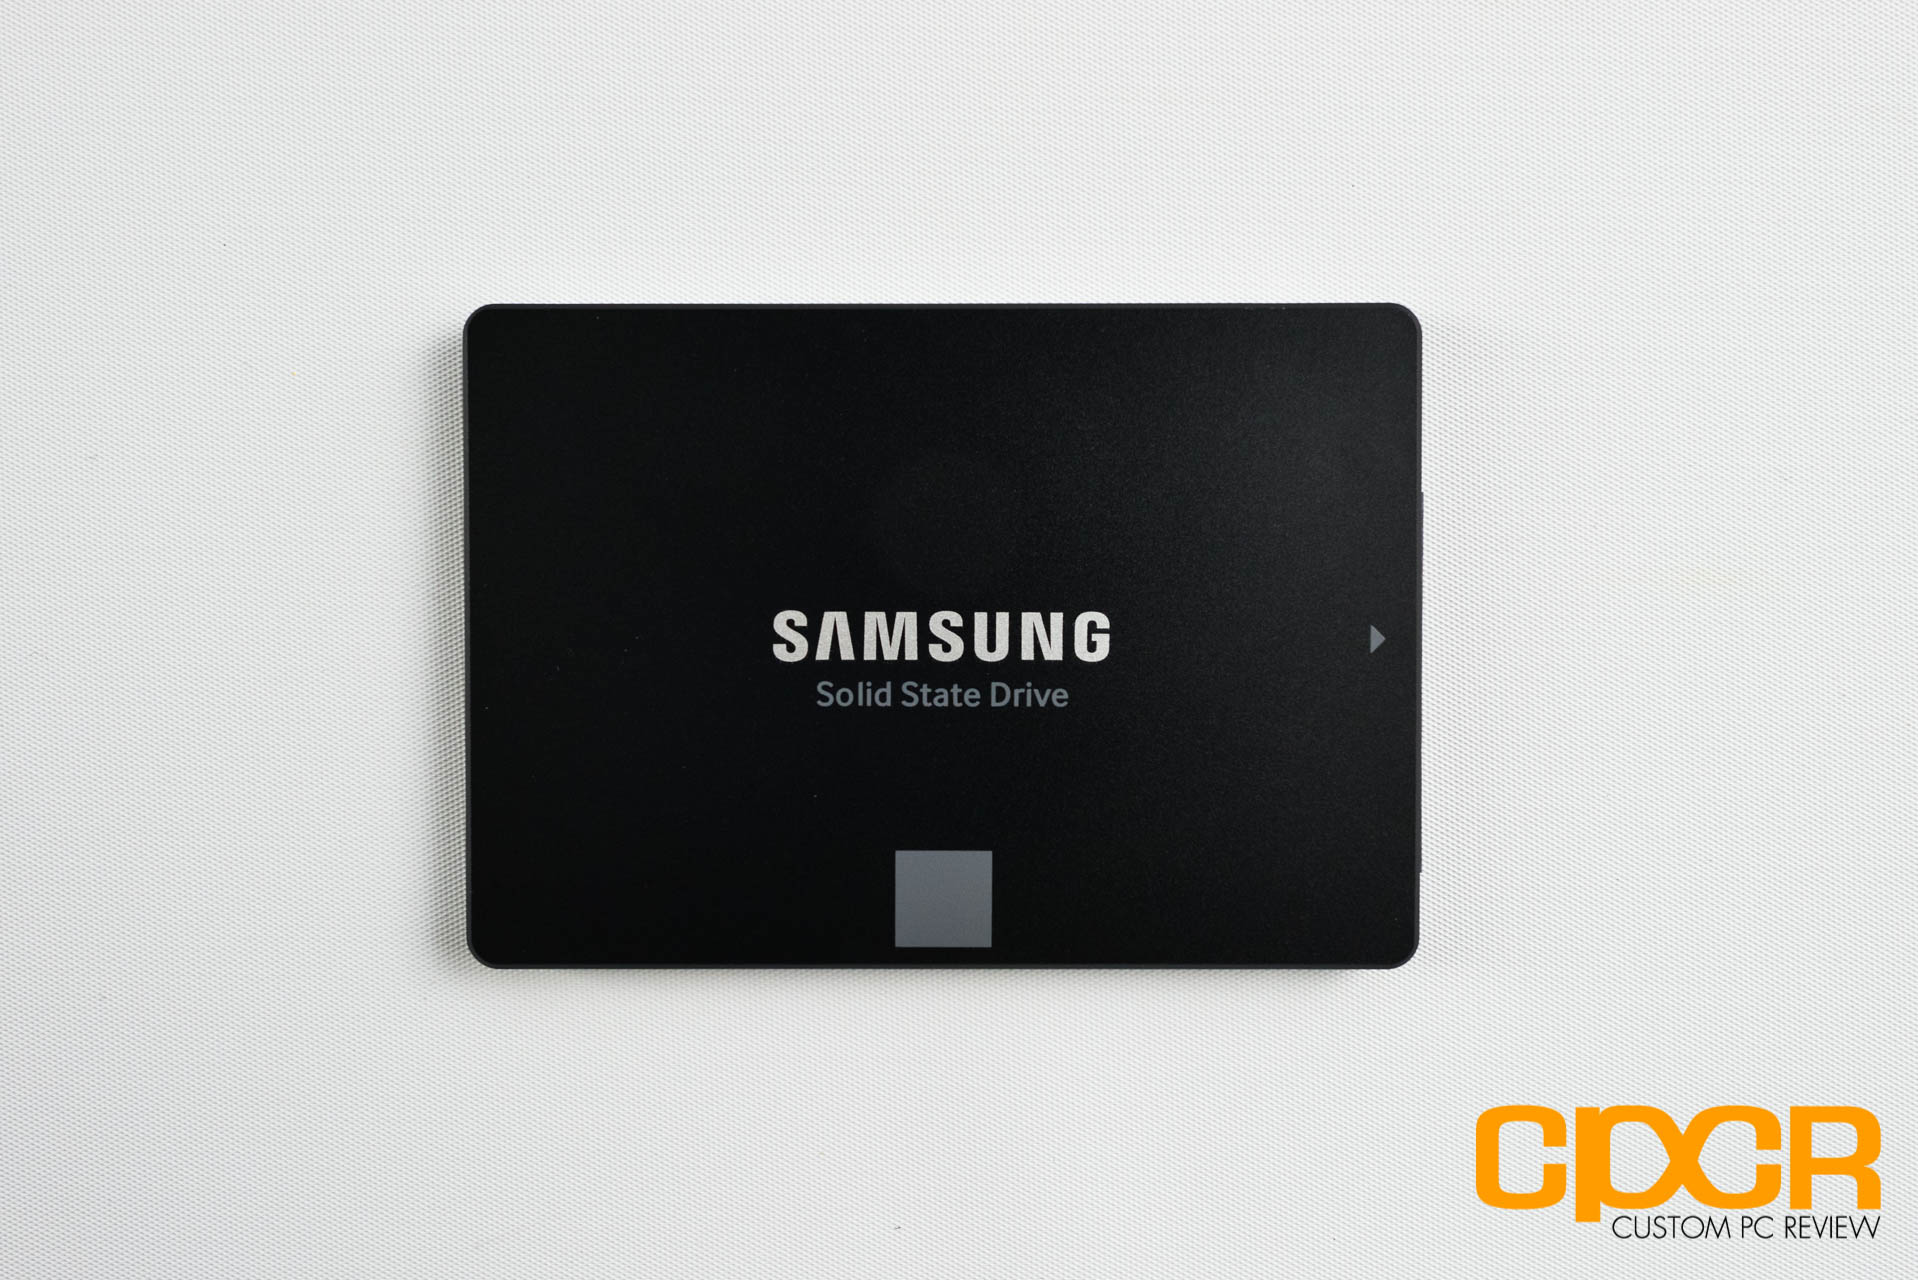
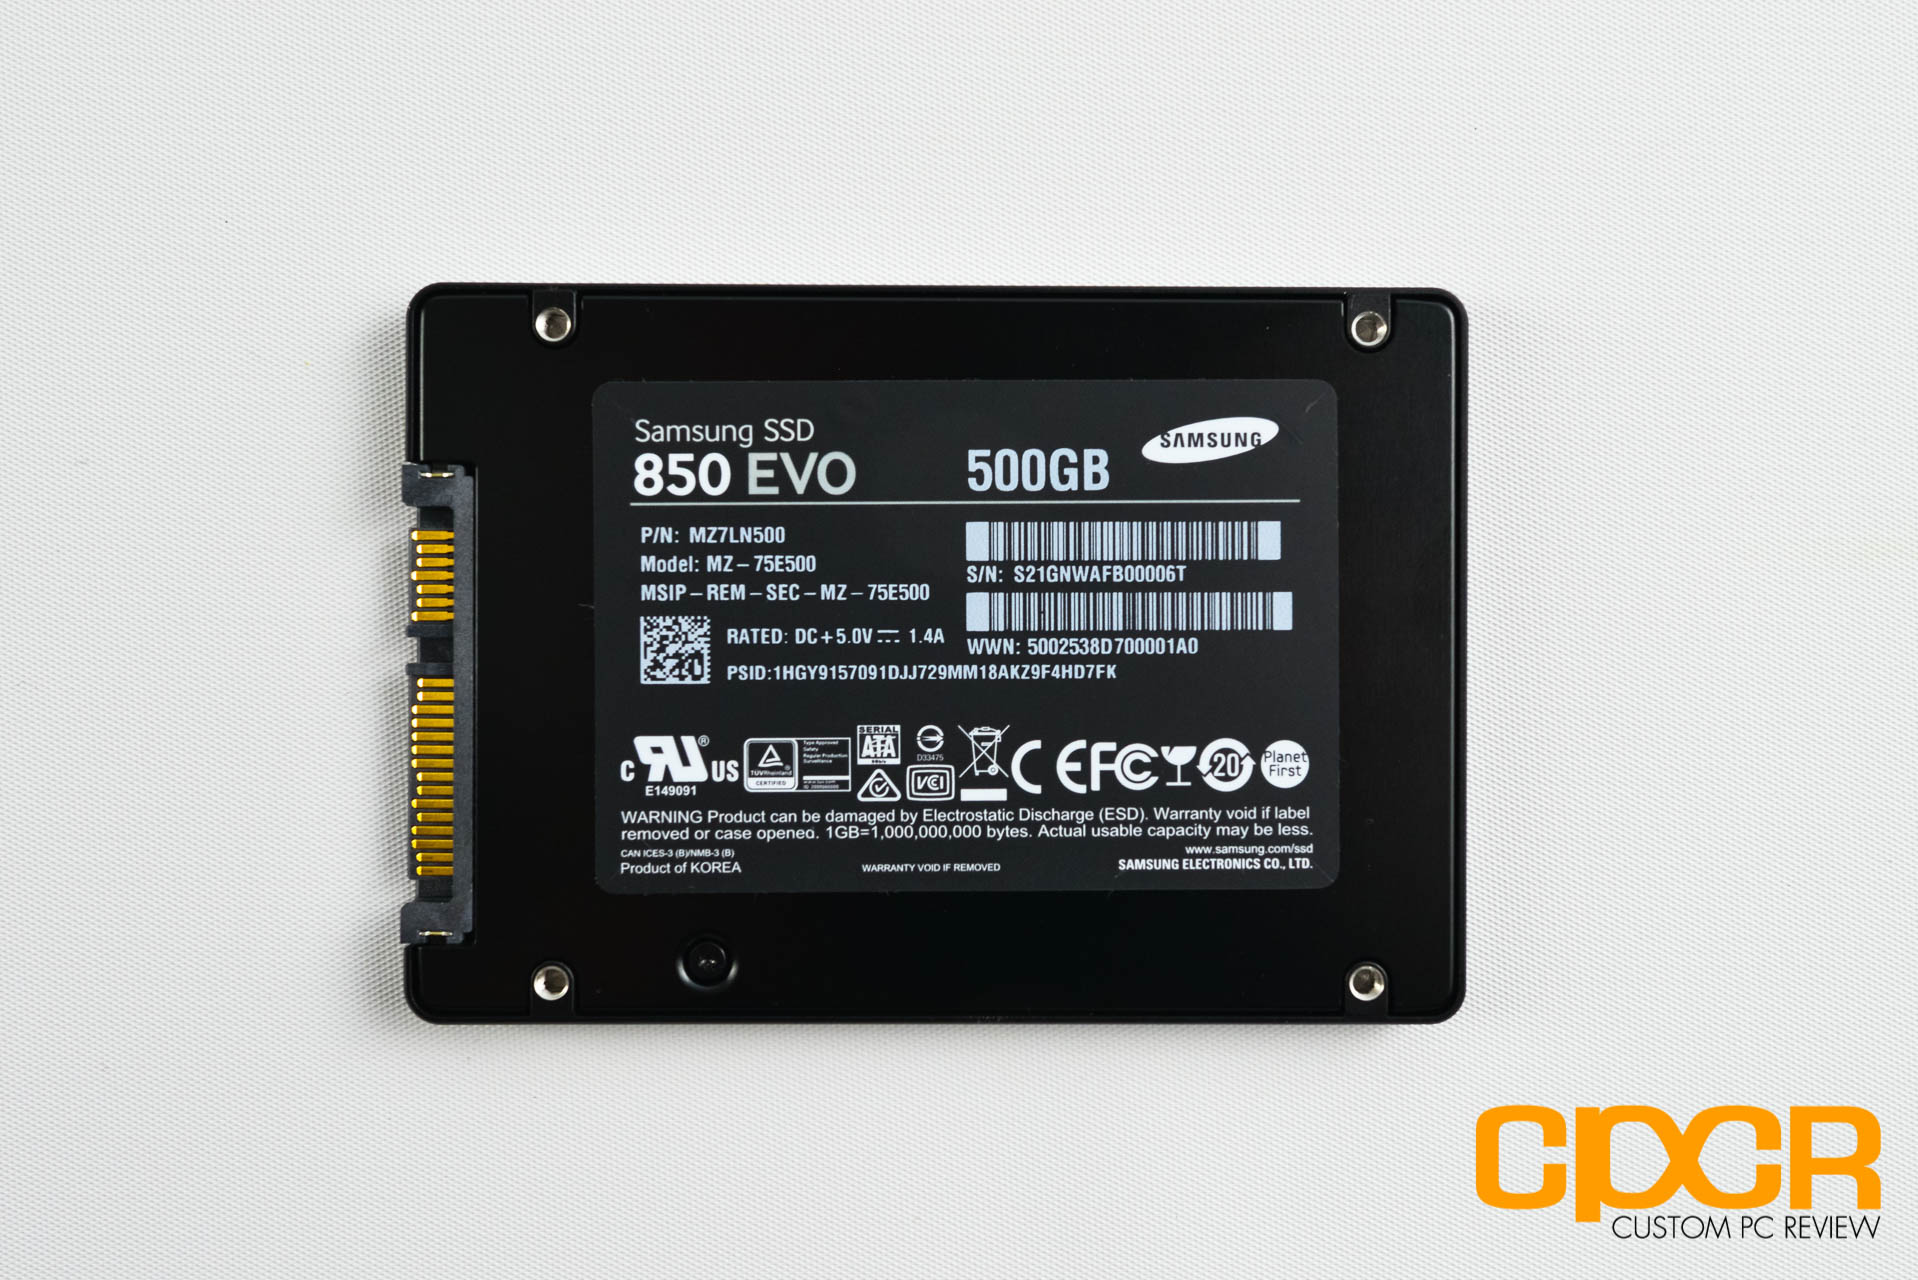
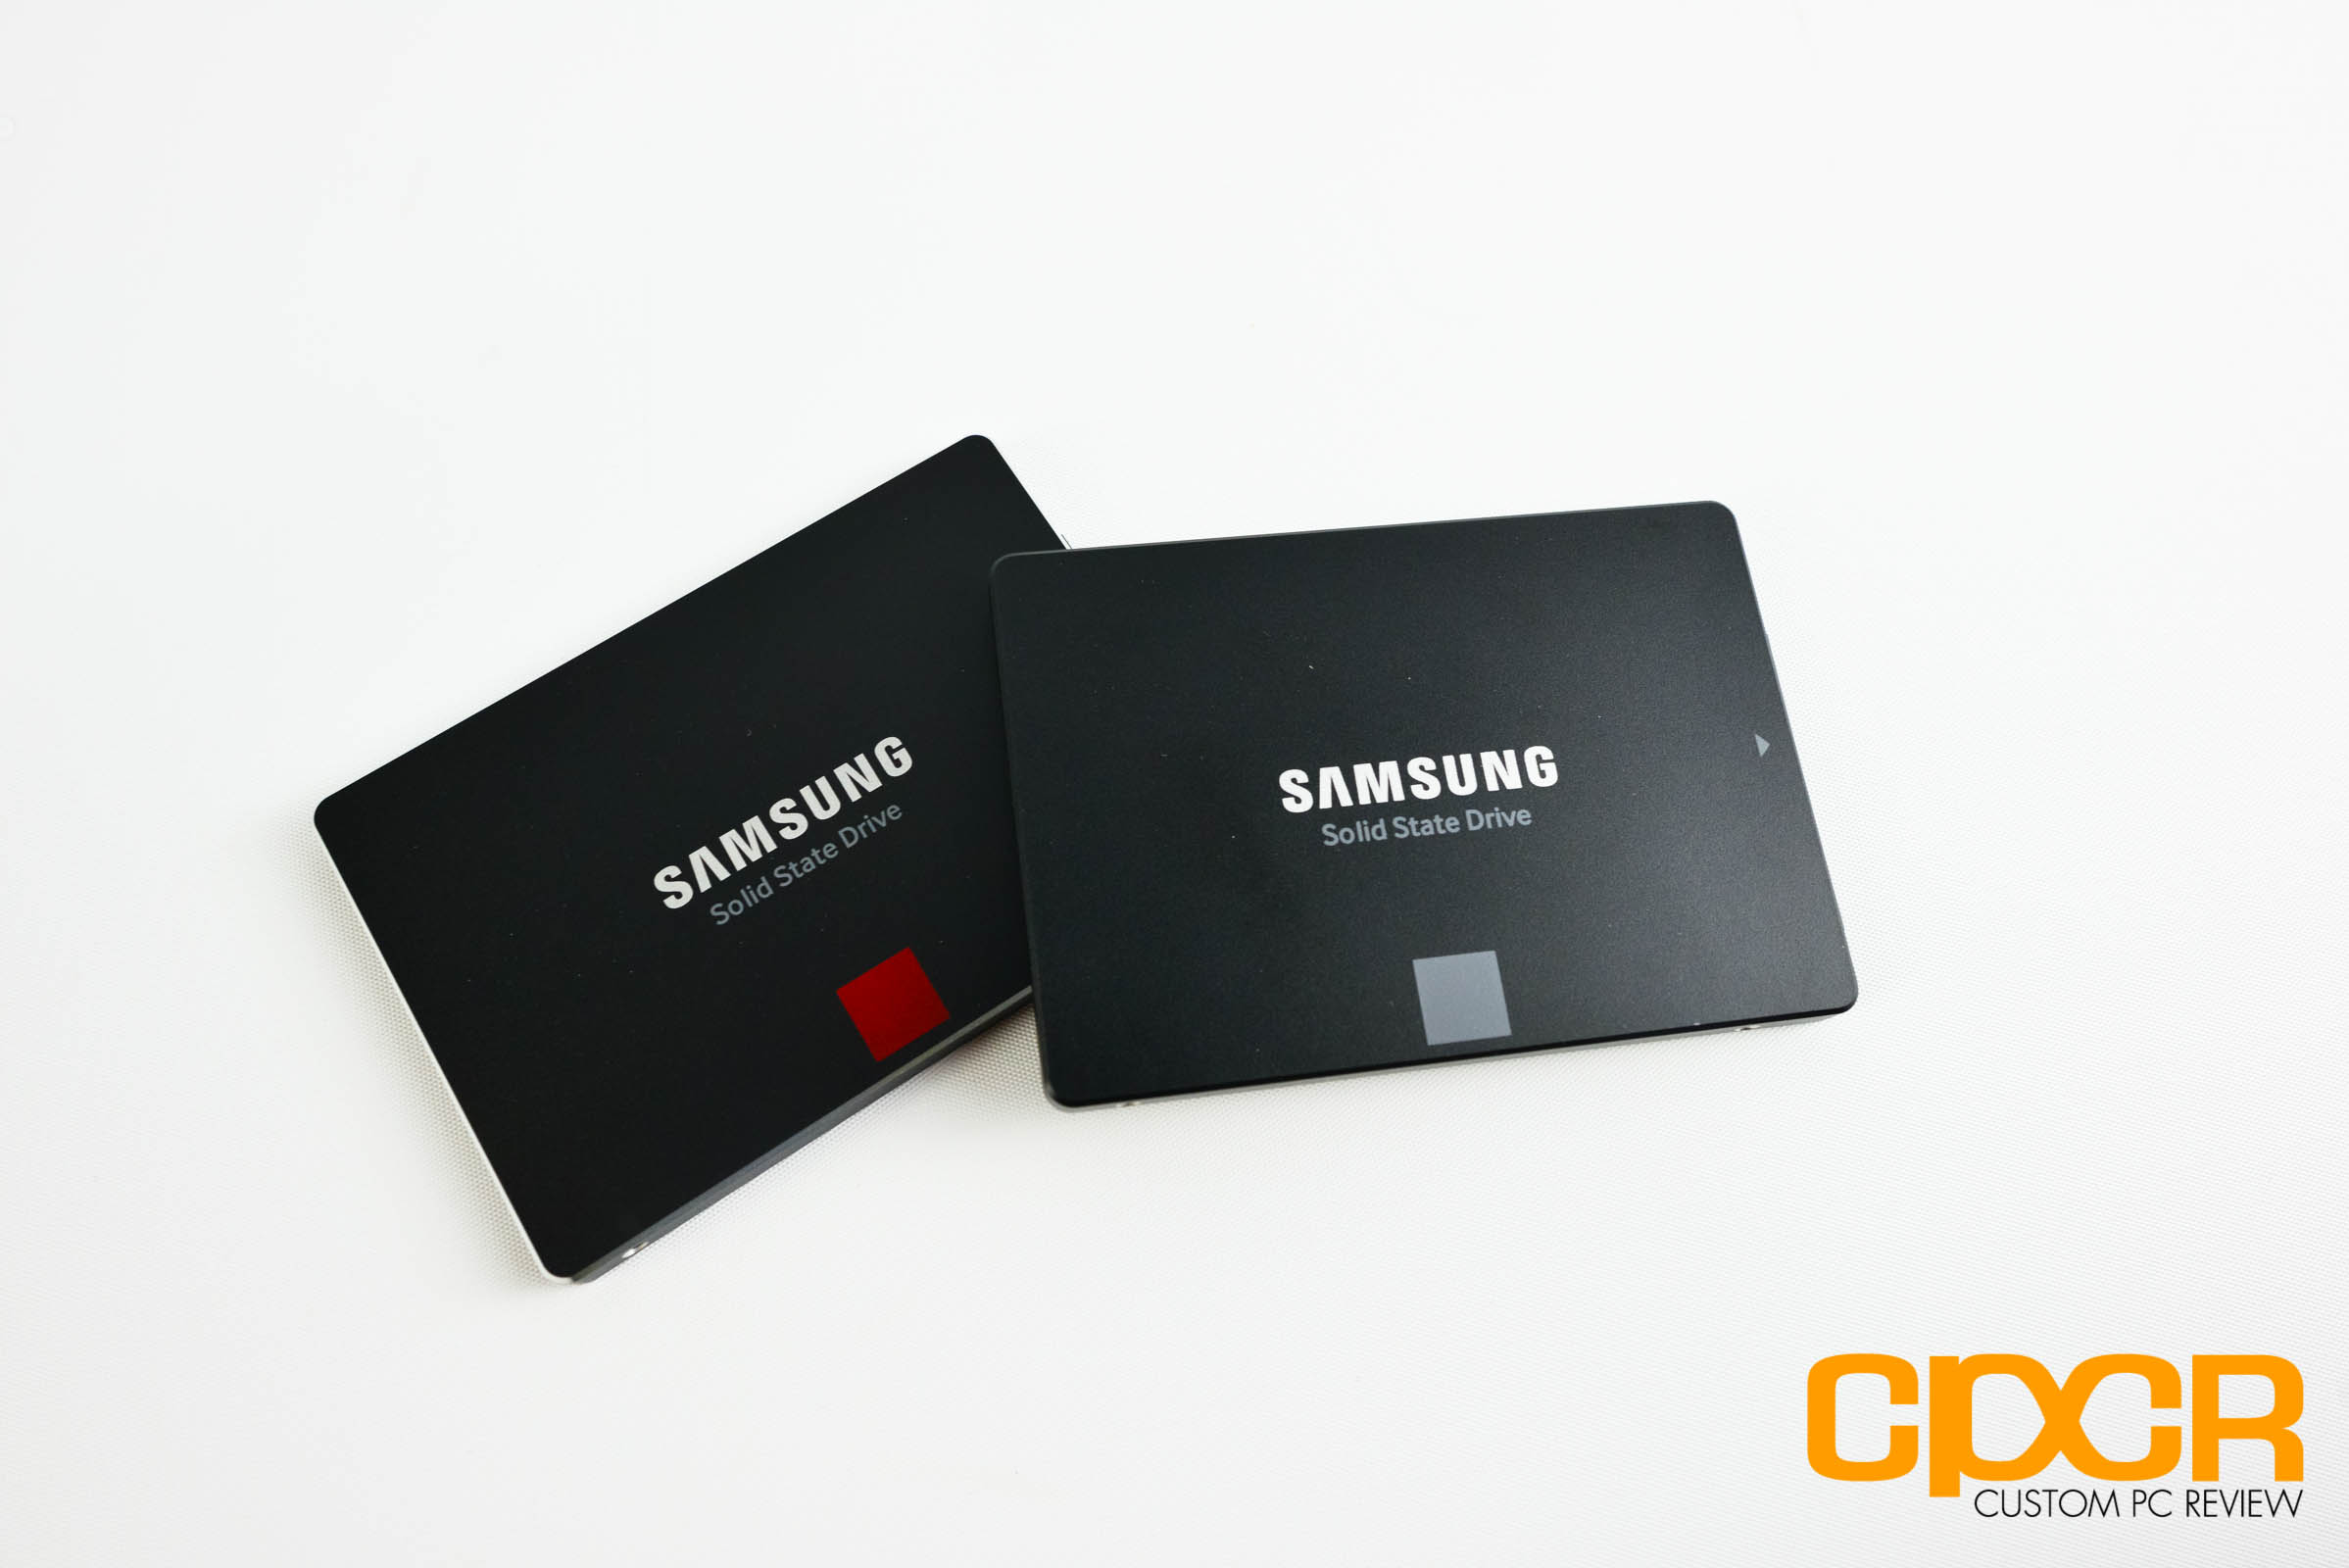
Here’s a look at the Samsung 850 EVO. In terms of case design, it really hasn’t changed much over the years ever since Samsung redesigned the casing when they launched the 840 and the 840 Pro several years back.
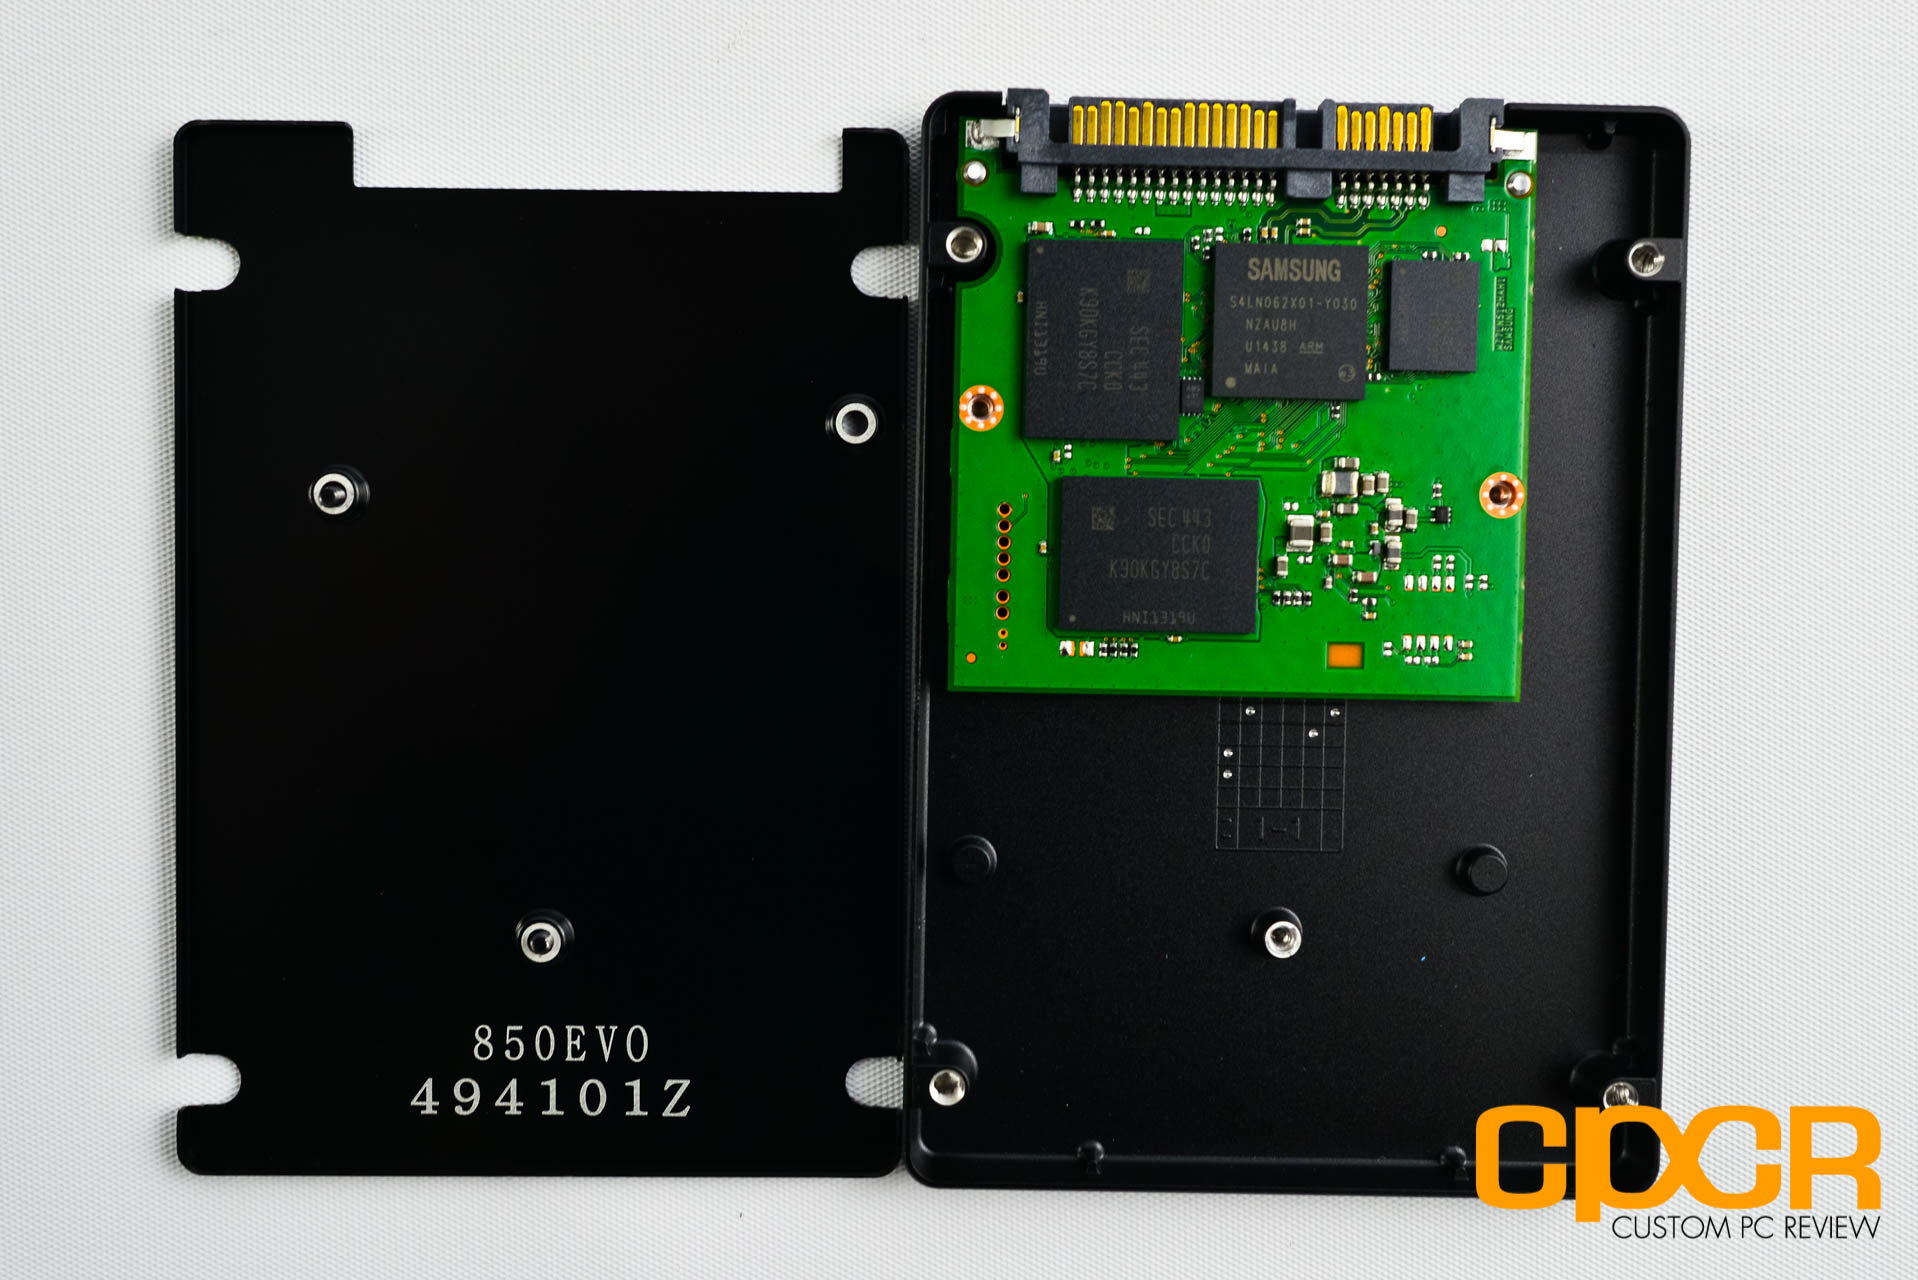
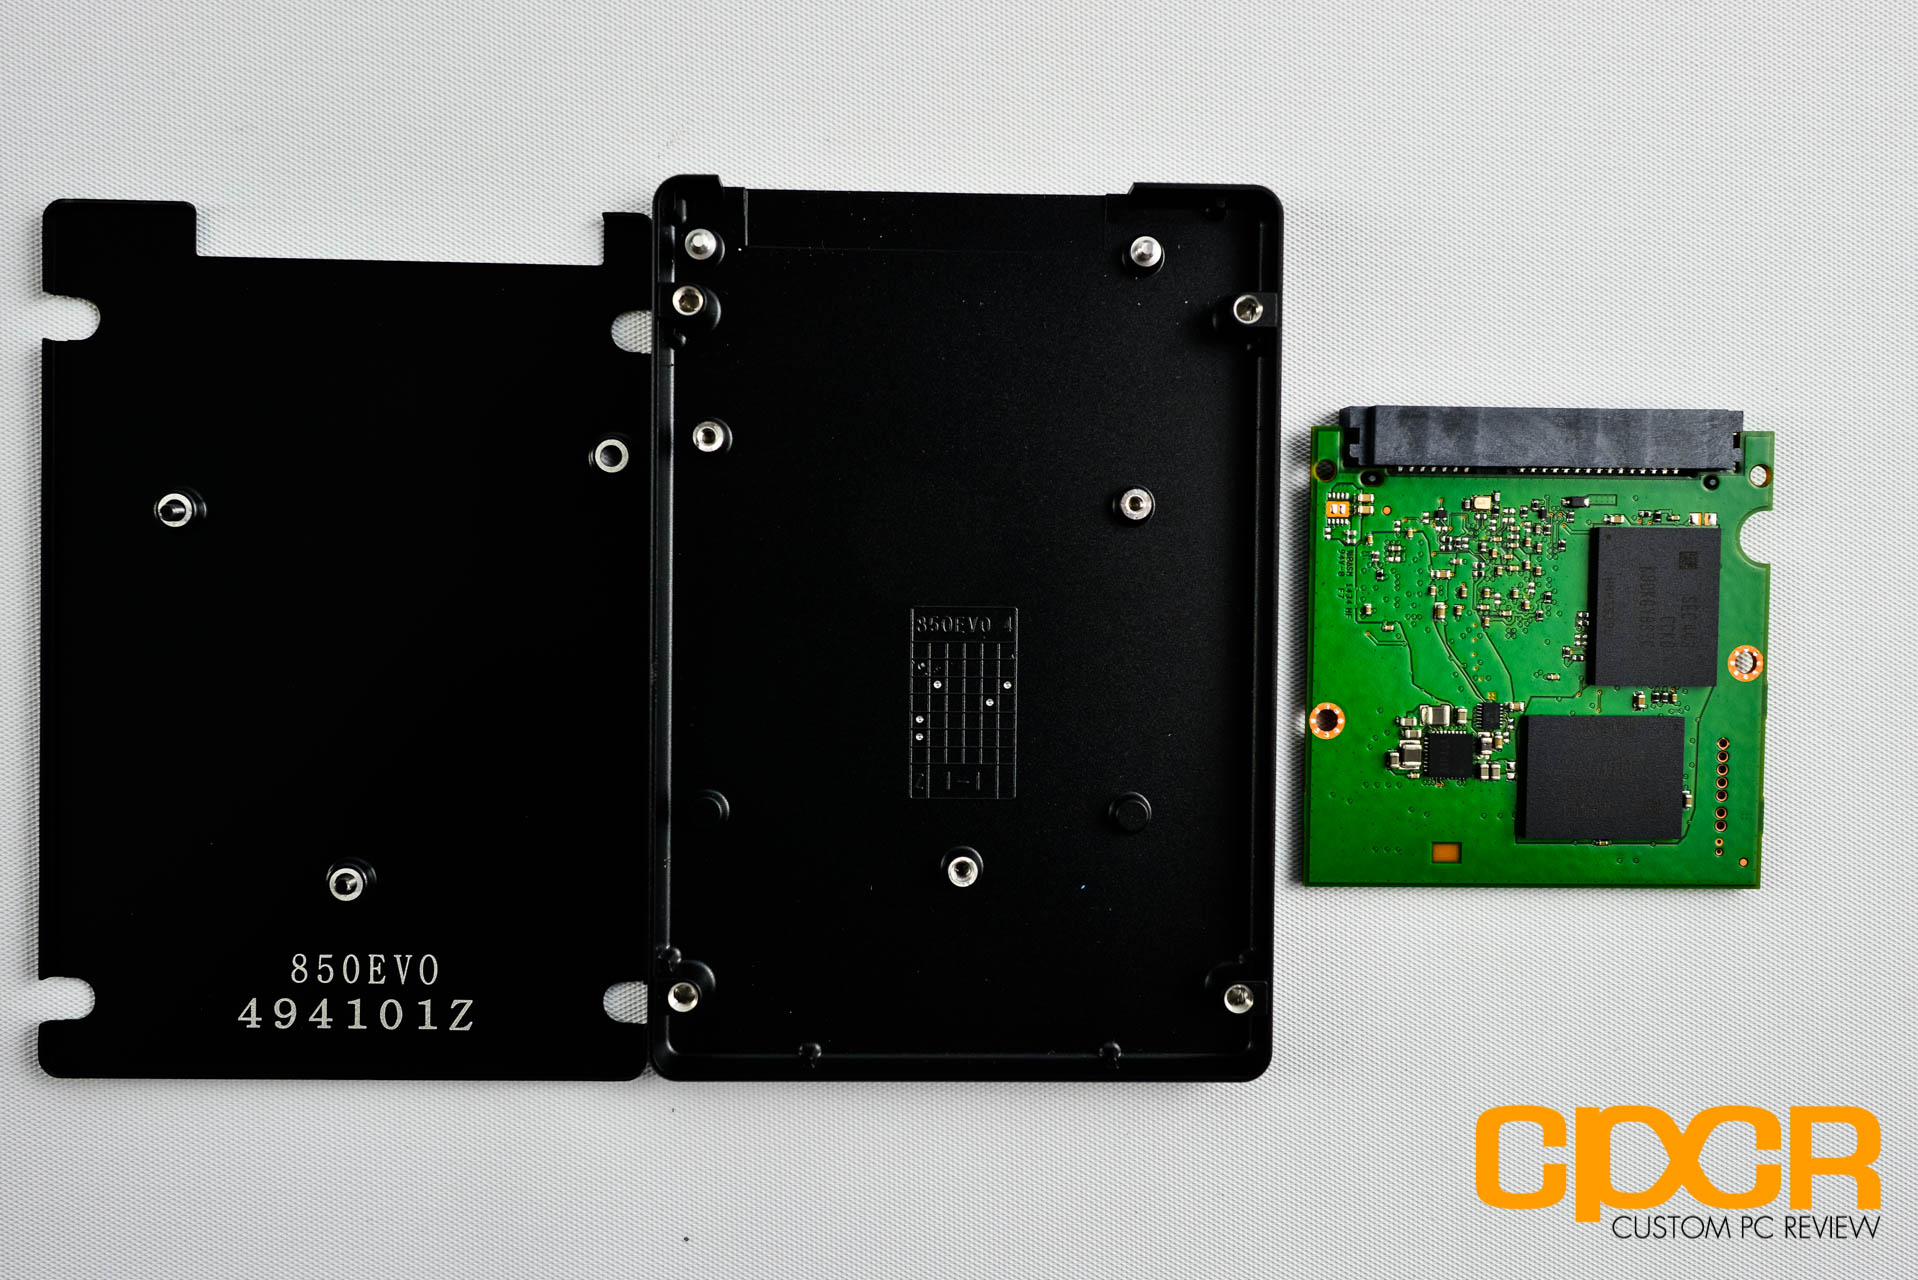
Cracking open the Samsung 850 EVO 500GB, we can see that Samsung is using a half sized PCB to help lower cost. Like the Samsung 840 EVO, Samsung has only included a total of four packages of NAND.
Here’s a look at the controller for the Samsung 850 EVO 500GB. For the new SSD, Samsung has developed a new controller, the Samsung MGX controller, which will power the 120GB, 250GB, and 500GB drives. For the 1TB Samsung 850 EVO however, Samsung is still using the older Samsung MEX controller that was first introduced with the Samsung 840 EVO last year.
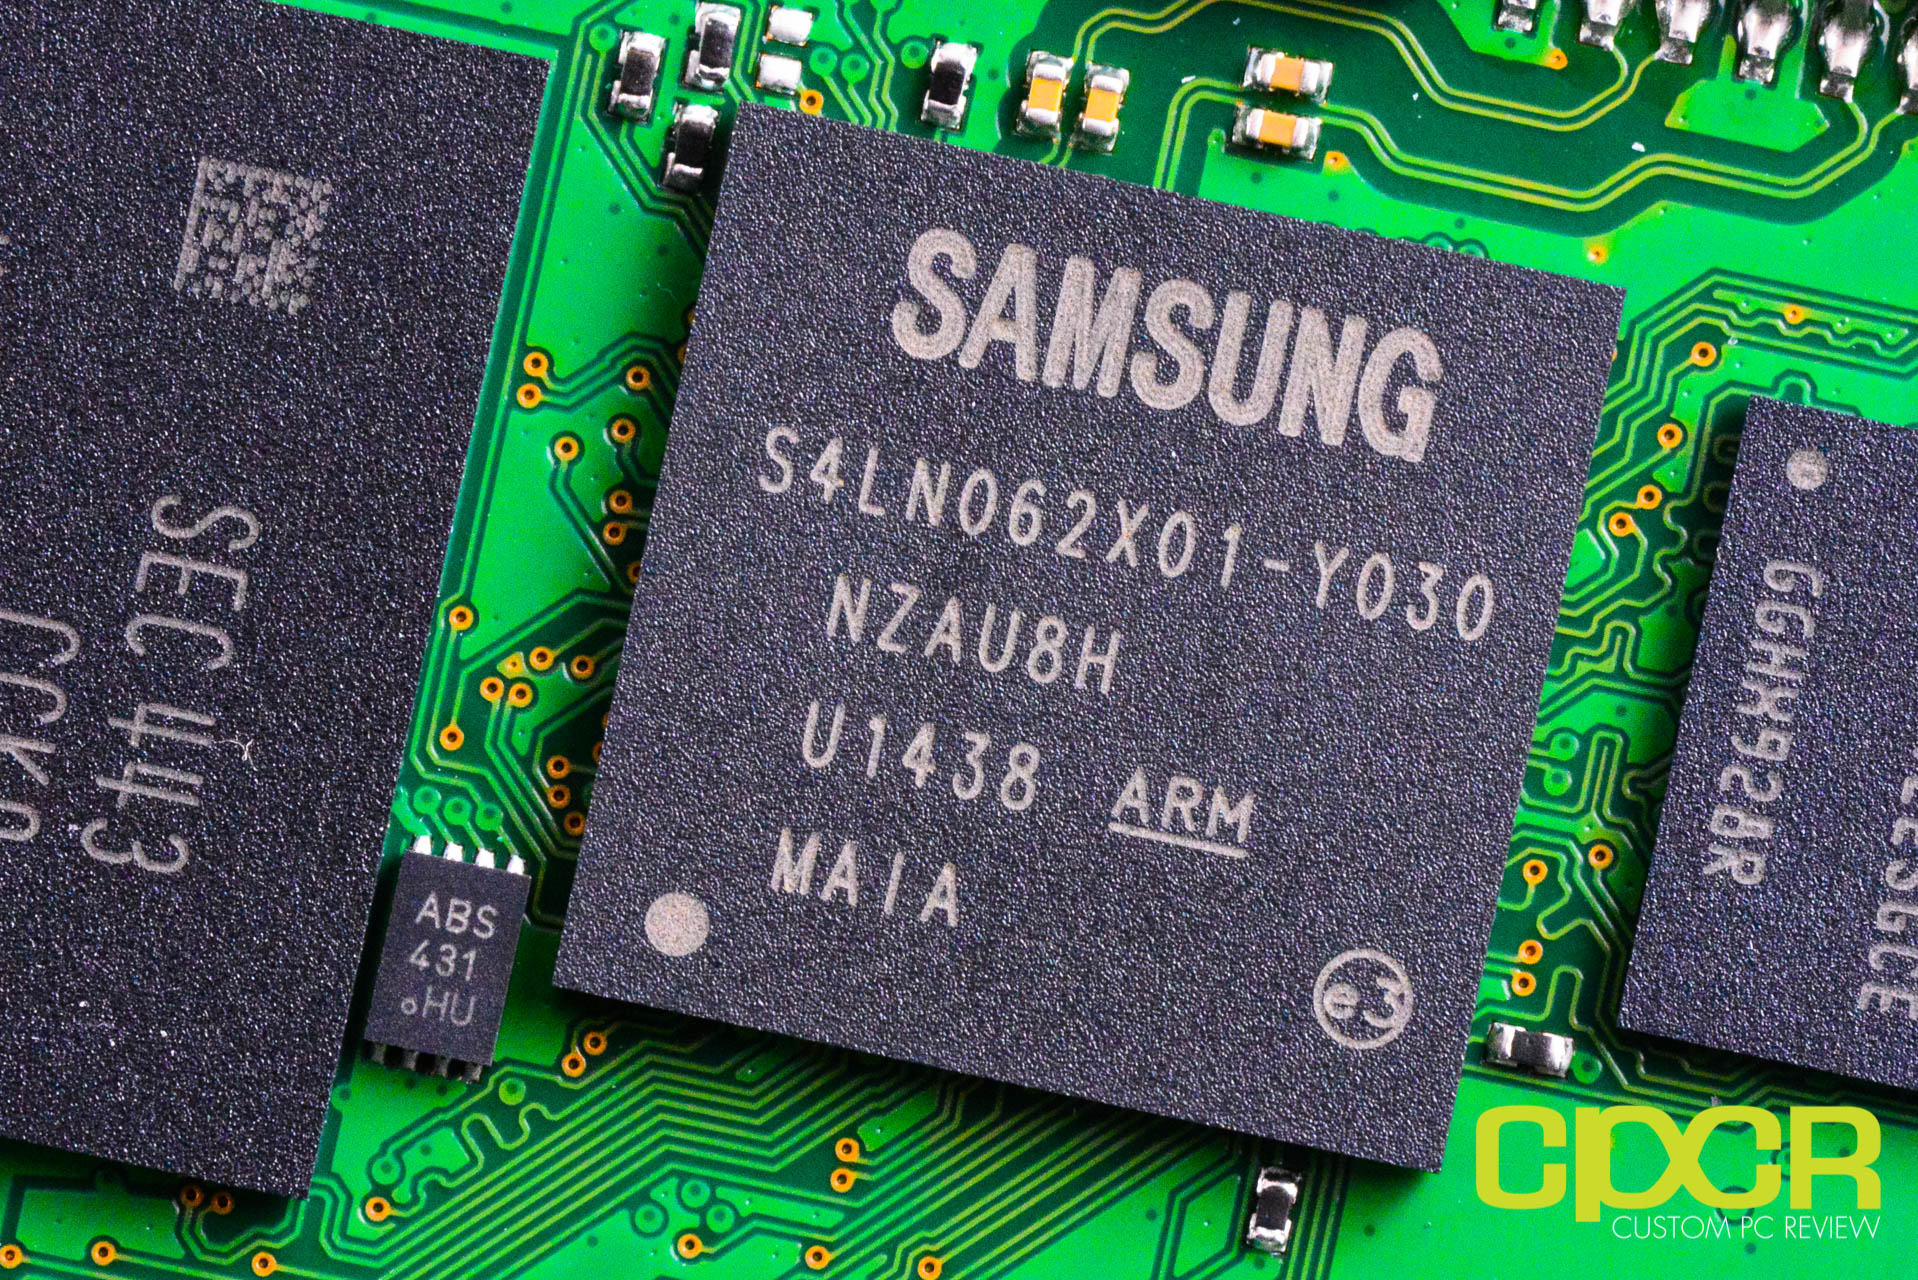
Since we received the 500GB Samsung 850 EVO for review, included in our drive is the Samsung MGX controller (Model# S4LN062X01-Y030). As usual, Samsung hasn’t shared any details on the specifics of the controller with the exception that the Samsung MGX uses a dual core processor. Additionally, no details were shared as to why only the lower capacities of the 850 EVO are using the new MGX controller while the 1TB drive is still using the older MEX controller.
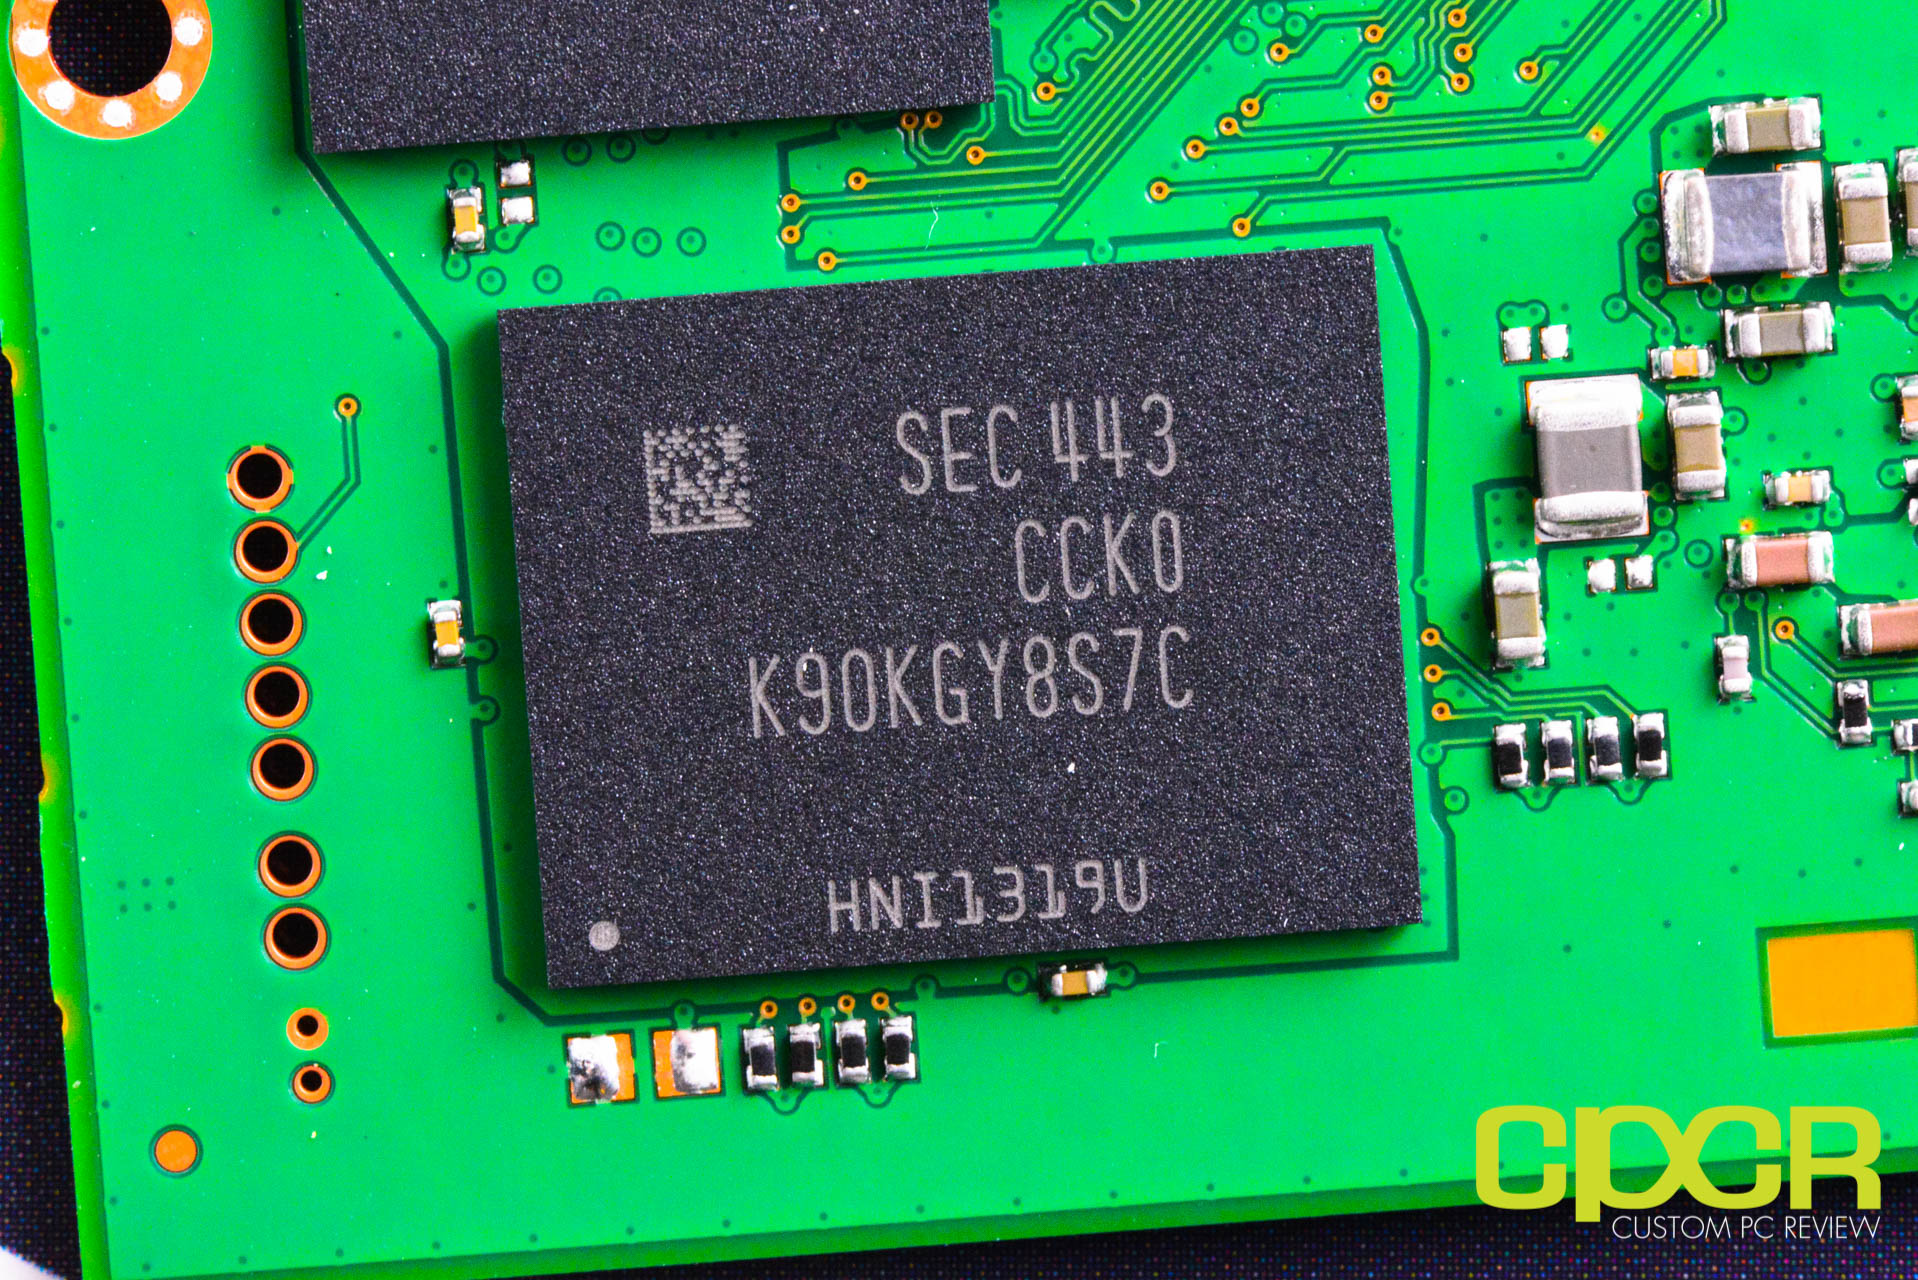
Here’s a first look at Samsung’s all new TLC (3-bit MLC) 3D V-NAND. As usual, we haven’t been given much on the specifics of the NAND, but this NAND should be based off the same process as the 2nd generation 40nm 2-bit MLC 3D V-NAND used in the Samsung 850 PRO. Since the 2-bit MLC 3D V-NAND in the Samsung 850 PRO used an 86Gb die size, the TLC 3D V-NAND dies used here should be ~1.5x the capacity, or ~128/129Gb.
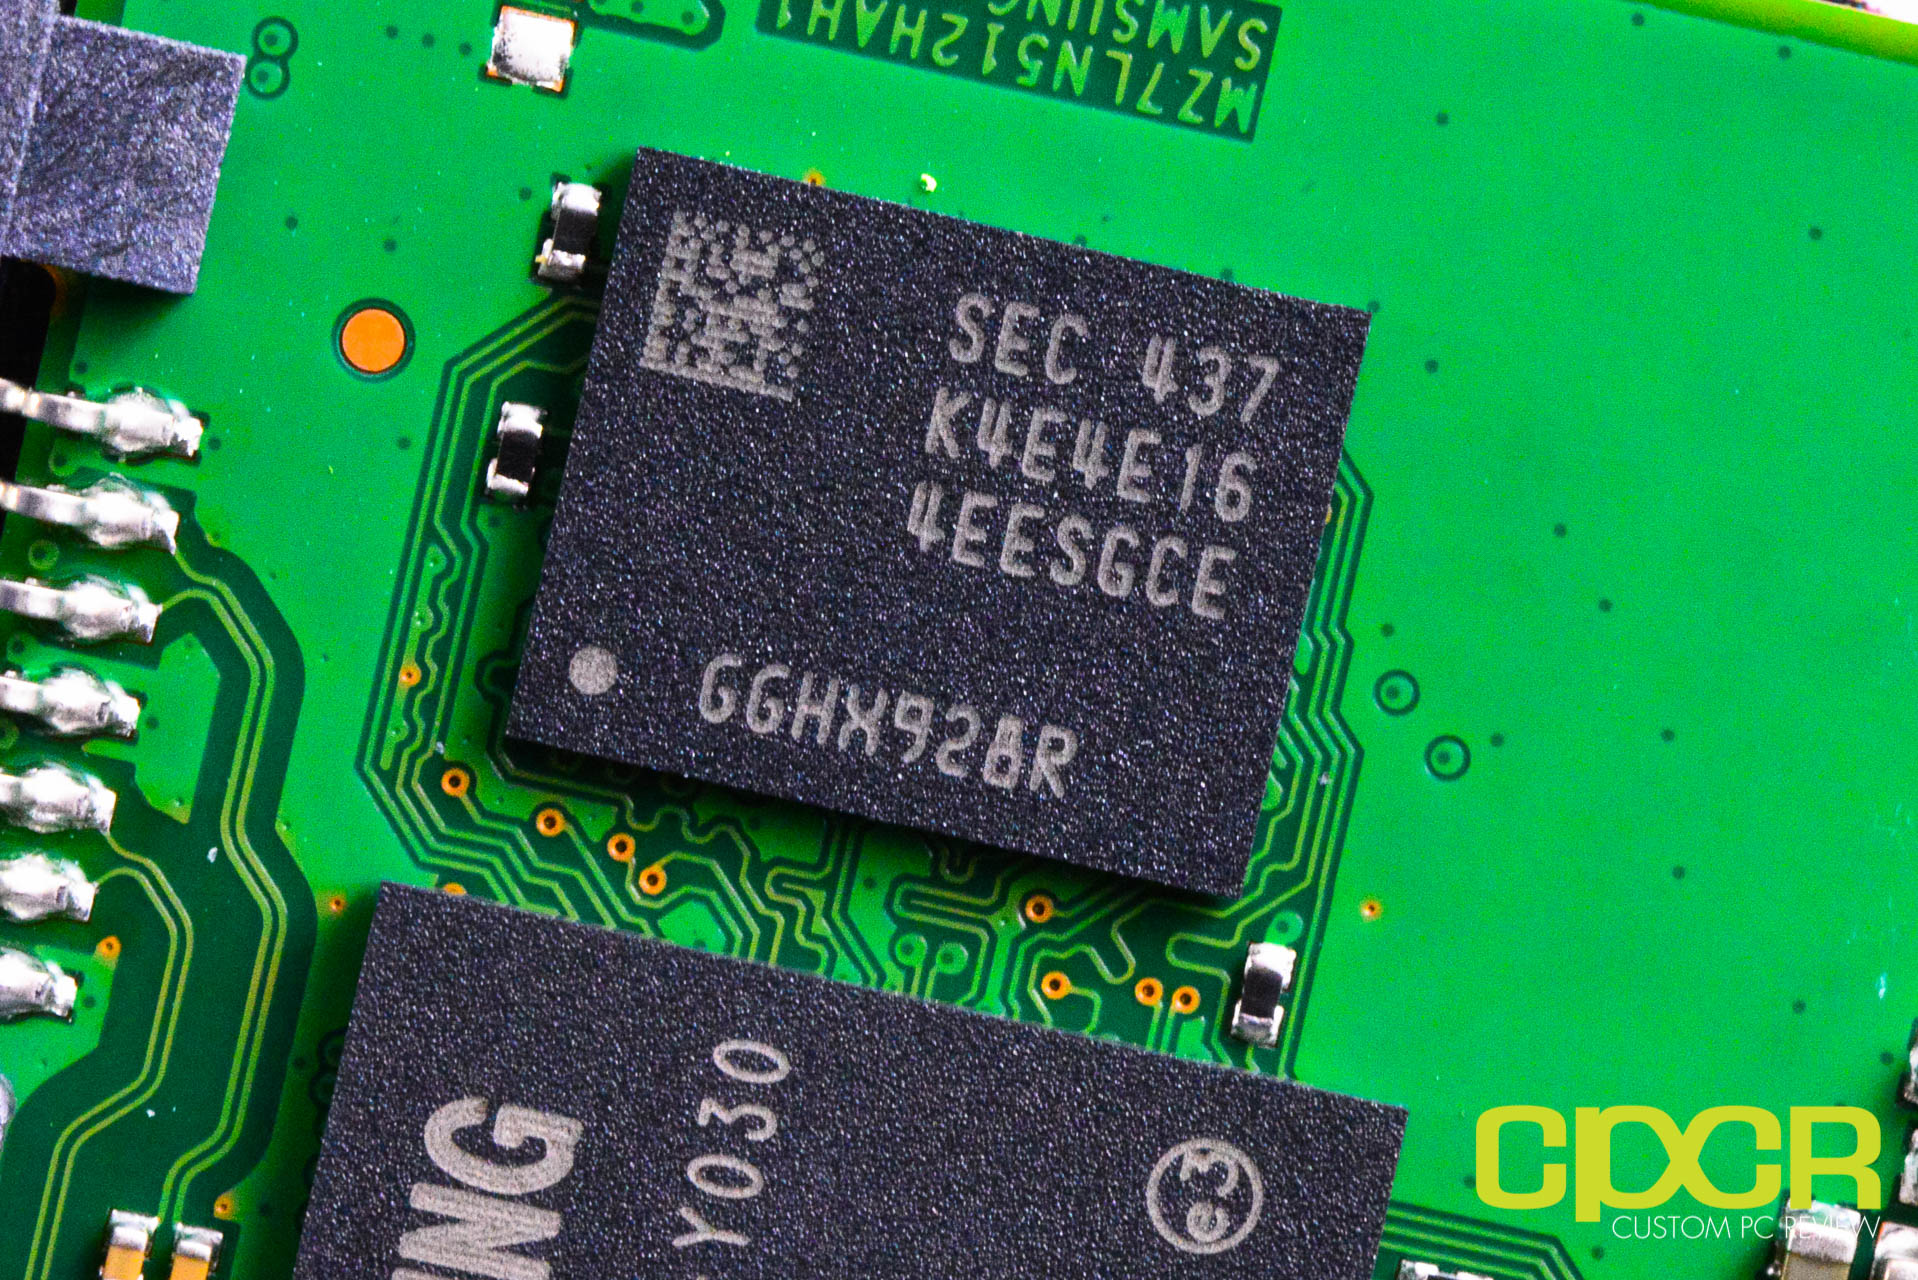
On the Samsung 850 EVO 500GB, Samsung includes 512MB of LPDDR2, which is about 1MB of DRAM/1GB of total NAND capacity. Similarly, the 120GB model gets 128MB and 1TB gets 1024MB for that 1:1 DRAM to NAND ratio as well. The 250GB Samsung 850 EVO however, gets 512MB of LPDDR2, which represents 2MB of DRAM/1GB total NAND capacity.
[section label=3. Test Setup and Drive Info]
Haswell Test Bench
As of October 5, 2013, we’ve upgraded our storage testing system to a Z87/Haswell testing platform. All SSDs used for comparison here have been updated to the latest firmware. Performance testing from storage reviews prior to that date should not be compared to our latest reviews.
| System | CyberPowerPC Gamer Xtreme 4200 |
|---|---|
| CPU | Intel Core i7 4770K |
| Motherboard | ASUS Z87-A |
| Memory | Kingston HyperX Genesis 16GB DDR3 2133MHz |
| Graphics | Intel HD4600 Graphics |
| Storage | OCZ Vertex 4 256GB |
| Power Supply | Corsair HX650 |
| Case | HSPC High Speed Tech Station |
| Optical Drive | ASUS OEM DVD Drive |
| Operating System | Windows 8 64 bit & CentOS 6.4 |
Special thanks to CyberPowerPC, Kingston, OCZ Technology and HSPC for sponsoring our test bench!
Crystal Disk Info
Samsung 850 EVO 500GB
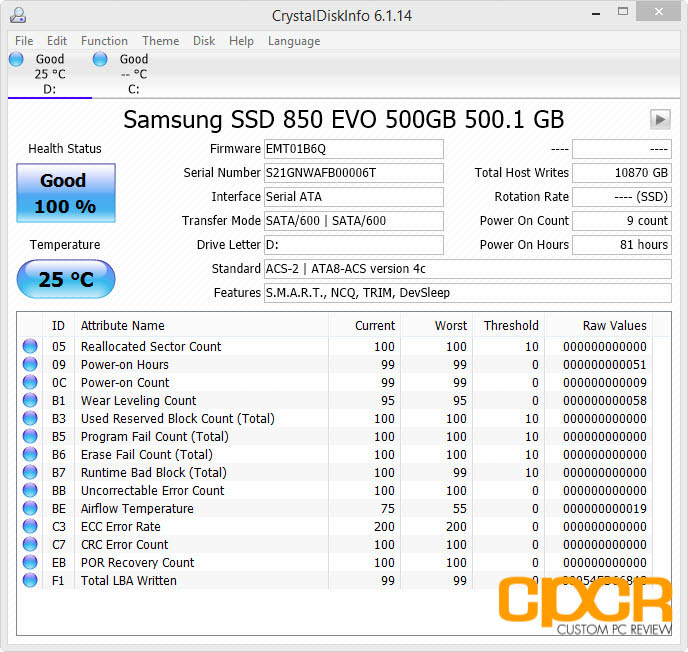
Today we’re reviewing the Samsung 850 EVO 500GB with the EMT01B6Q pre-production firmware. As expected, the Samsung 850 EVO includes all the latest modern SSD features such as TRIM, Native Command Queuing and DevSleep.
The Samsung 850 EVO is also fully compatible with basic 256-bit AES encryption or more advanced SED (Self Encyrpting Drive) features including TCG Opal 2.0 and IEEE-1667.
[section label=4. ATTO Disk Benchmark / AS SSD / Crystal Disk Mark]
Samsung 850 EVO 500GB Performance
ATTO Disk Benchmark v2.46
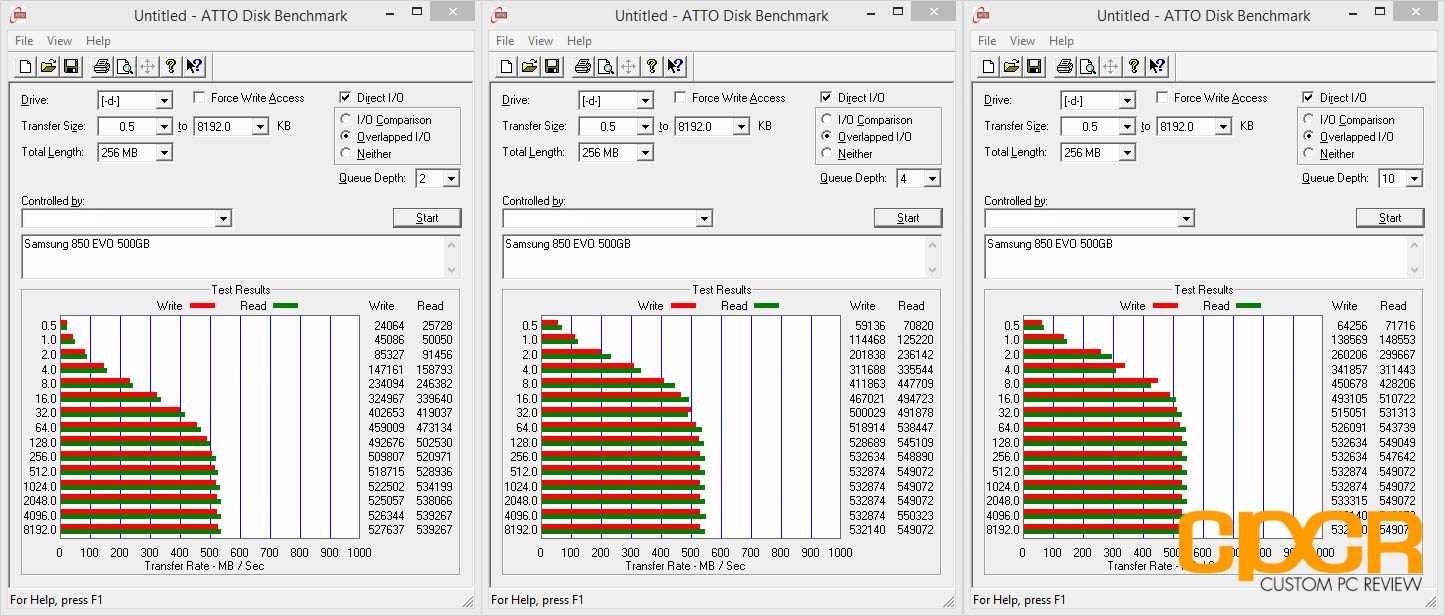
ATTO Disk Benchmark is one of the industry’s oldest and most popular benchmarks for testing disk read/write speeds. This benchmarks allows read and write testing using predefined block sizes and gives us a good idea of read/write speeds with different sized files. Most SSD manufacturers prefer using this benchmark when advertising SSDs as it tests using compressible data, which tends to yield best performance.
Performance Analysis
Kicking off with ATTO Disk Benchmark, the Samsung 850 EVO 500GB performed very well as expected reaching 550MB/s sequential reads and 532MB/s sequential writes. As usual it appears that Samsung was a bit conservative the specs as Samsung rated the 850 EVO 500GB at a maximum of 540MB/s sequential reads and 520MB/s sequential writes.
AS SSD Benchmark
AS SSD is a very commonly used benchmark used to measure SSD performance in a number of categories. Tests are run using incompressible data at QD1, which is most representative of light client workloads. AS SSD also outputs a final score at the conclusion of the test based off the overall performance of the drive.
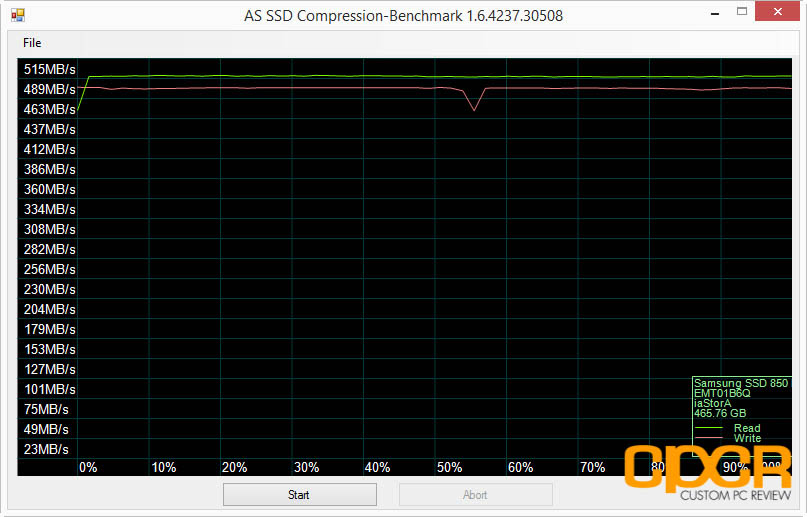
Additionally, we also run AS SSD’s included compression benchmark which tests the drive using data of varying compressibility. Some SSDs such as SandForce based SSDs tend to perform significantly better when the data is compressible.
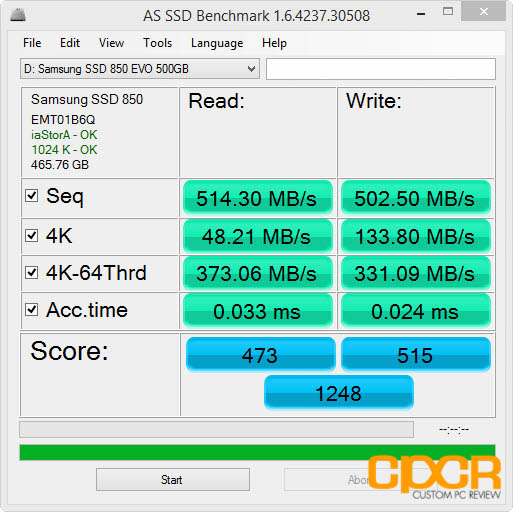
Performance Analysis
As a focus point for the 850 EVO, Samsung tweaked the drive for better performance at lower queue depths. Since AS SSD benchmarks at QD1, we can see that Samsung has done a very good job here almost completely saturating the SATA 6Gb/s bus with sequential reads/writes despite the lower queue depth. Similarly, 4K random read/write performance is very good as well with our sample testing at up to 48MB/s 4K random reads and 134MB/s 4K random writes. While we don’t normally rank the scores outputted by AS SSD, the Samsung 850 EVO 500GB has just taken the crown as the highest scoring SATA SSD we’ve tested.
Crystal Disk Mark 3.0.1 x64
Crystal Disk Mark is another popular benchmark which allows us to measure both sequential read/write speeds as well as random read/write speeds. With this benchmark, tests can be run using both random fill (incompressible data) and 0 fill (compressible data). Realistically in typical computer usage scenarios, data being transferred will consist of a mixture of both incompressible and compressible data.
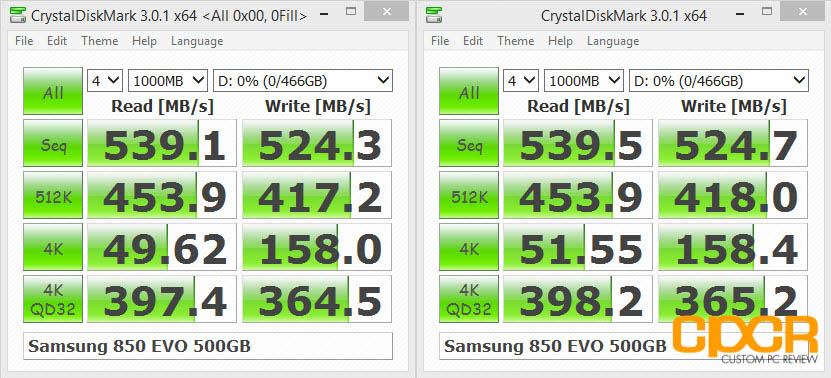
Performance Analysis
While the Samsung 850 EVO 500GB did very well in AS SSD, the drive did equally well in Crystal Disk Benchmark, which we run at QD4 representing heavier client workloads. Looking at the results here, the drive posted an impressive 540MB/s sequential reads and 525MB/s sequential writes along with 52MB/s 4K random reads and 155MB/s 4K random writes. Again, this is among the best performance we’ve seen from any SATA SSD.
[section label=5. PC Mark 7 / PC Mark 8]
Samsung 850 EVO 500GB Performance
PC Mark 7 Storage Benchmark
The PC Mark 7 storage benchmark is a trace based benchmark that evaluates the SSD under many different real world environments such as gaming, multimedia editing, etc. PC Mark 7 uses a relatively light workload, which represents a typical mainstream client storage sub-system workload.
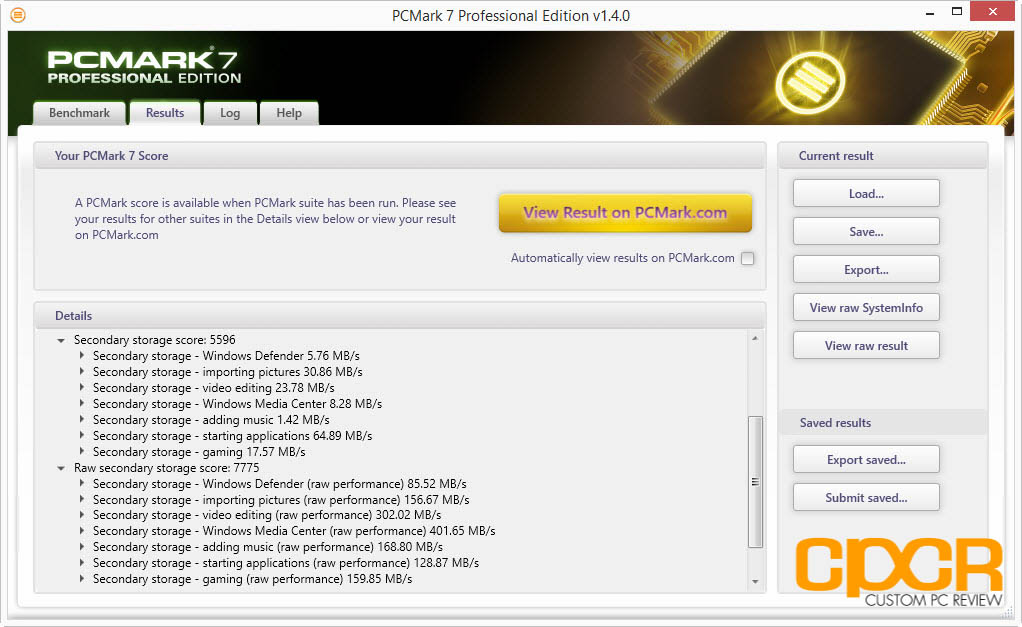
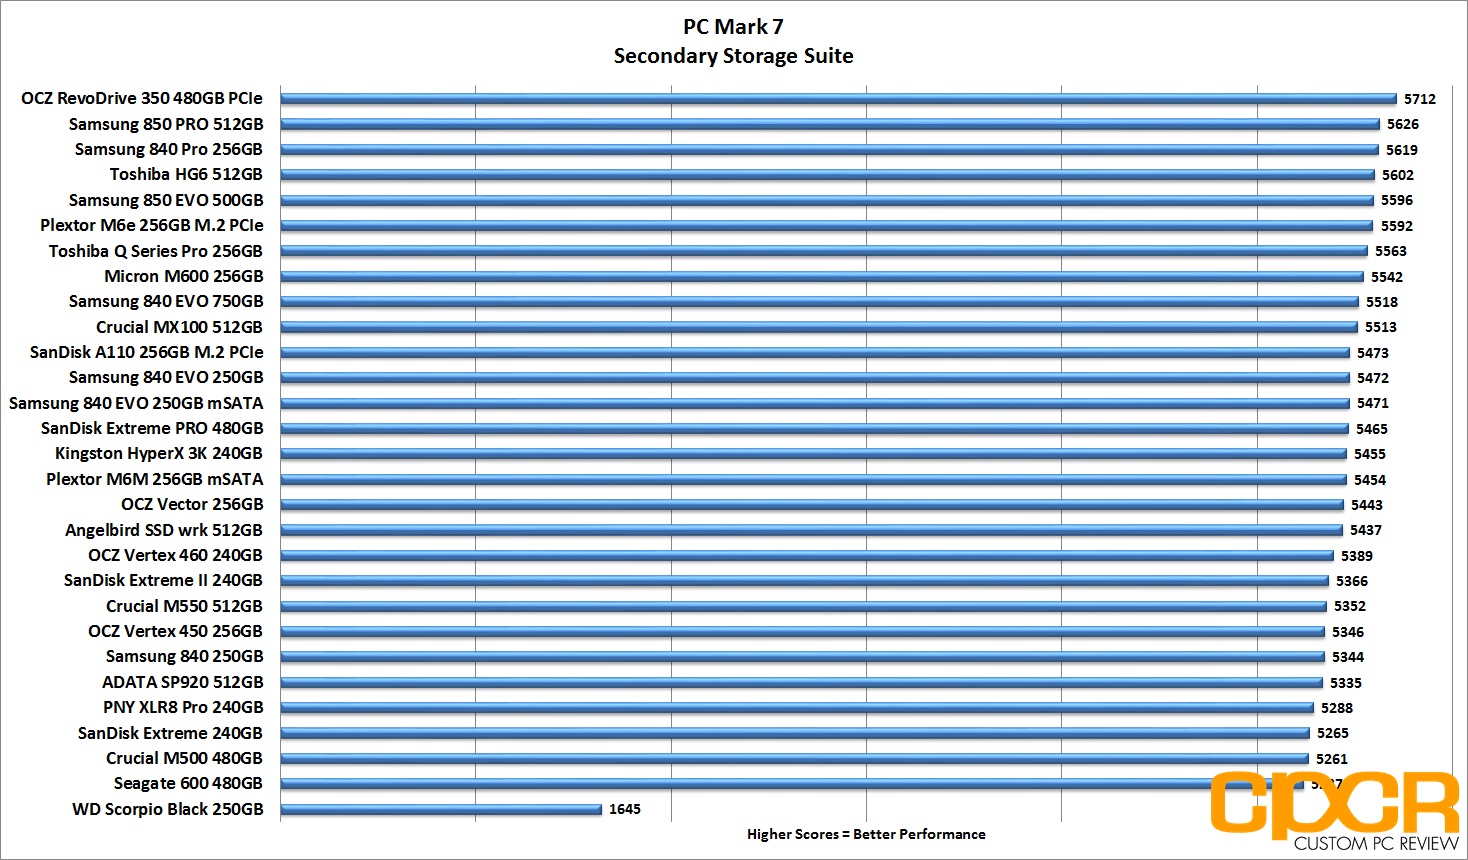
Performance Analysis
Moving onto PC Mark 7’s Storage Benchmark, the Samsung 850 EVO 500GB once again performed very well scoring at the top of the charts right behind the Samsung 850 PRO, Samsung 840 PRO, and the Toshiba HG6.
PC Mark 8 Expanded Storage Benchmark
With the introduction of PC Mark 8 2.0.228, Futuremark added the option for an Expanded Storage Benchmark which is literally designed to bring any storage system its absolute limits. The new PC Mark 8 Expanded Storage Benchmark takes around 24 hours to run and for our purposes, we’ll be using the consistency test which measures performance consistency, degradation tendency, and recovery speed of a storage system.
Consistency Test
Full details on the consistency test can be found in the PC Mark 8 Technical Guide here. For the more simplified version, the test is basically a near 24 hour, five phase benchmark – three of which we’ll be reporting on in our results below.
- Phase 1 is a precondition phase designed to “dirty” the drive with random data. The entire drive is filled twice to the capacity of the drive.
- Phase 2 is a degrade phase where the drive is hammered with tons of random data followed by a performance test run. This is done 8 times.
- Phase 3 is the steady state phase where the drive is once again hammered with tons of random data followed by a performance test run. This is done 5 times.
- Phase 4 is the recovery phase where the drive is given 5 minutes to rest followed by a performance test run. This is done 5 times.
- Phase 5 is the clean up phase where the drive is simply secure erased.
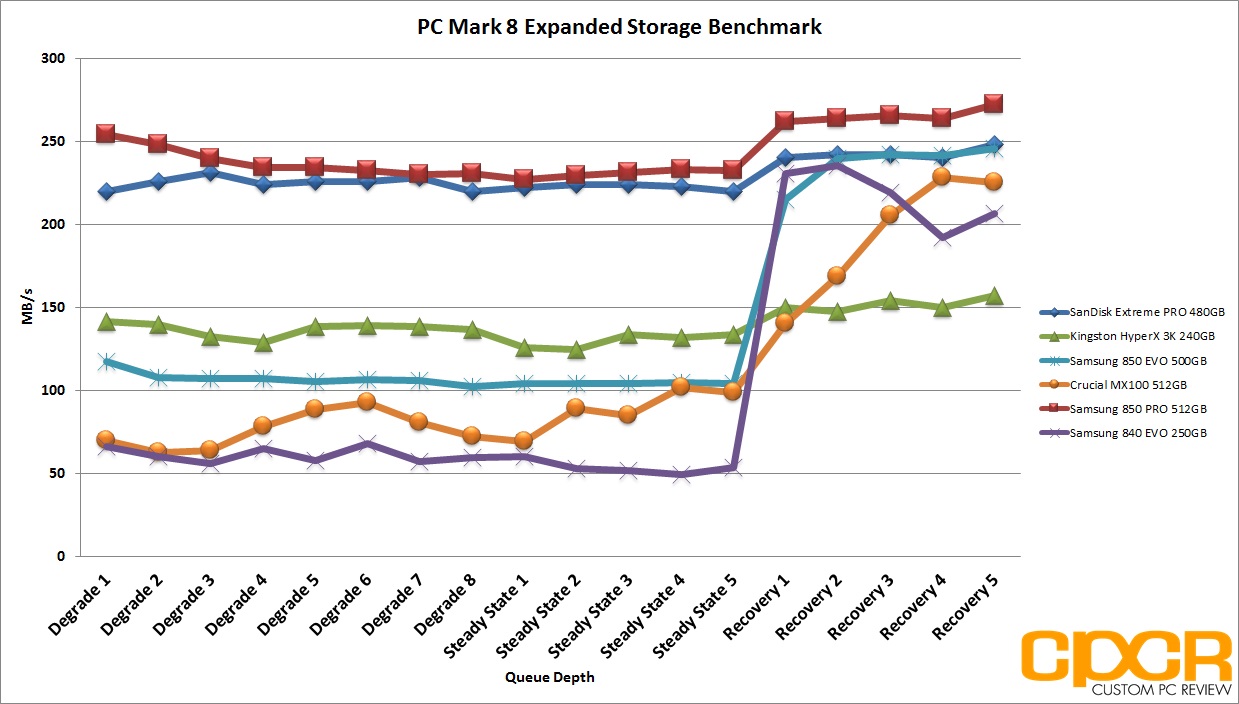
Performance Analysis
Although the Samsung 850 EVO 500GB performed extremely well in the lighter PC Mark 7 Storage Benchmark, it quickly shows its weaknesses in the PC Mark 8 Expanded Storage Benchmark. When faced with a heavy workload, the Samsung 850 EVO 500GB instantly drops to the lower half of the charts along with the rest of the mainstream SSDs. This is precisely why an enthusiast drive like the Samsung 850 EVO or SanDisk Extreme PRO is significantly more expensive than say a Samsung 850 EVO or Crucial MX100.
That said, it’s nice to see that the Samsung 850 EVO does significantly outperform its predecessor, the Samsung 840 EVO, although it’s worth noting that it’s an unfair comparison as our Samsung 840 EVO sample was a 250GB model, which is slower than the Samsung 840 EVO 500GB, 750GB and 1TB models.
One thing that’s interesting to note about the mainstream SSDs is that they’re very quick to recover as long as there’s some idle time to allow for some internal maintenance operations. In the recovery phases of the benchmark where no load is placed on the drive between benchmark runs, the Samsung 850 EVO was able to match the performance of the enthusiast oriented SanDisk Extreme PRO.
[section label=6. FIO – FOB]
Samsung 850 EVO 500GB Performance
FIO (Flexible I/O Tester)
FIO, which stands for Flexible I/O Tester, is basically what its name says – a flexible I/O tester / I/O workload generator. Whereas all the benchmarking tools we’ve used previously are fantastic, easy to use benchmarking tools that provide a good snapshot of SSD performance, they do lack a lot of versatility, especially for more complex and in-depth operations such as custom queue depths, block sizes, test run times, etc. While the testing that follows may not pertain to typical consumer usage, they do help give us a much more in-depth look at each individual product’s strengths and weaknesses when they’re pushed to the limits.
FIO – FOB (Fresh Out of the Box) Testing
When SSDs are brand new and Fresh Out of the Box, they’re generally able to perform at or outperform their advertised speeds, but unlike traditional hard drives, performance on SSDs begin to degrade over time as they become more and more used. This is because while SSDs are new, all bits on the SSD are empty, so they can instantly be programmed with data. However, once data gets programmed in, even if it’s deleted in the filesystem the actual data will still stay programmed on the NAND itself unless some sort of garbage collection routine comes in to wipe the data. Unfortunately, in order to write new data onto “dirty” NAND, the NAND needs to go first through an erase cycle to erase the old data before a program cycle can happen to program new data, which as you may imagine takes more time than just a simple program cycle. As this only happens when writing new data onto the SSD, you’ll generally see less performance degradation on reads and more performance degradation on writes.
For our FOB testing, we run a secure erase on the SSD then run each test sans any preconditioning. This will provide us with the highest level of performance the SSD is capable of and is likely never to be seen ever again once the SSD goes into a used state.
Our testing will include 4K read testing, 4K write testing, and 4K 70/30 read/write mix testing at queue depths of 1,2,4,8,16,32,64,128,256. The reason we’ve also included 4K 70/30 read/write mix testing is simply because most real world workloads will always fall somewhere between 0% write and 100% write rather than one or the other. Since client usage is much more read heavy, we’ll be using the 70/30 read/write mix.
For general client usage, performance will fall somewhere between queue depths of 1-4 whereas servers and other enterprise applications will easily see queue depths of 32 or greater.
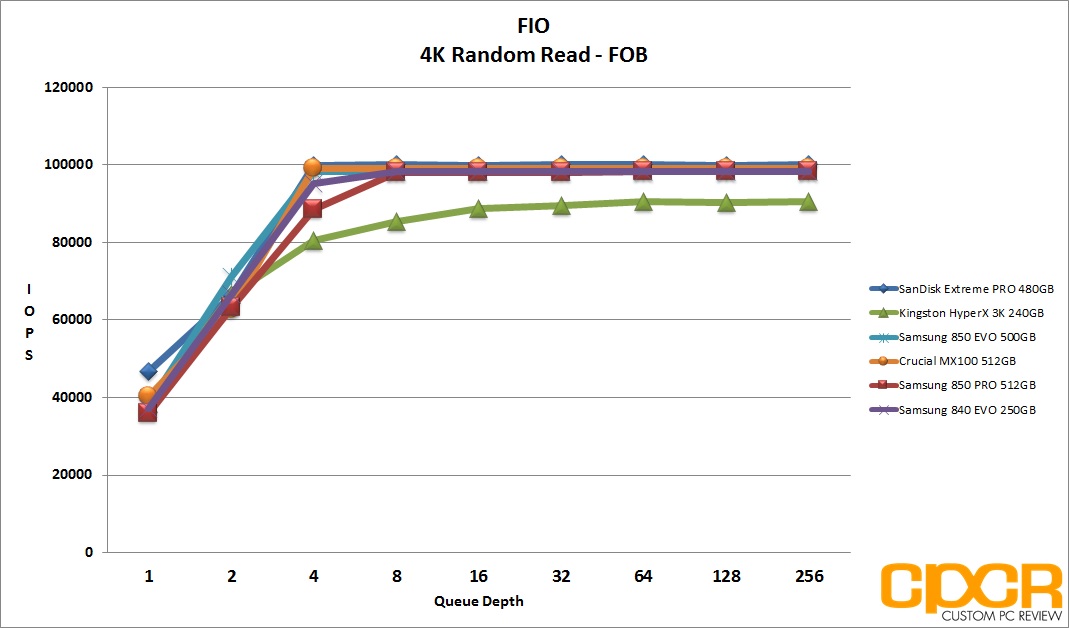
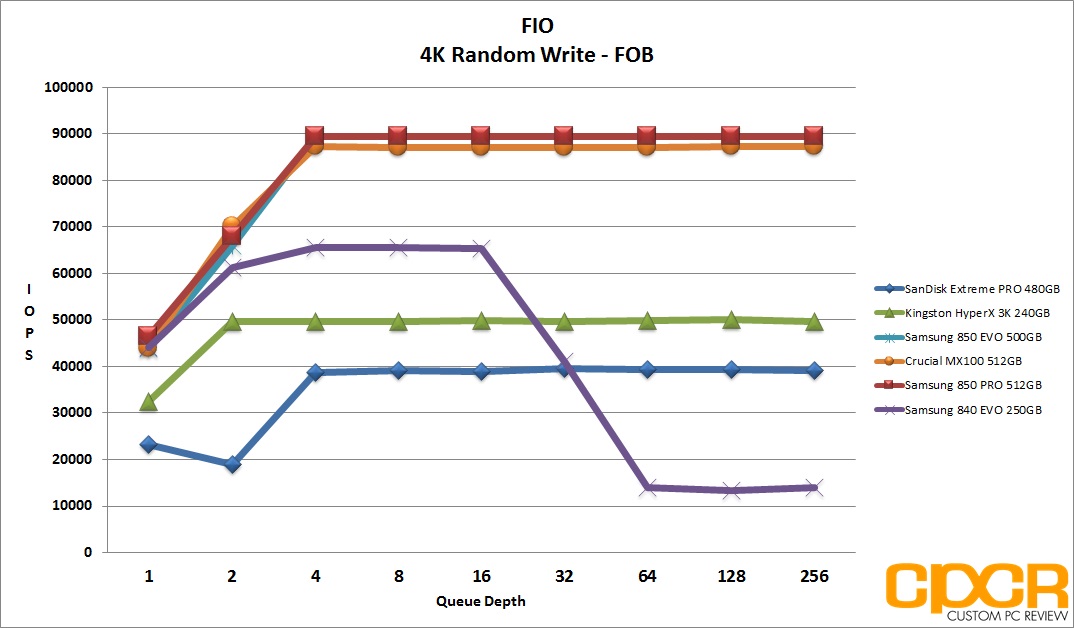
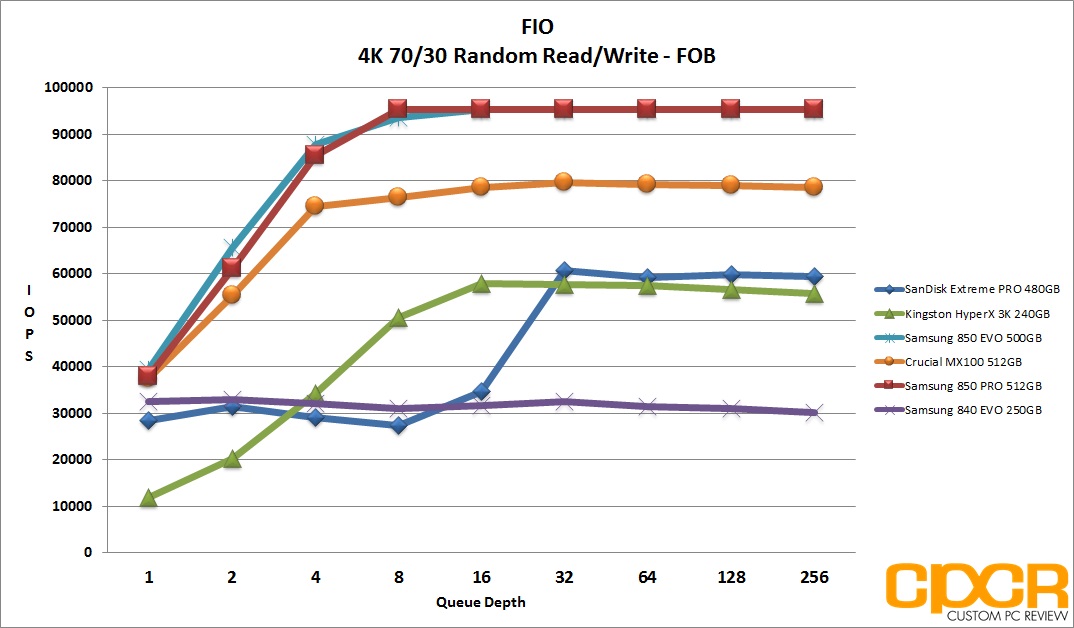
Performance Analysis
As expected, the Samsung 850 EVO 500GB is a solid performer out of the box pushing 98,000 IOPS 4K random read and 89,000 IOPS 4K random write. 70/30 read/write mixed workload performance is among the best we’ve seen from any drive on the market as well with the drive pushing just shy of 96,000 IOPS.
[section label=7. FIO – Steady State]
Samsung 850 EVO 500GB Performance
FIO – Steady State Testing
After prolonged use of an SSD, it will reach “steady state” where performance levels off to a minimum level. The FOB state is the “best case scenario” for SSD performance while “steady state” is going to be your worst. Here, we ran the exact same set of benchmarks we just completed in the FOB state; except this time around, we’ll be preconditioning the drive by filling 100% of the drive’s LBAs with two sequential passes of 128k data followed by hammering the drive for six hours with 4K random data prior to actual testing.
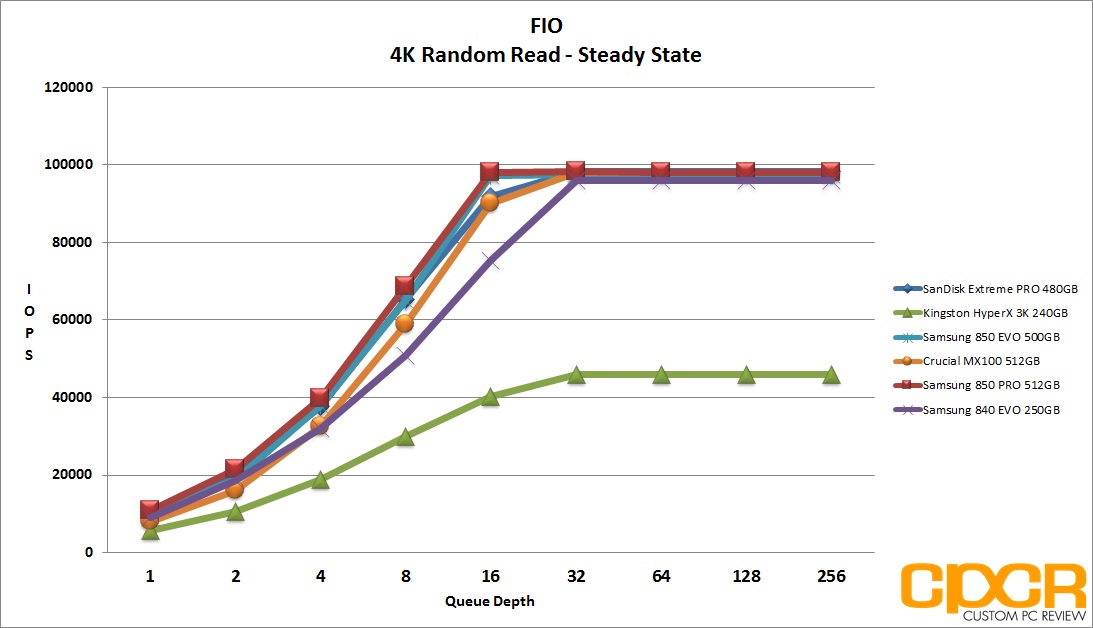
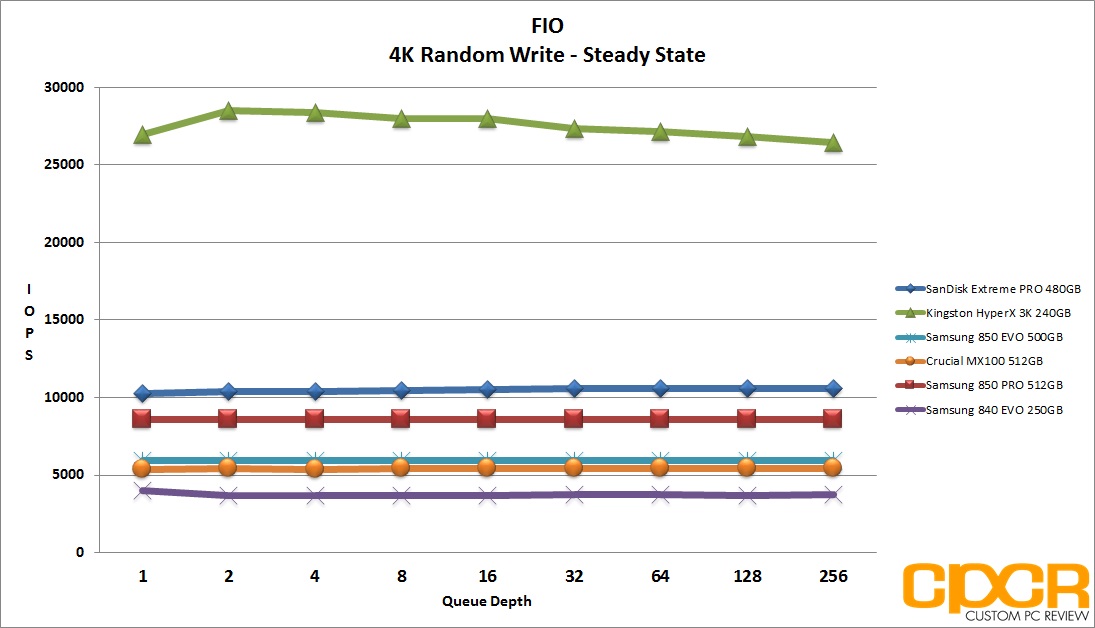
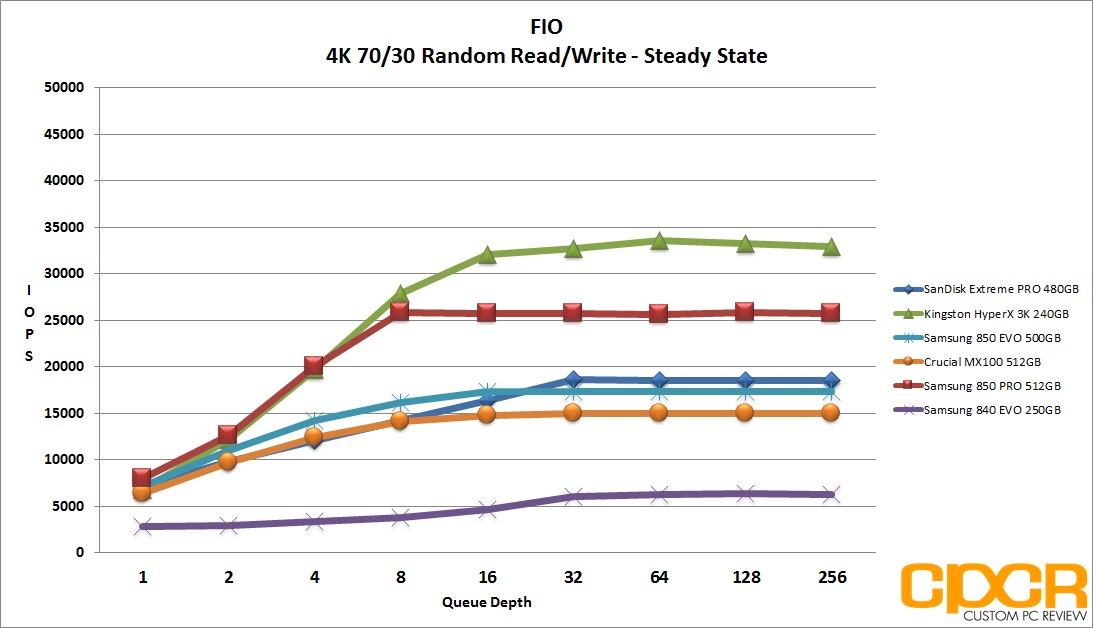
Performance Analysis
In steady state, Samsung 850 EVO performs quite well in 4K random reads, pushing a top speed of up to 98,000 IOPS. However, 4K random write and mixed workload performance weren’t anywhere near as spectacular with the drive struggled to break 6,000 IOPS 4K random write and 18,000 IOPS in a 70/30 mixed read/write workload.
[section label=”8. FIO – 4K Random Write Consistency”]
Samsung 850 EVO 500GB Performance
FIO 4K Random Write Consistency Testing
Another one of the benefits of testing with FIO is the flexibility of running consistency tests, which is one of the most important metrics when considering SSDs going forward. Looking at the results of our benchmarks such as ATTO Disk Benchmark and Crystal Disk Benchmark, we can see that practically every top tier SSD is capable of saturating SATA 6Gb/s in the FOB state. However, what really differentiates these SSDs is their ability to hold a certain level of performance even after extended periods of use.
For our consistency testing, we used a fairly standard method, which includes both filling up 75% of capacity as well as 100% capacity twice with sequential 128k data followed by the actual test itself, which is simply running 4K random writes at a queue depth of 32. By recording the IOPS every second for 2,000 seconds, we’re able to get a good look at what kind of performance can be expected when the drive is relatively new, when it’s heading towards steady state, and when it’s actually in steady state.
[tabgroup]
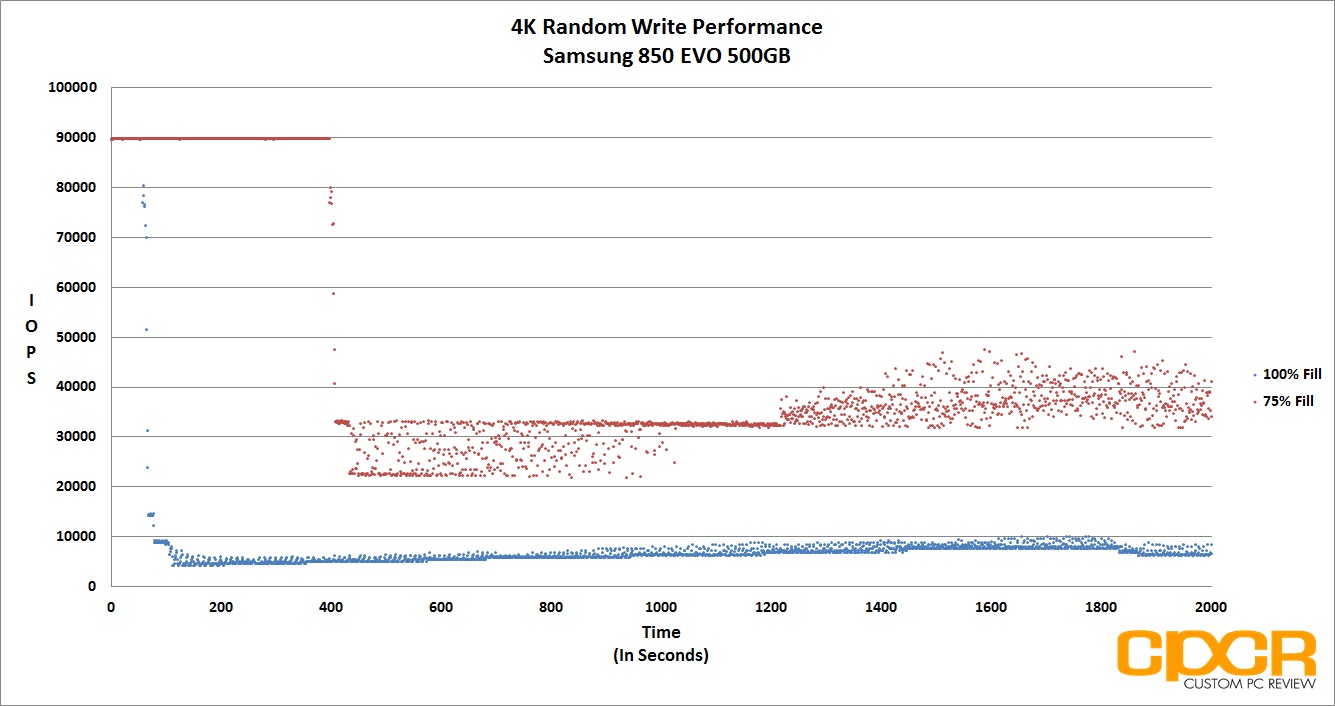
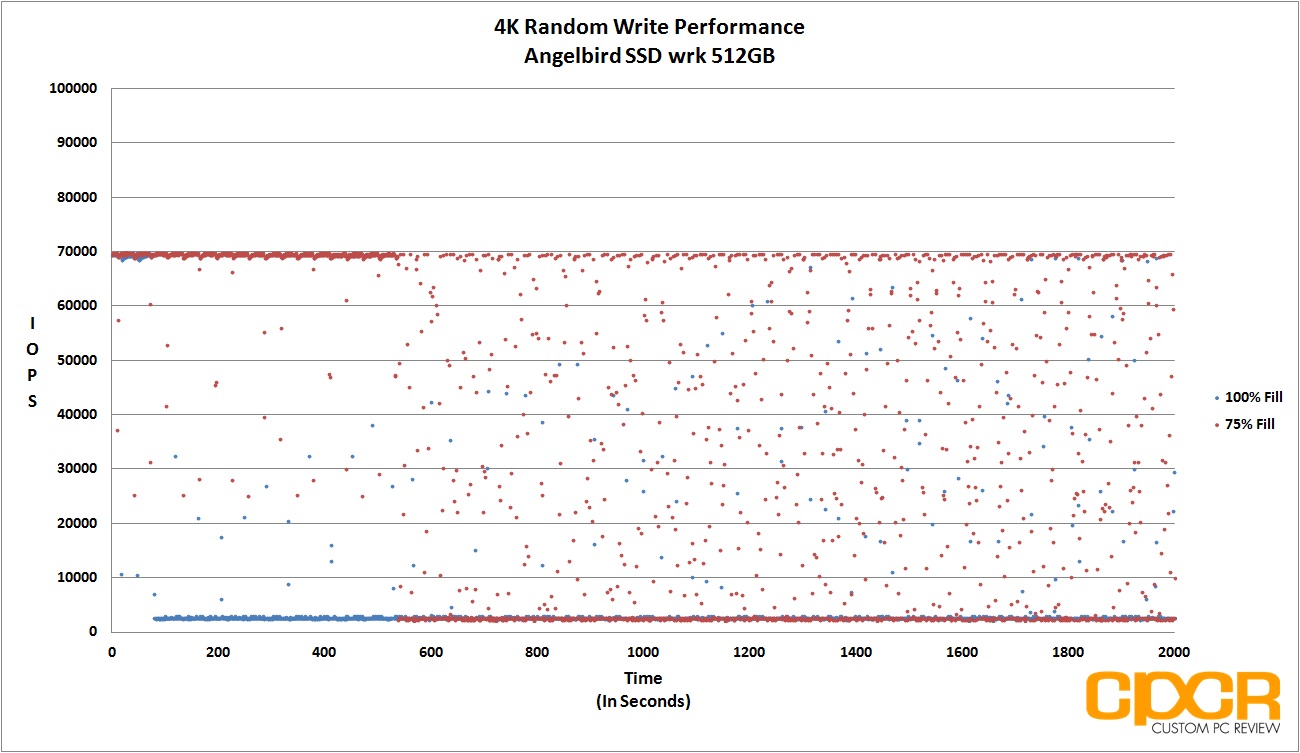
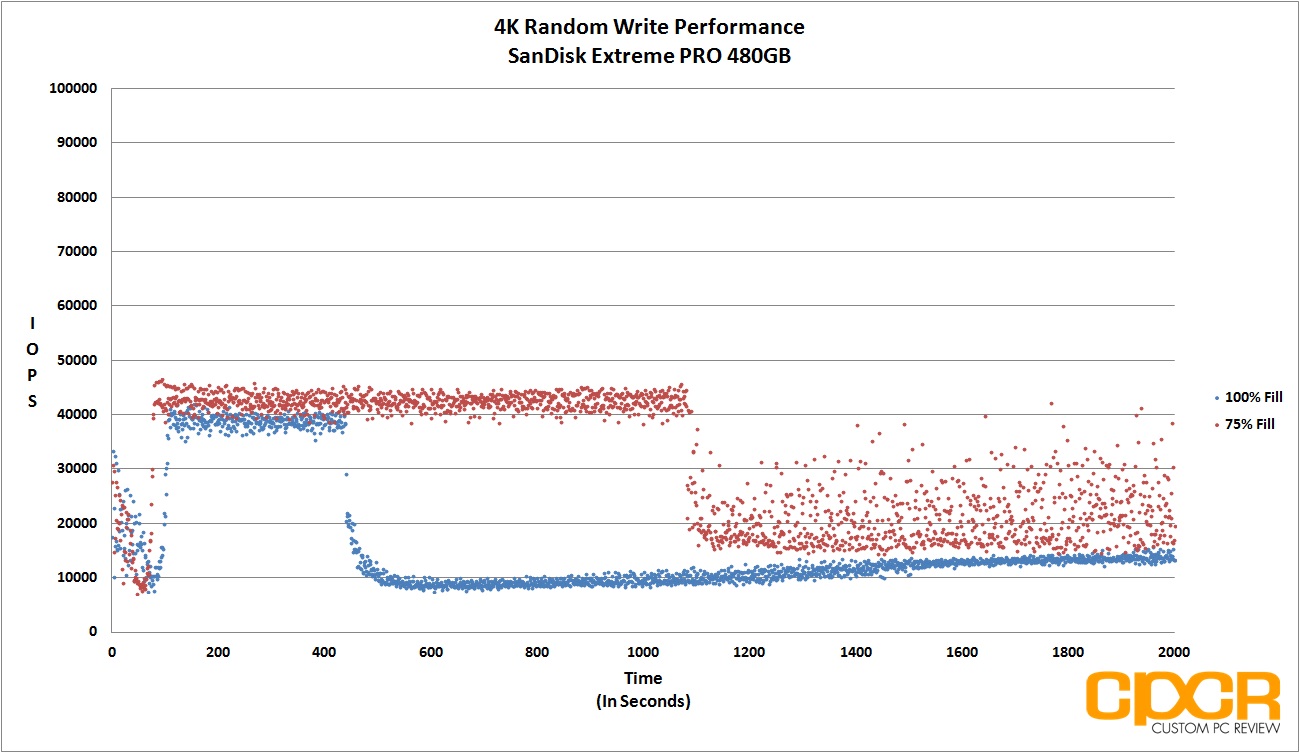
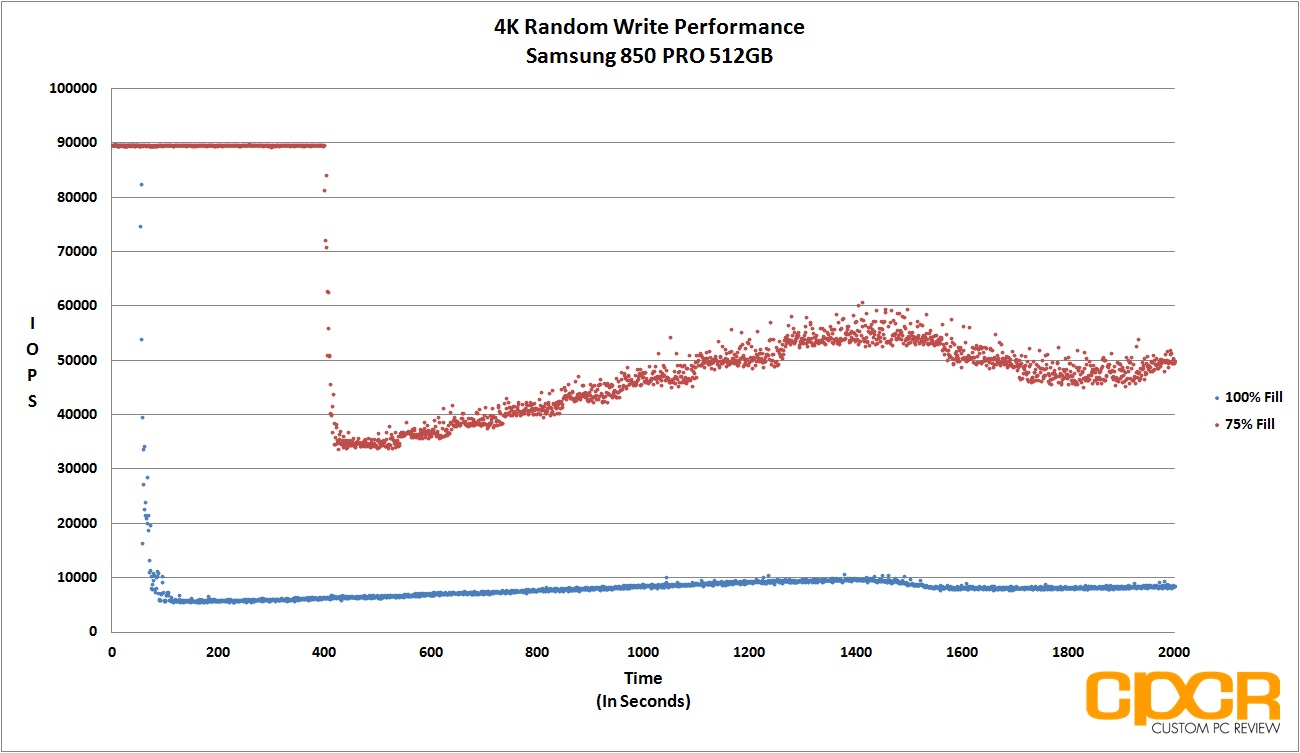
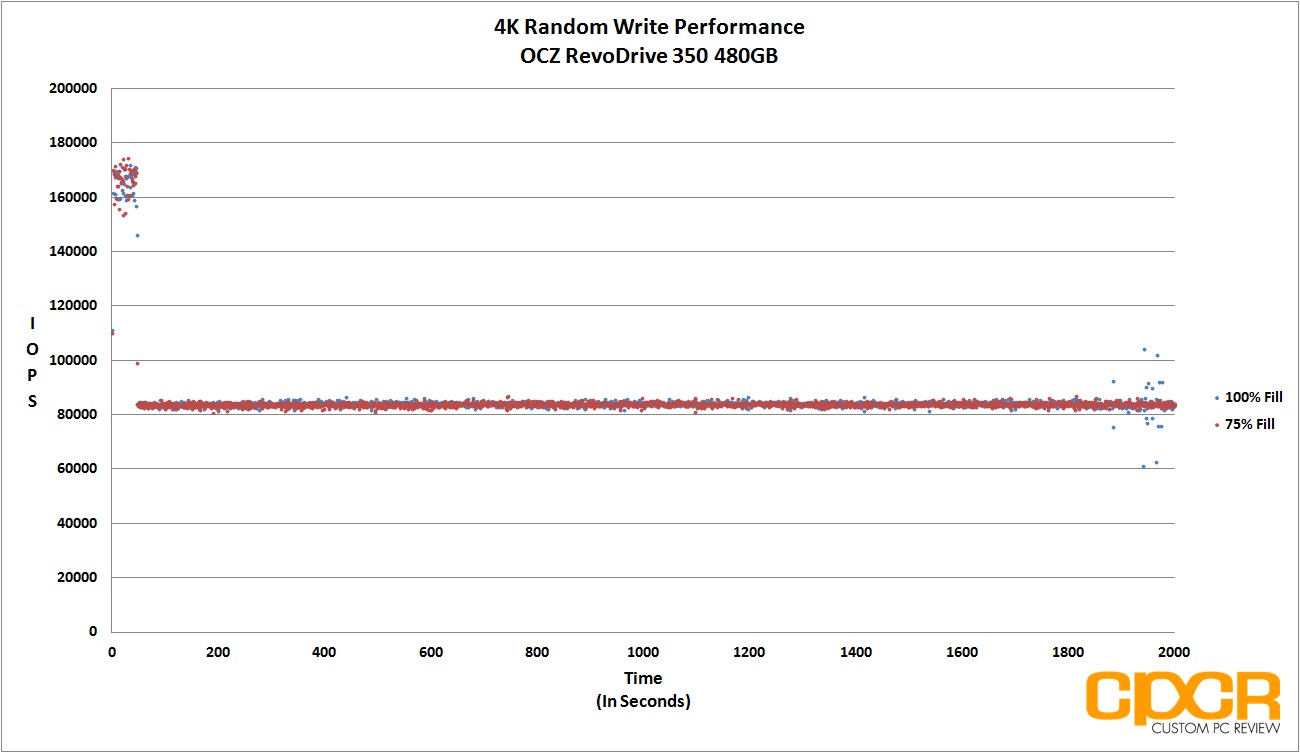
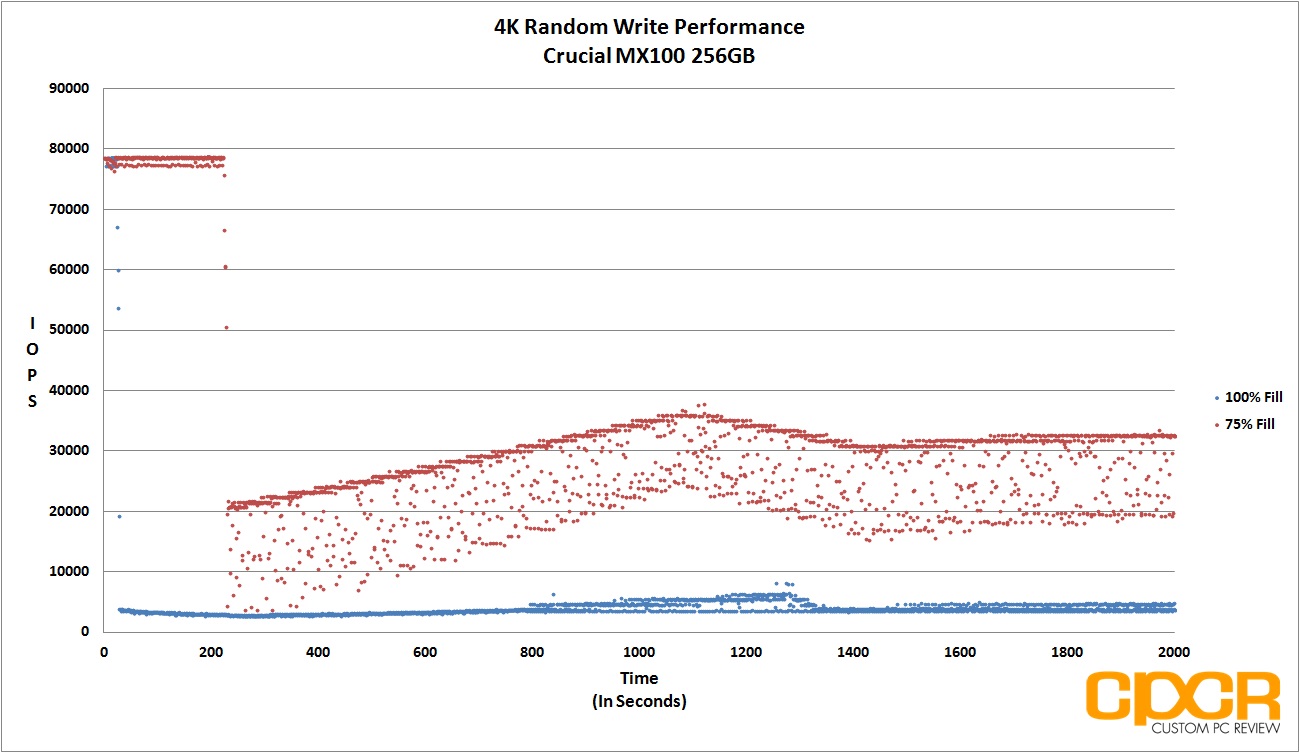
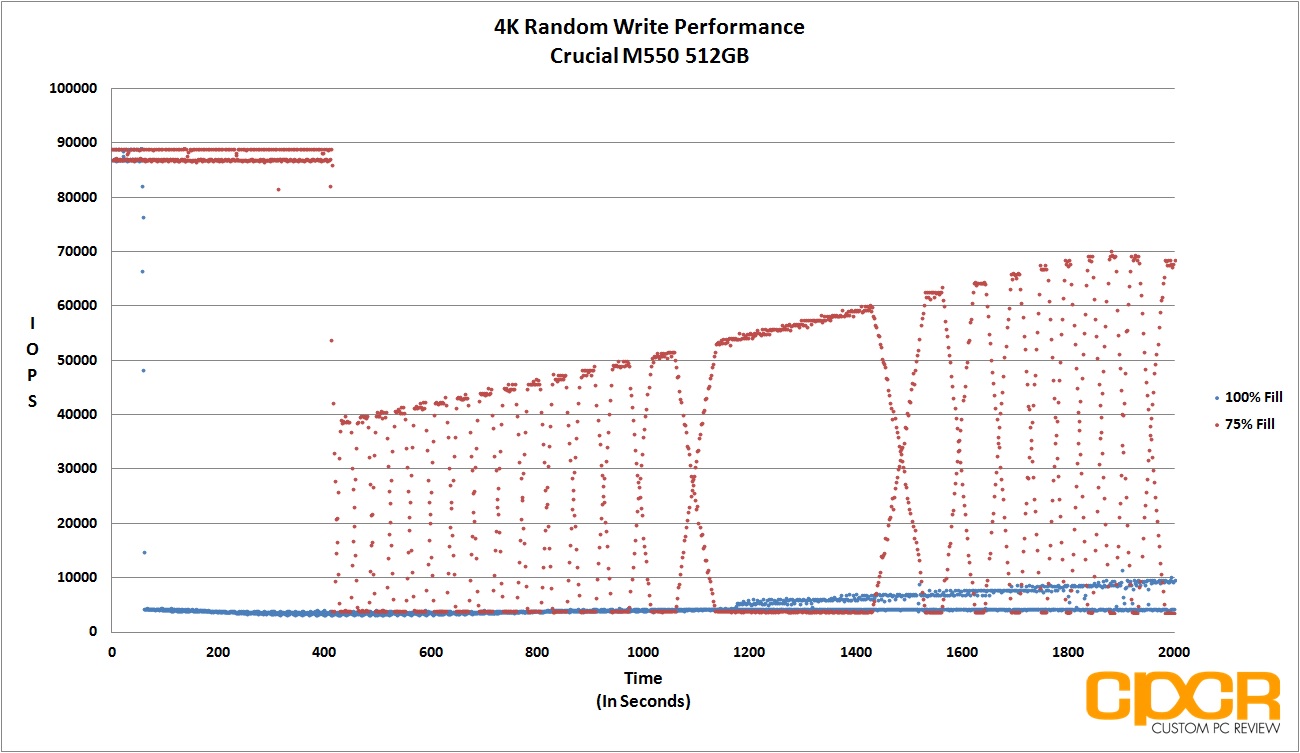
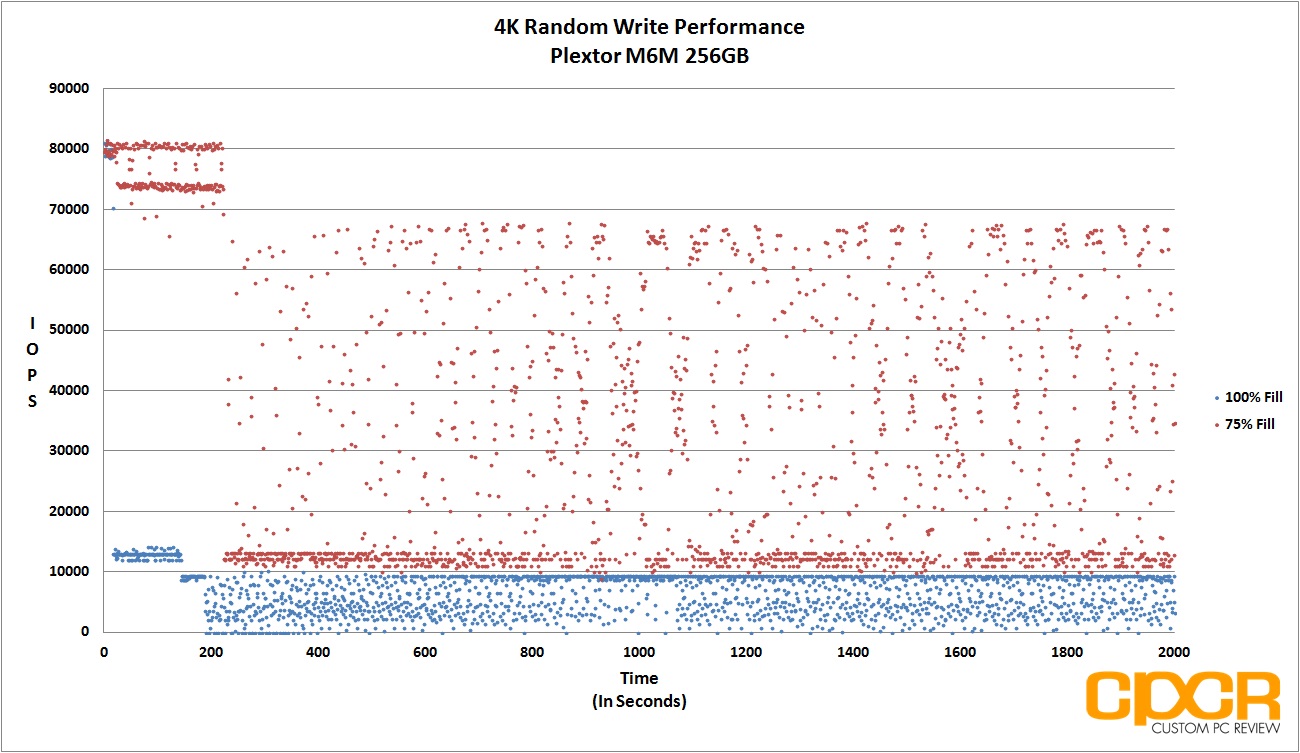
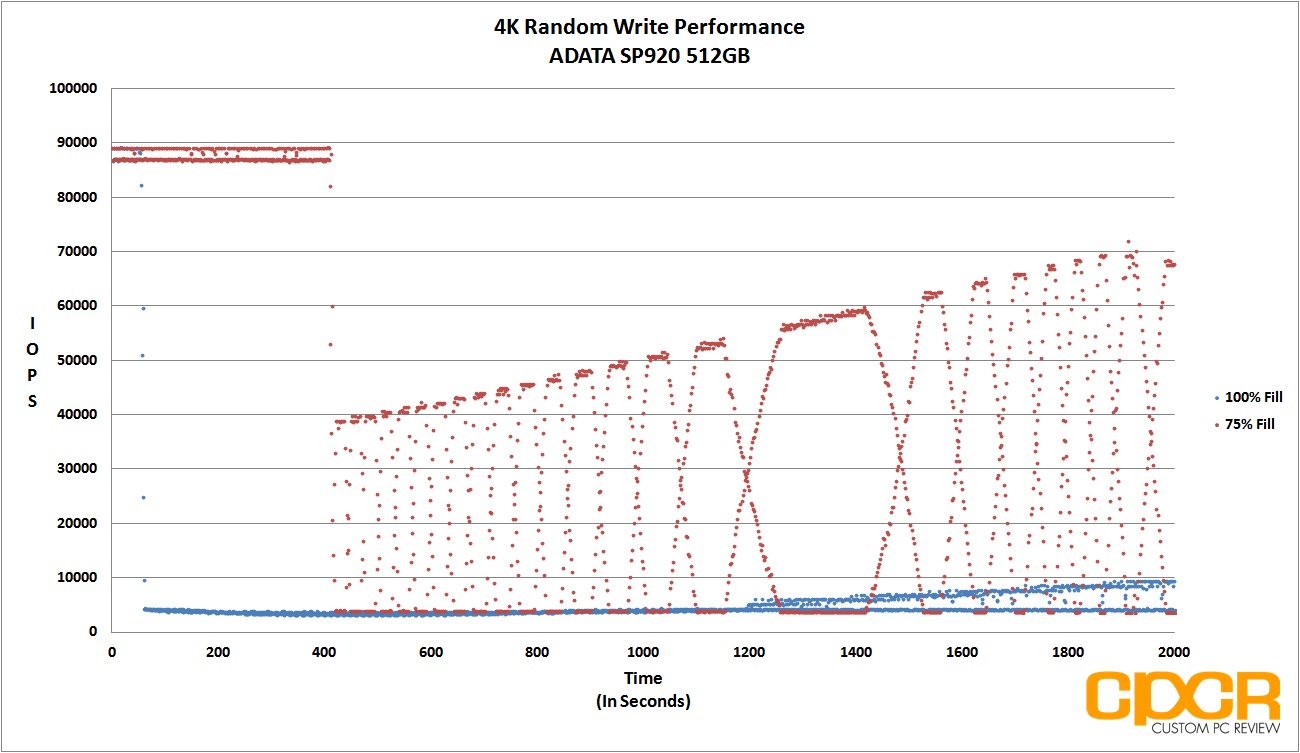
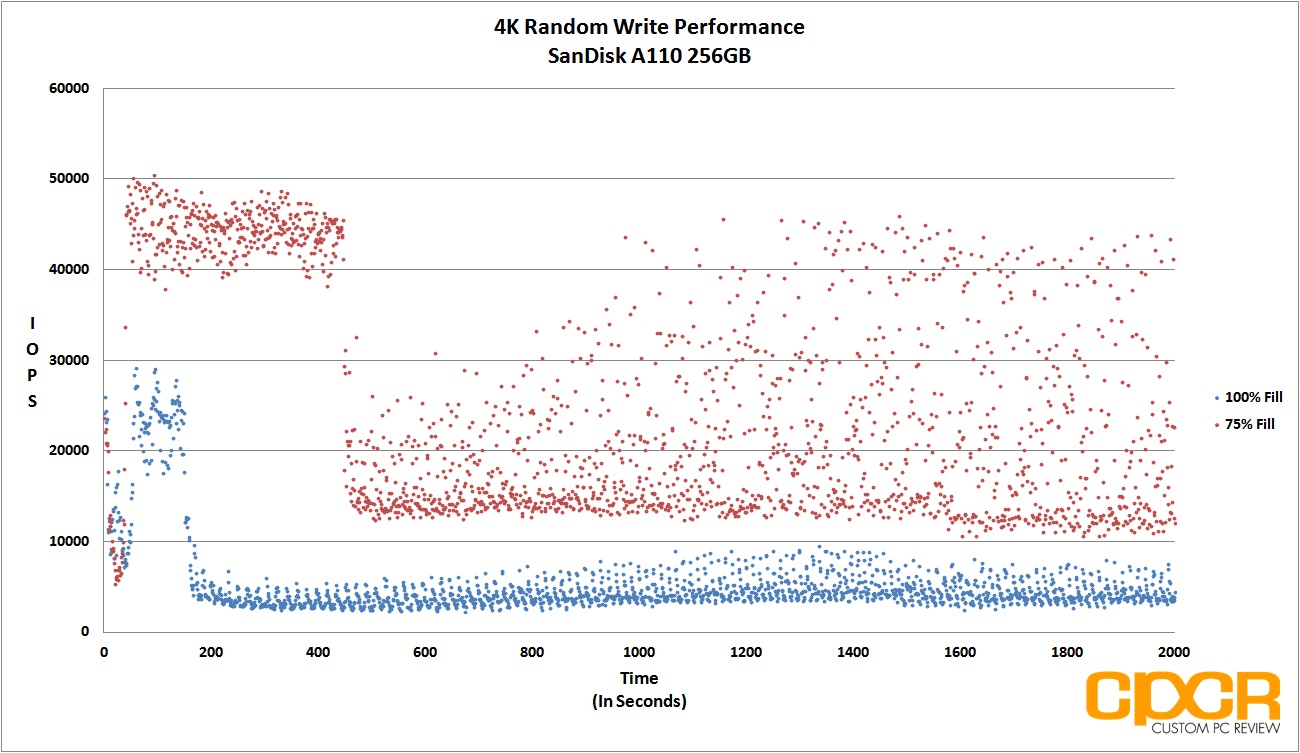
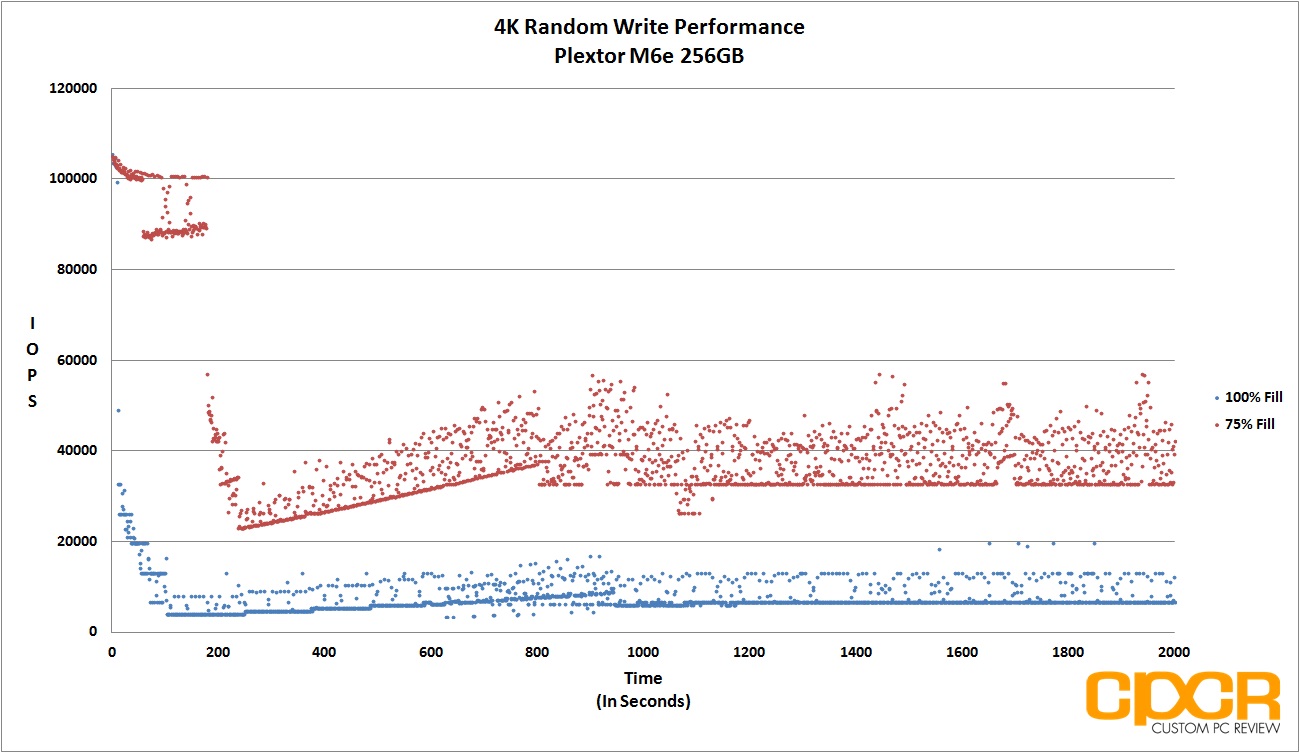
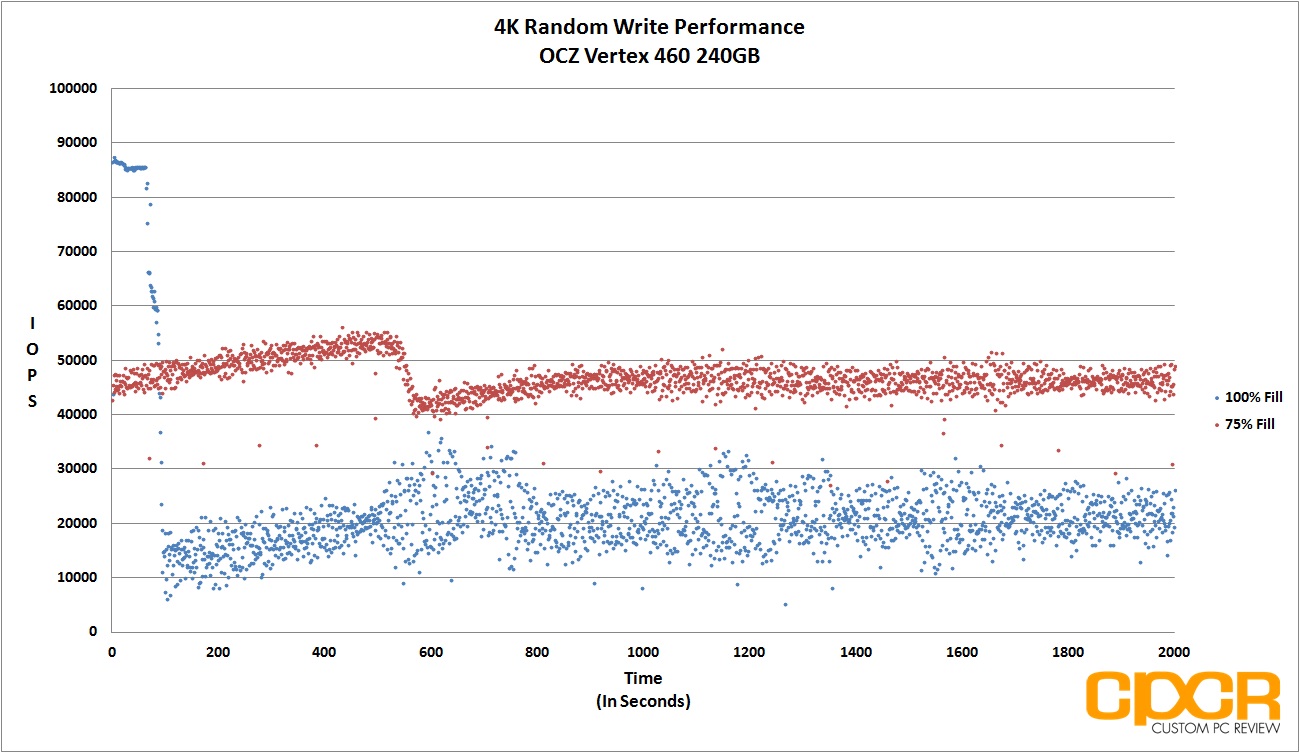
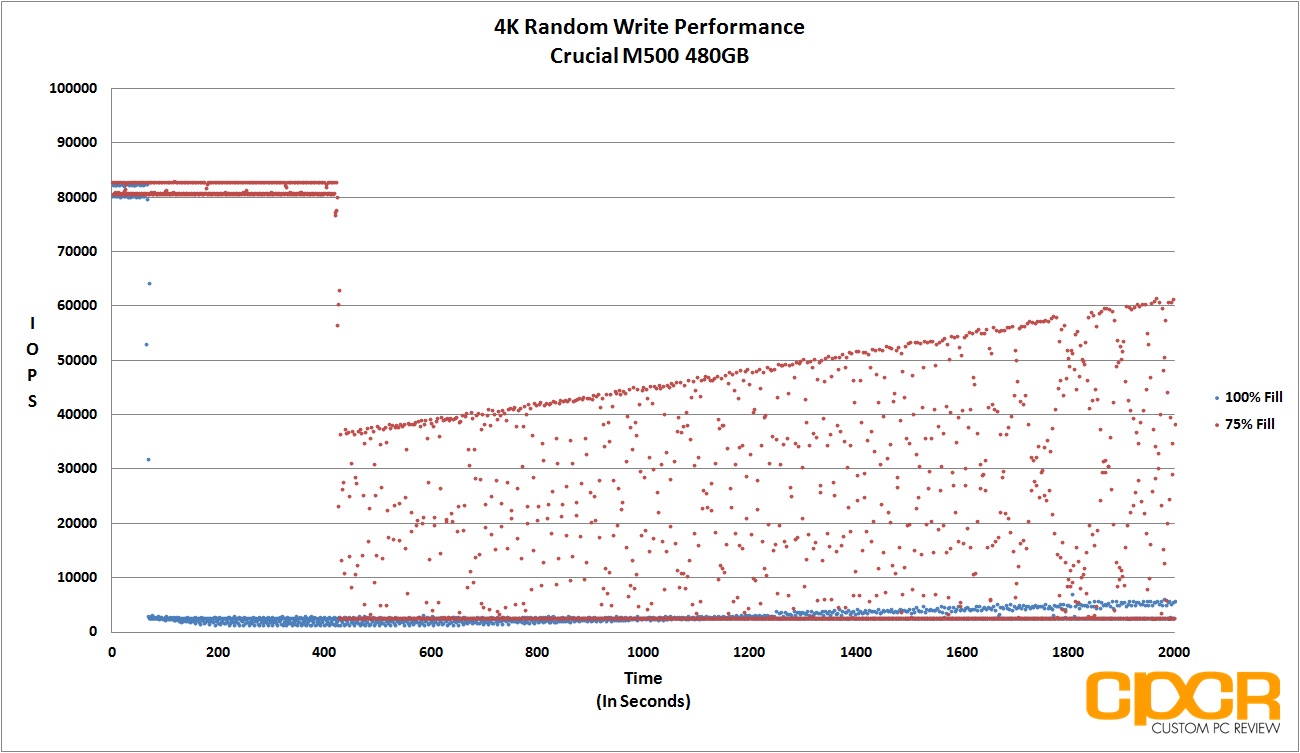
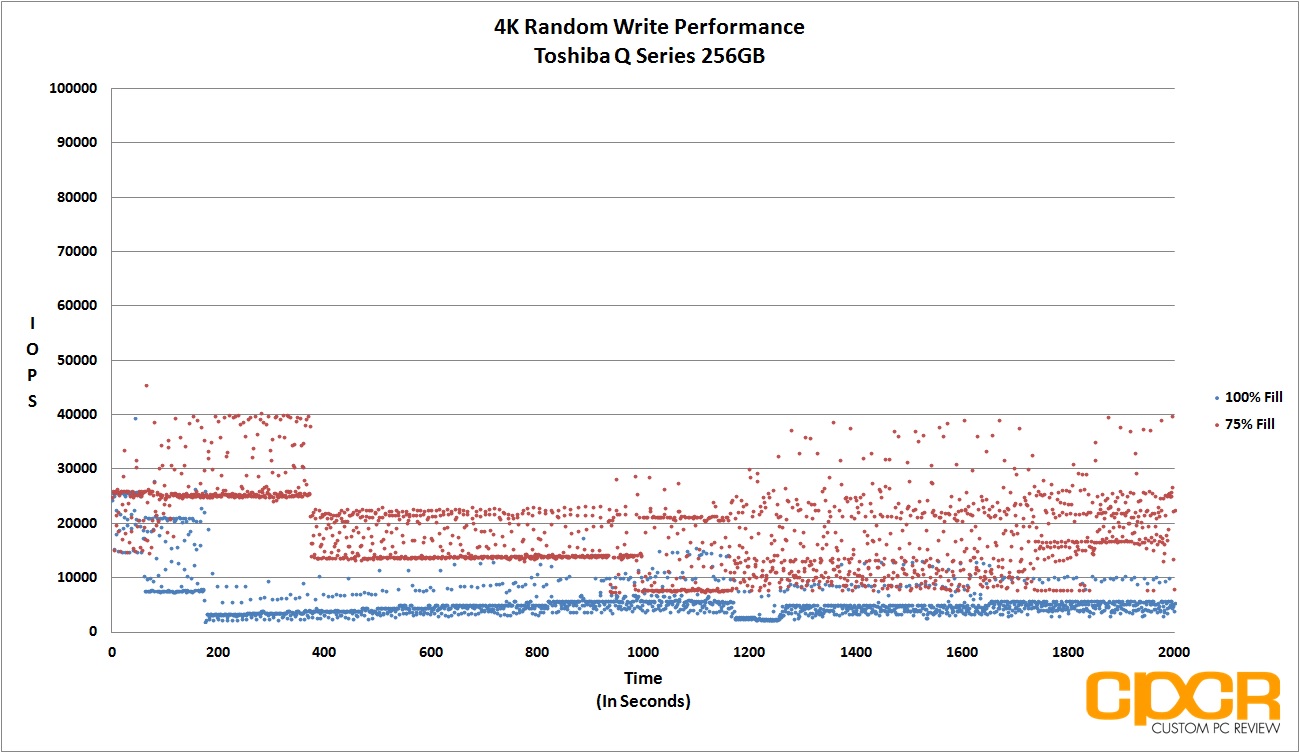
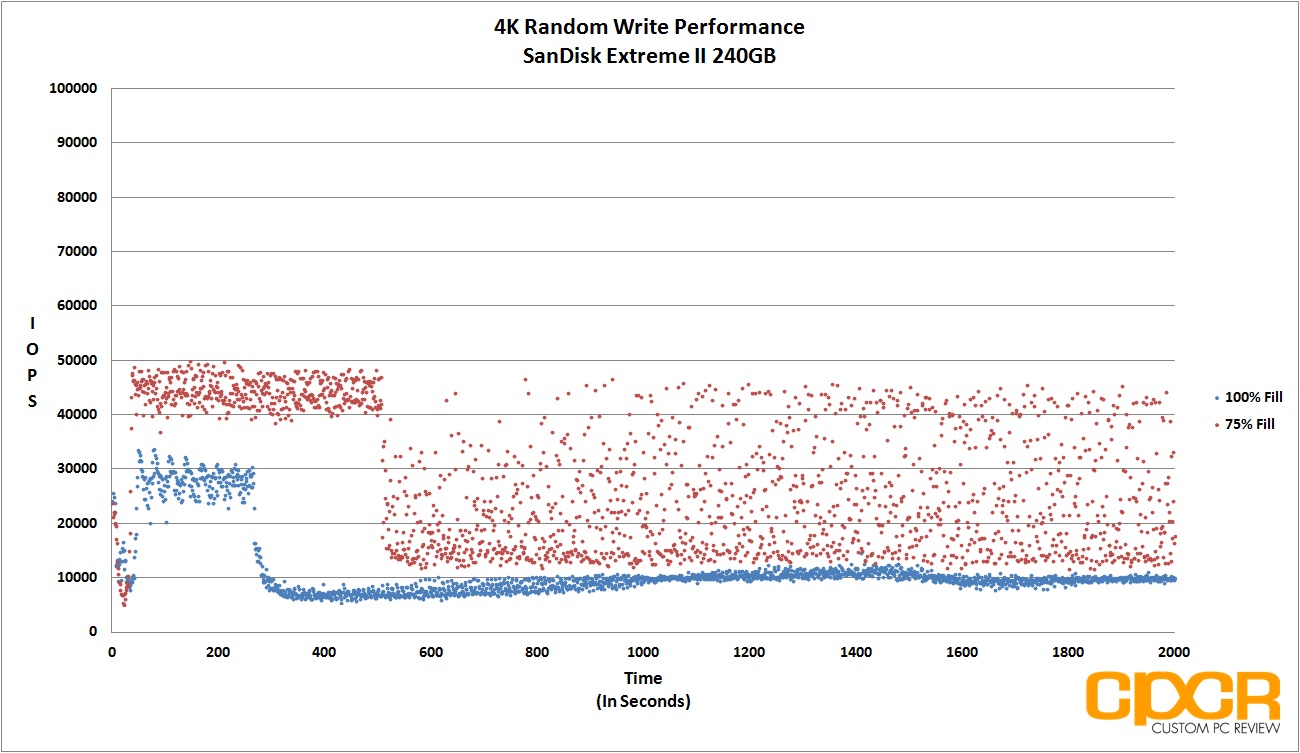
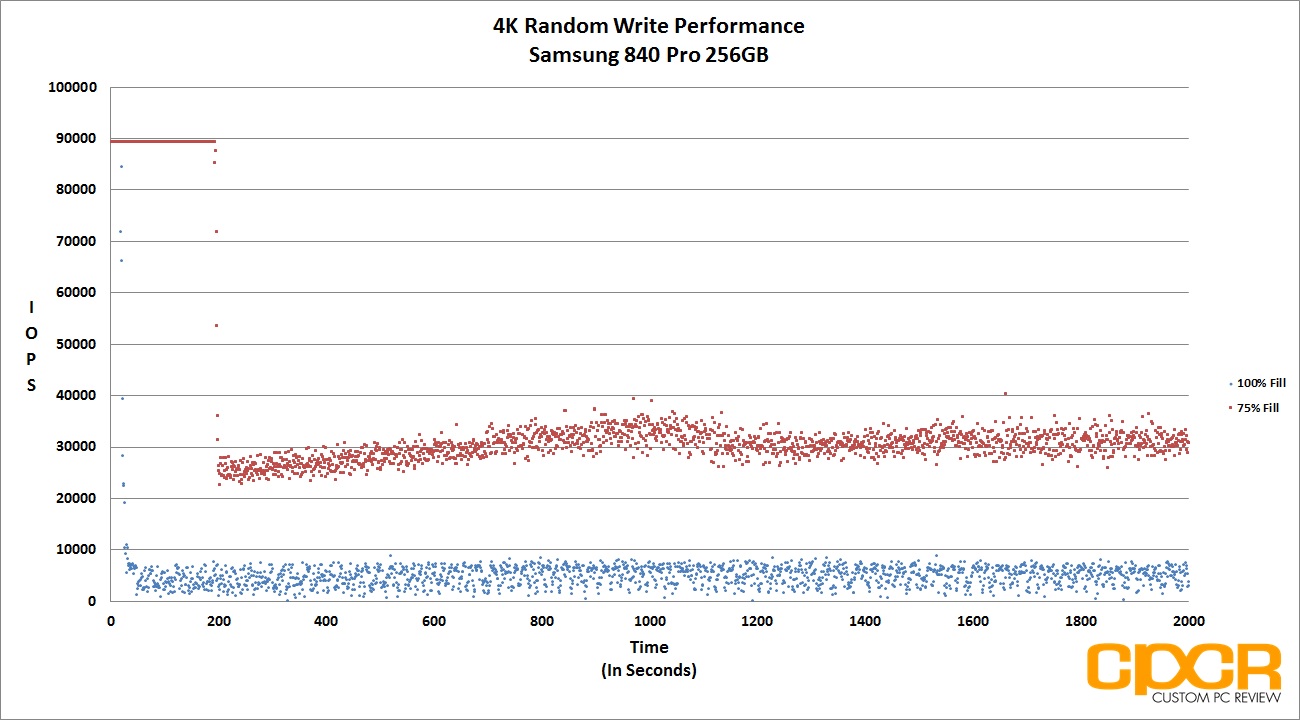
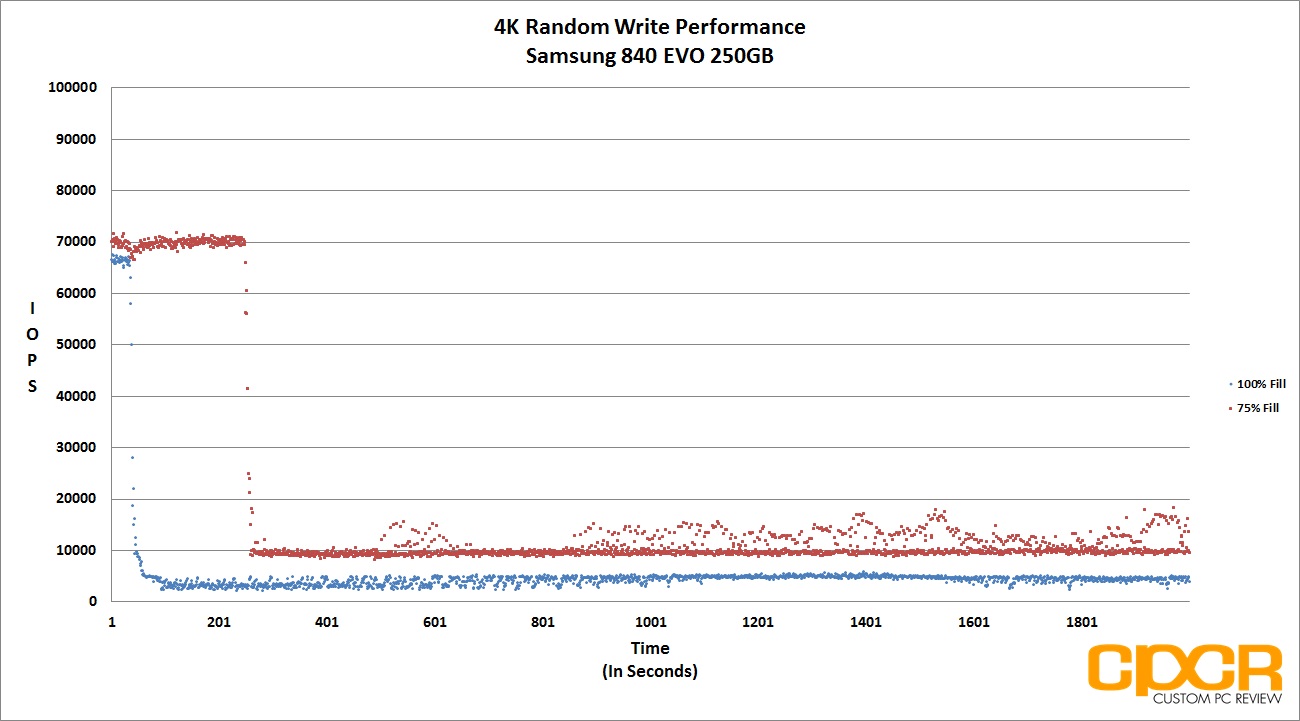
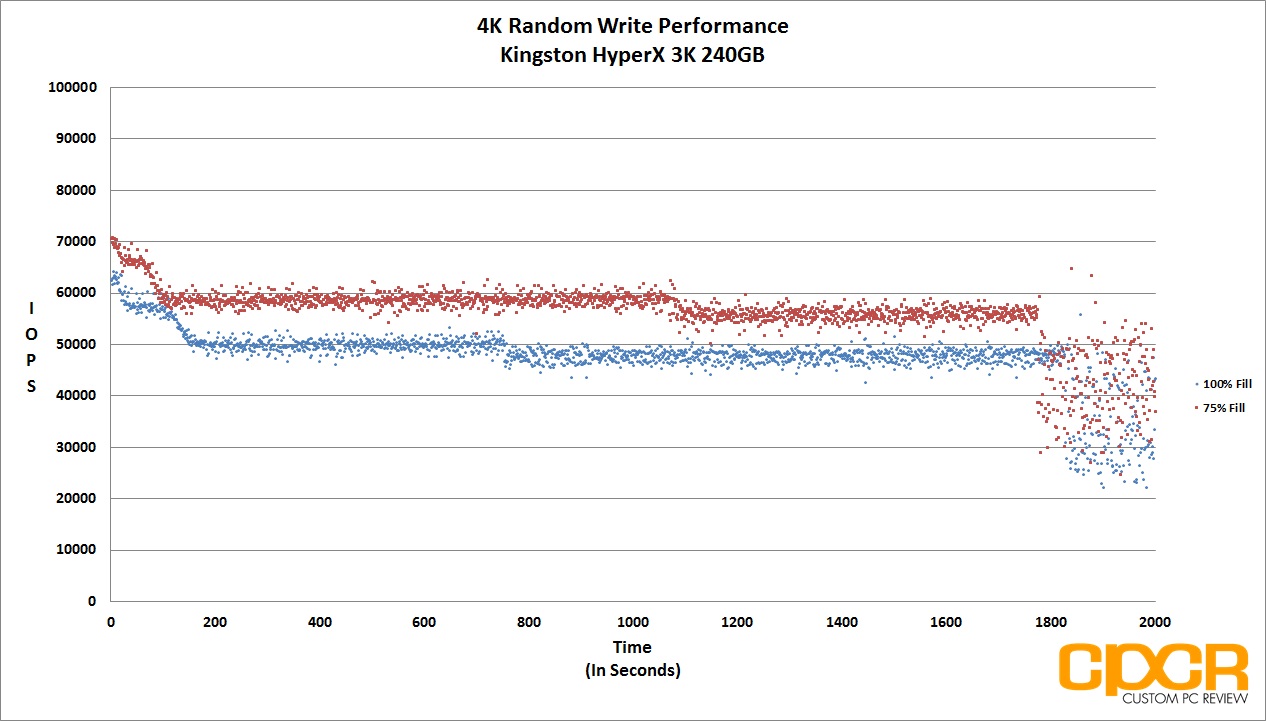
Performance Analysis
While the Samsung 840 EVO was actually slightly more consistent at 75% fill, the Samsung 850EVO’s performance is significantly better with the drive averaging ~35,000 IOPS versus the Samsung 840 EVO’s ~10,000 IOPS. At 100% fill, the Samsung 850 EVO is more consistent, but only shows a slight performance improvement over the Samsung 840 EVO.
[section label=”9. FIO – 4K Random Write Latency”]
Samsung 850 EVO 500GB Performance
FIO 4K Random Write Latency Testing
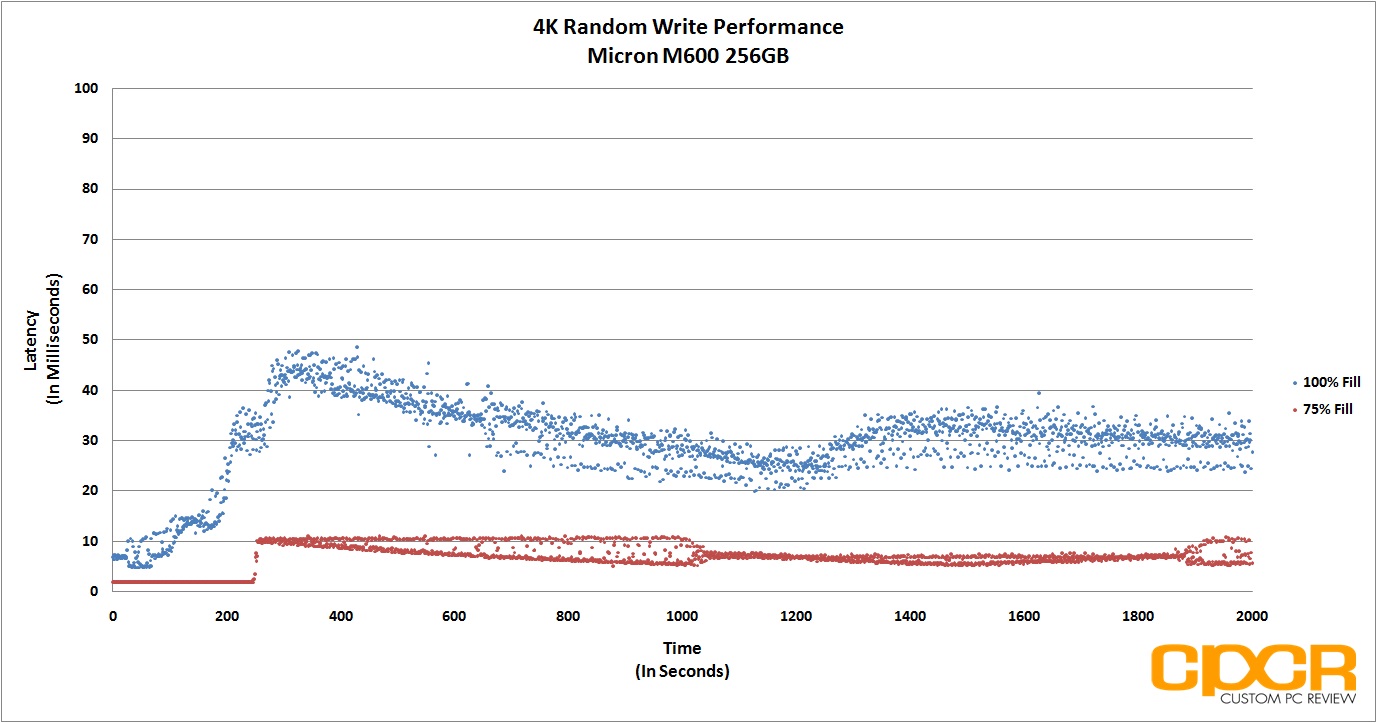
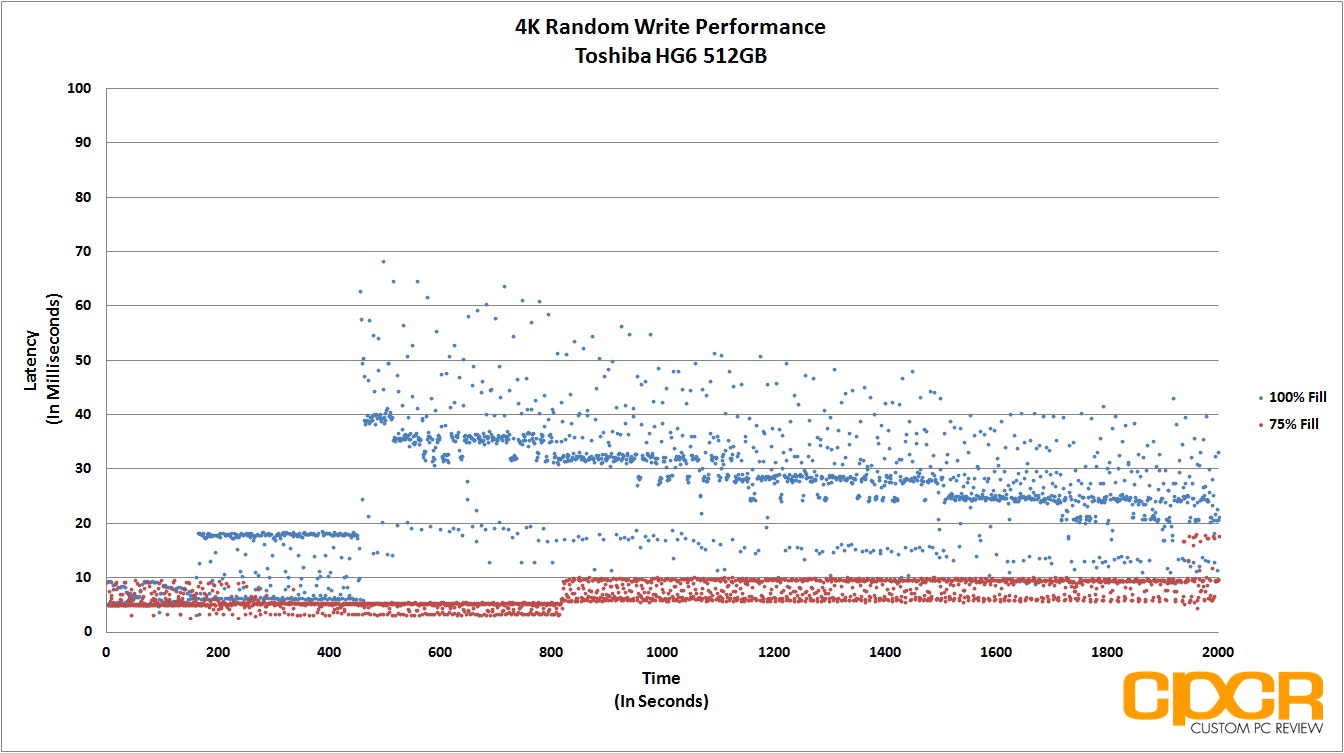
Another metric that’s becoming increasingly important in SSDs is its ability to keep latency low despite being subjected to a heavy workload. Even if a SSD were capable of ultra high and ultra consistent IOPS performance, if latency were high, users would still feel that the drive is slow. Ideally, SATA SSDs should always be capable of latencies under 50ms, even during heavy workloads.
For latency testing, we’ll be using the exact same testing parameters as IOPS consistency testing, except instead of recording IOPS every second, we’ll be recording latency.
[tabgroup]
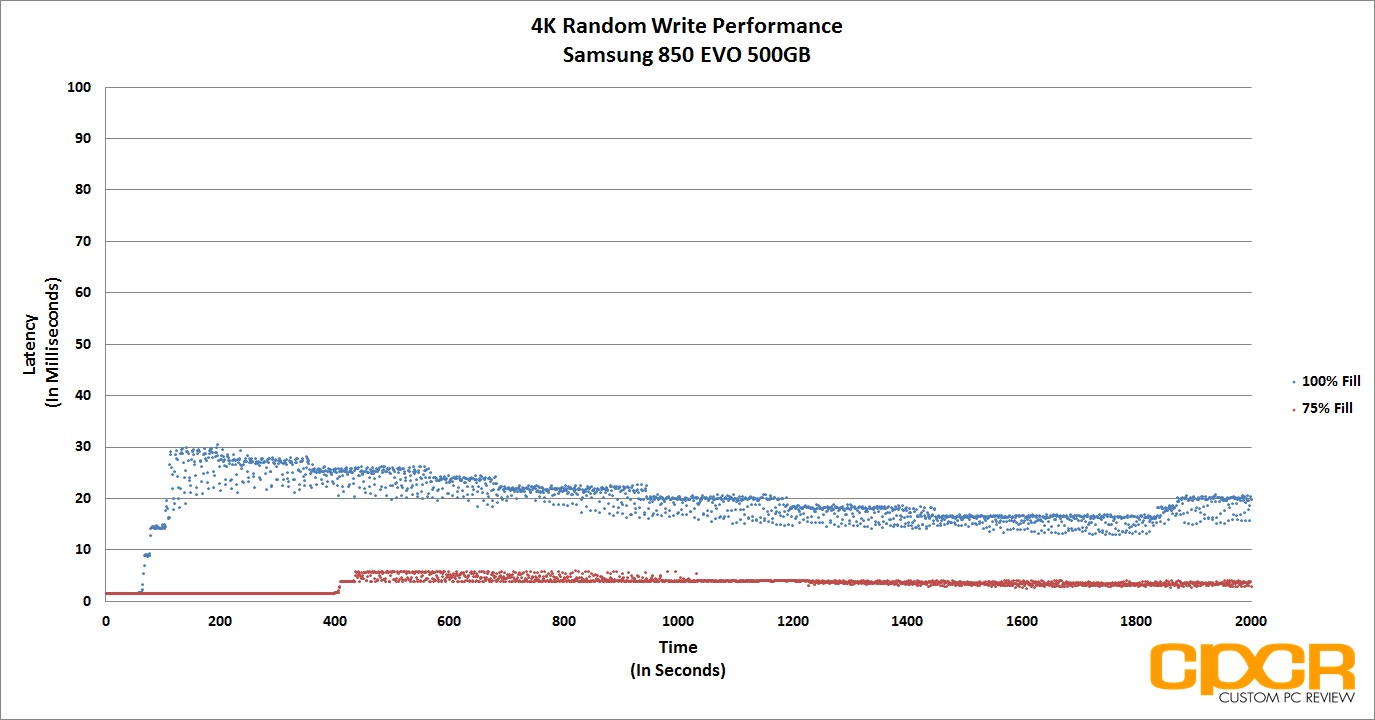
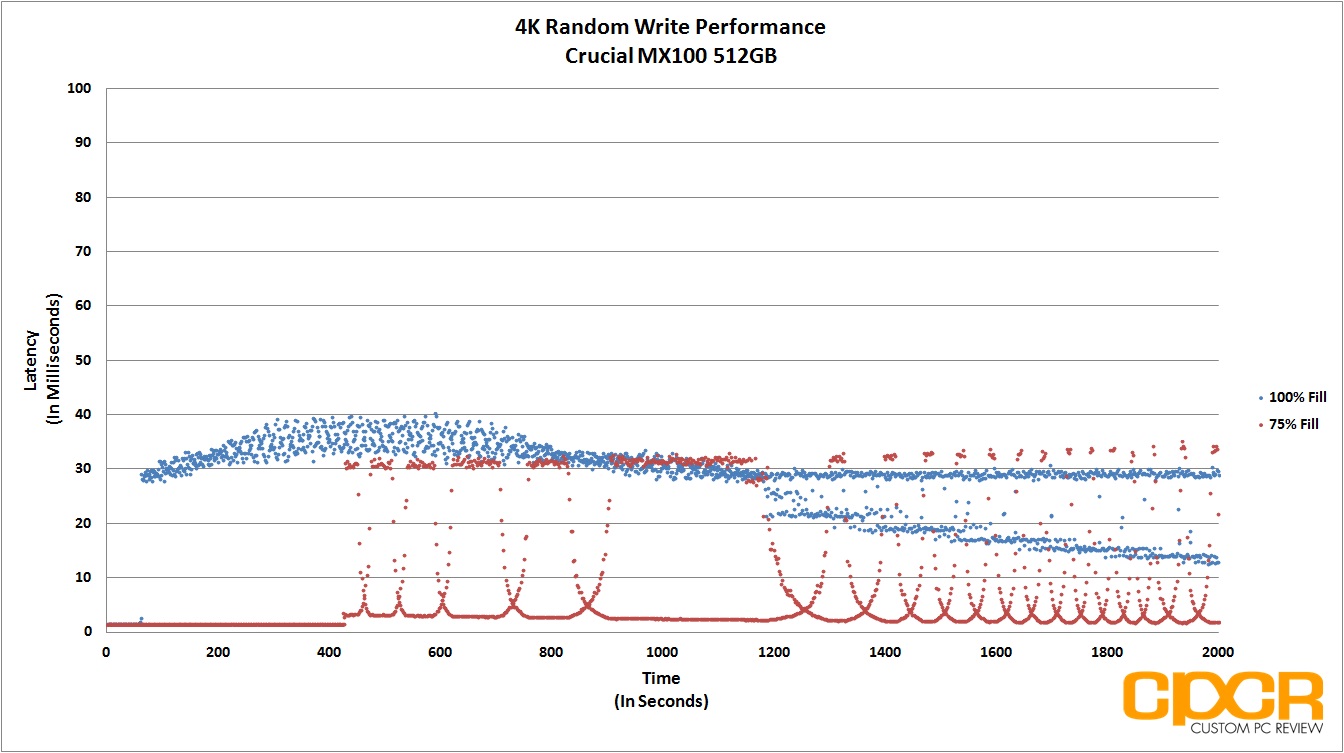
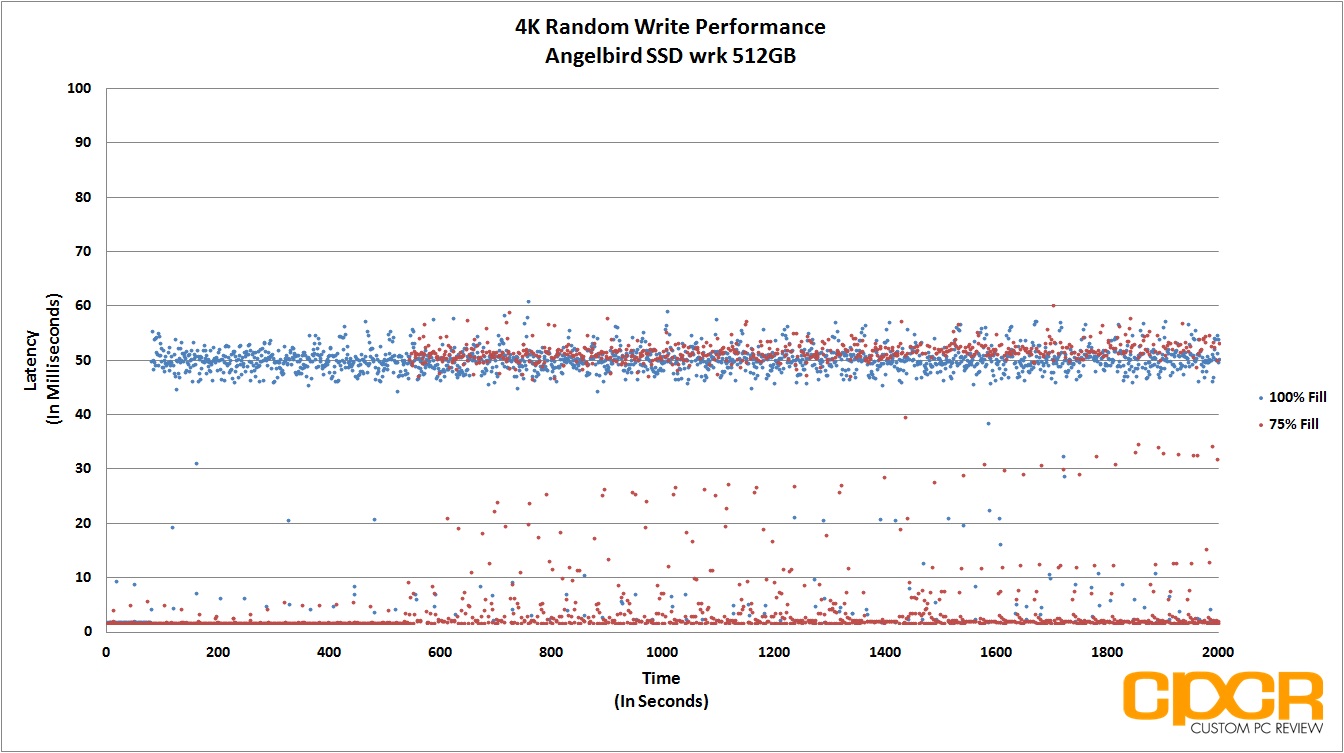
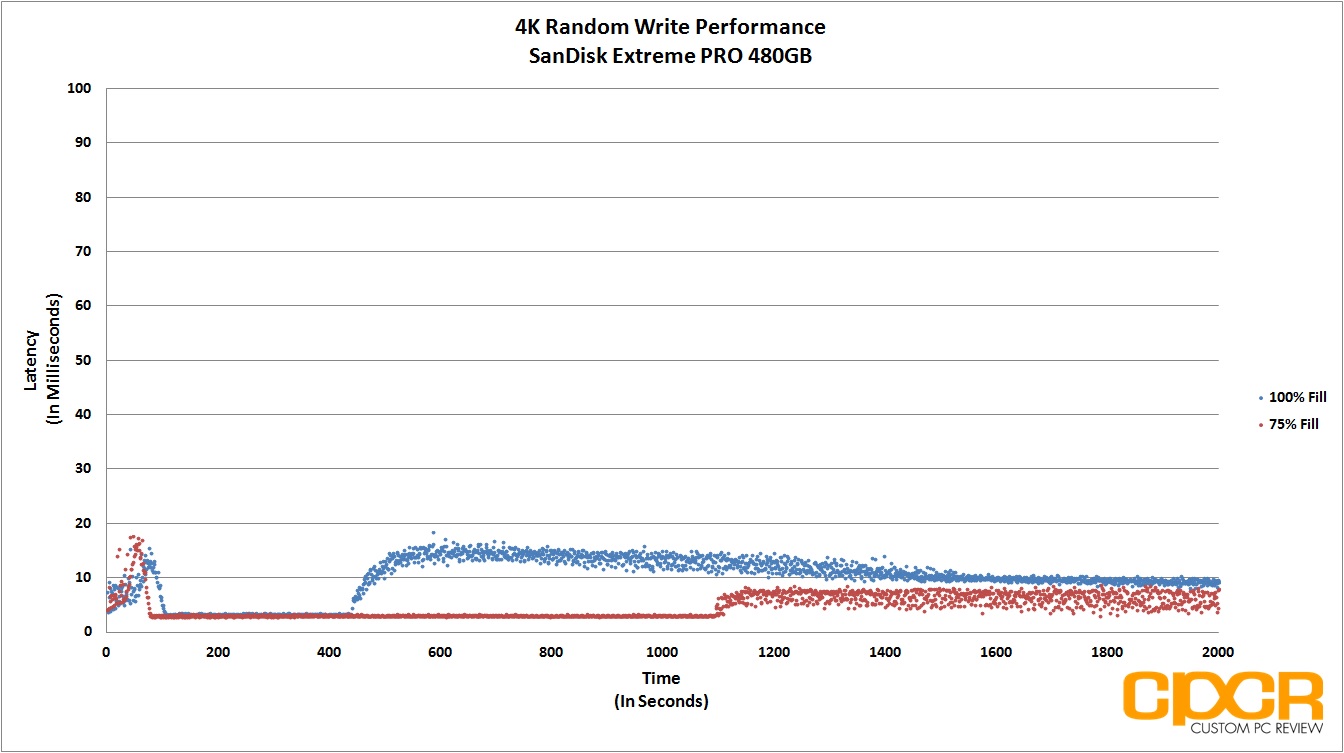
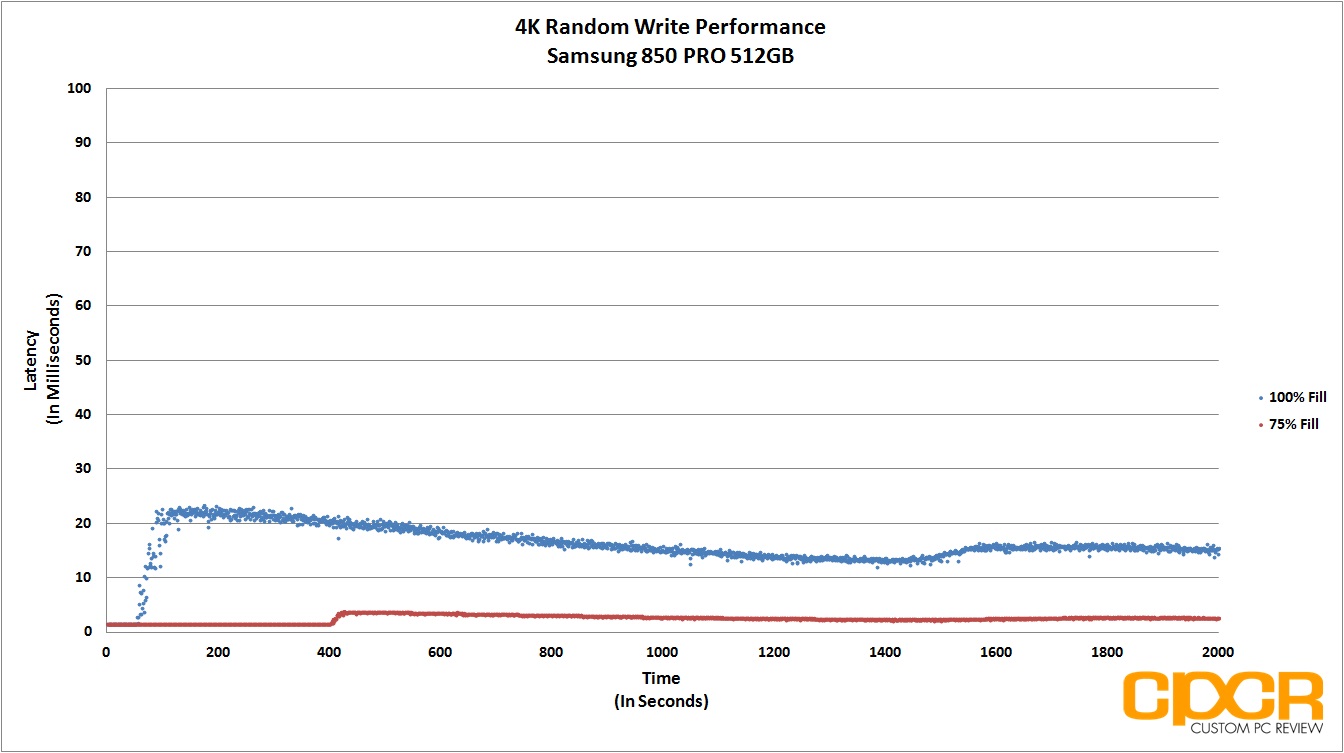
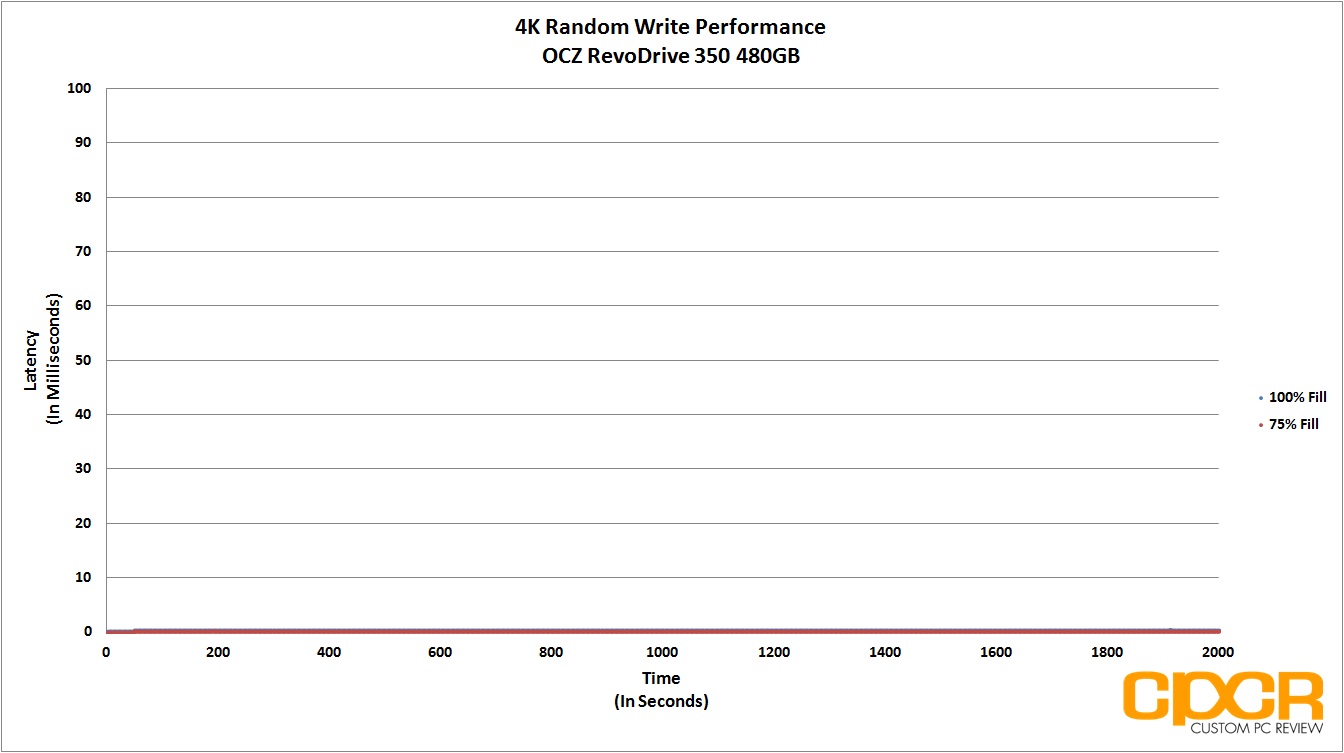
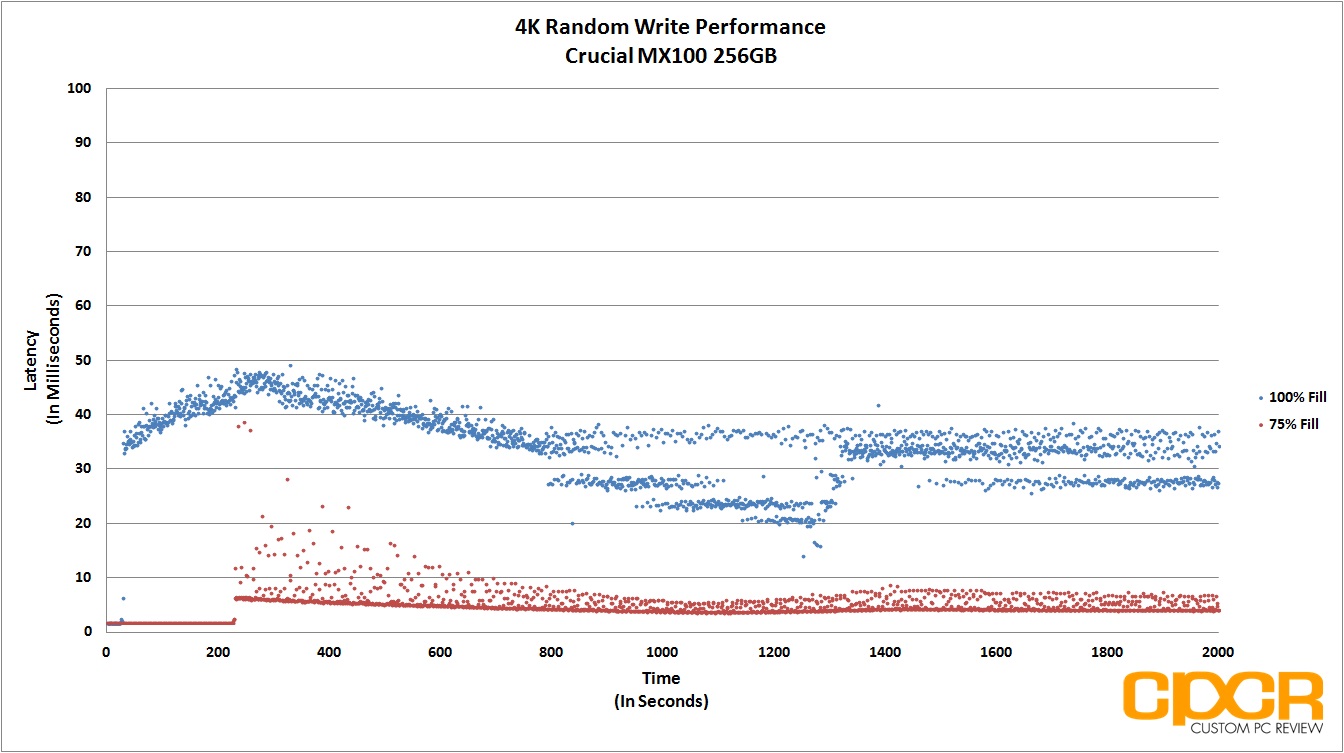
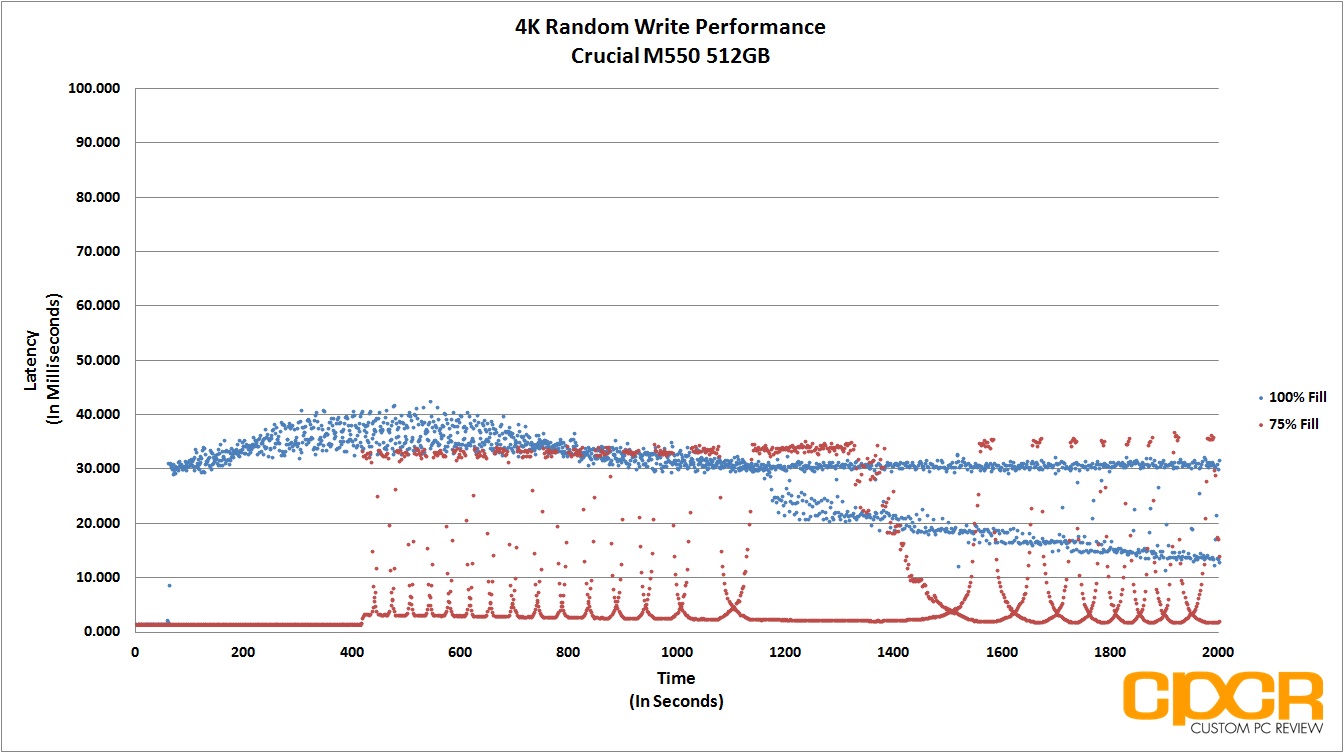
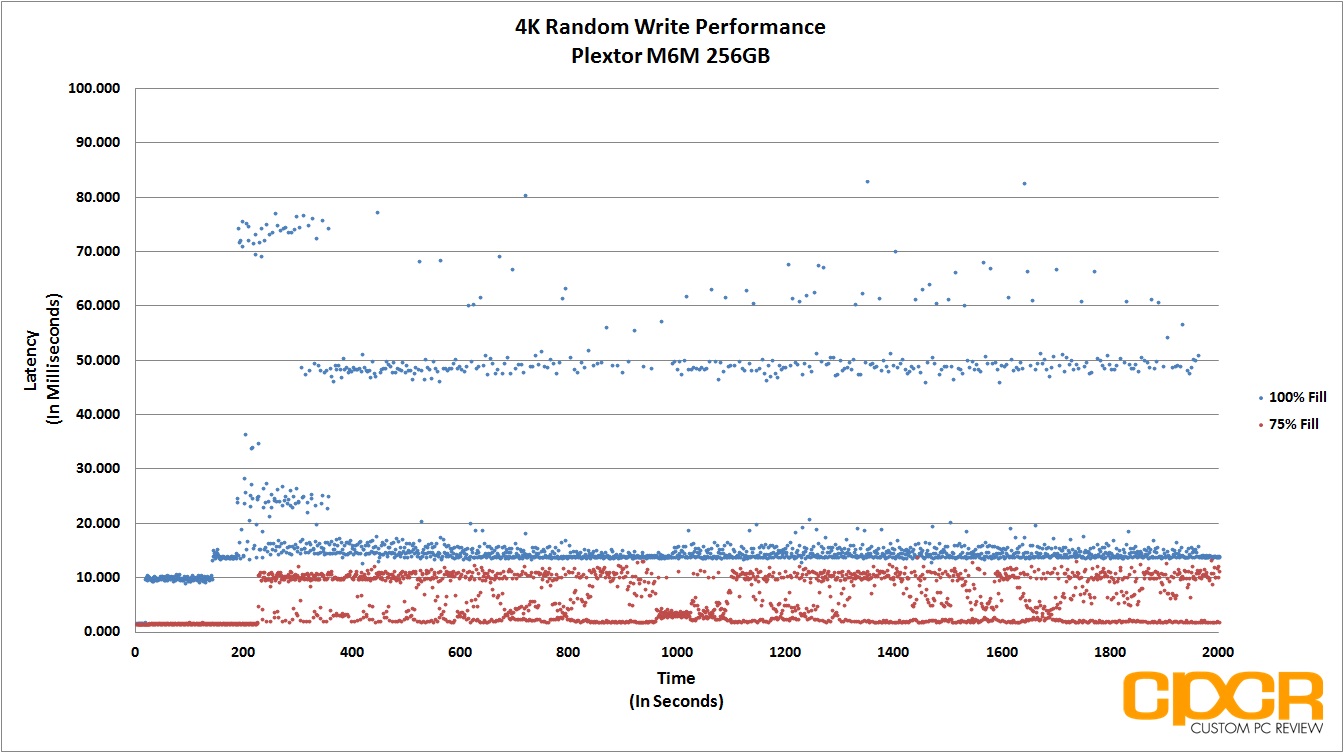
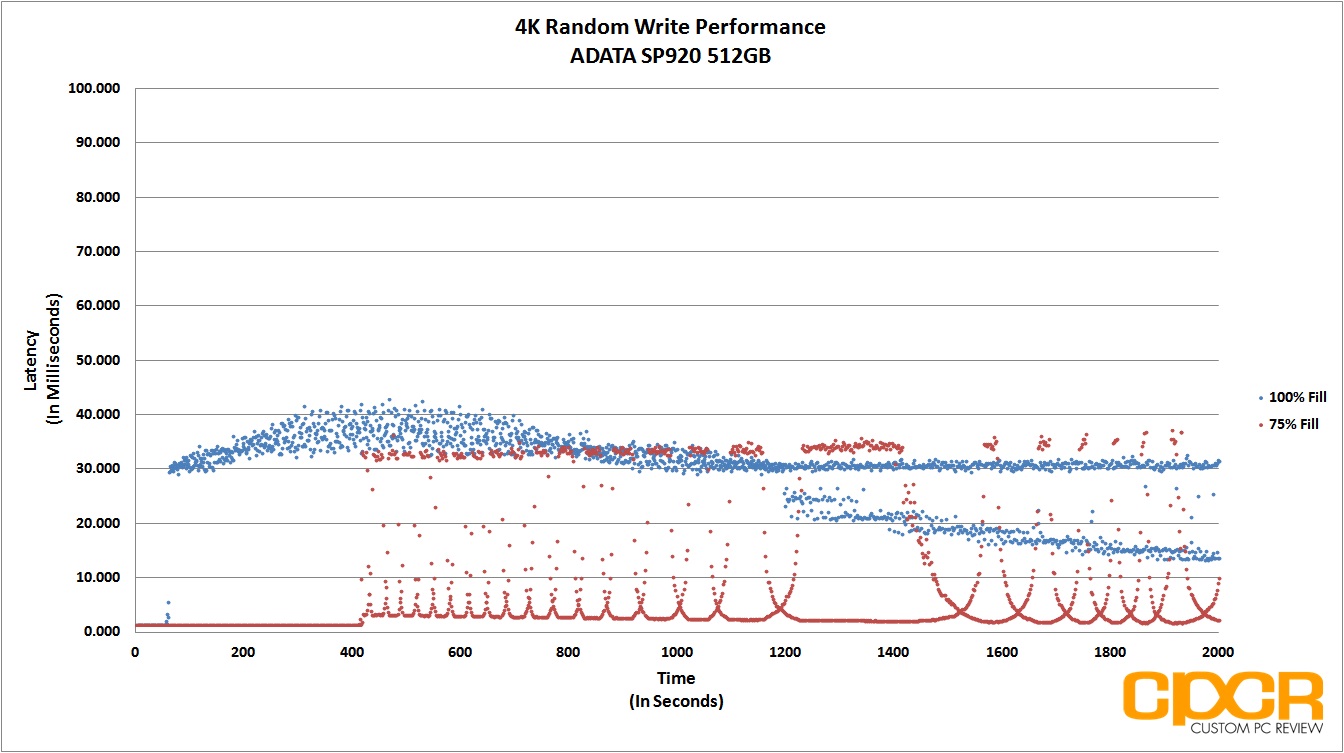
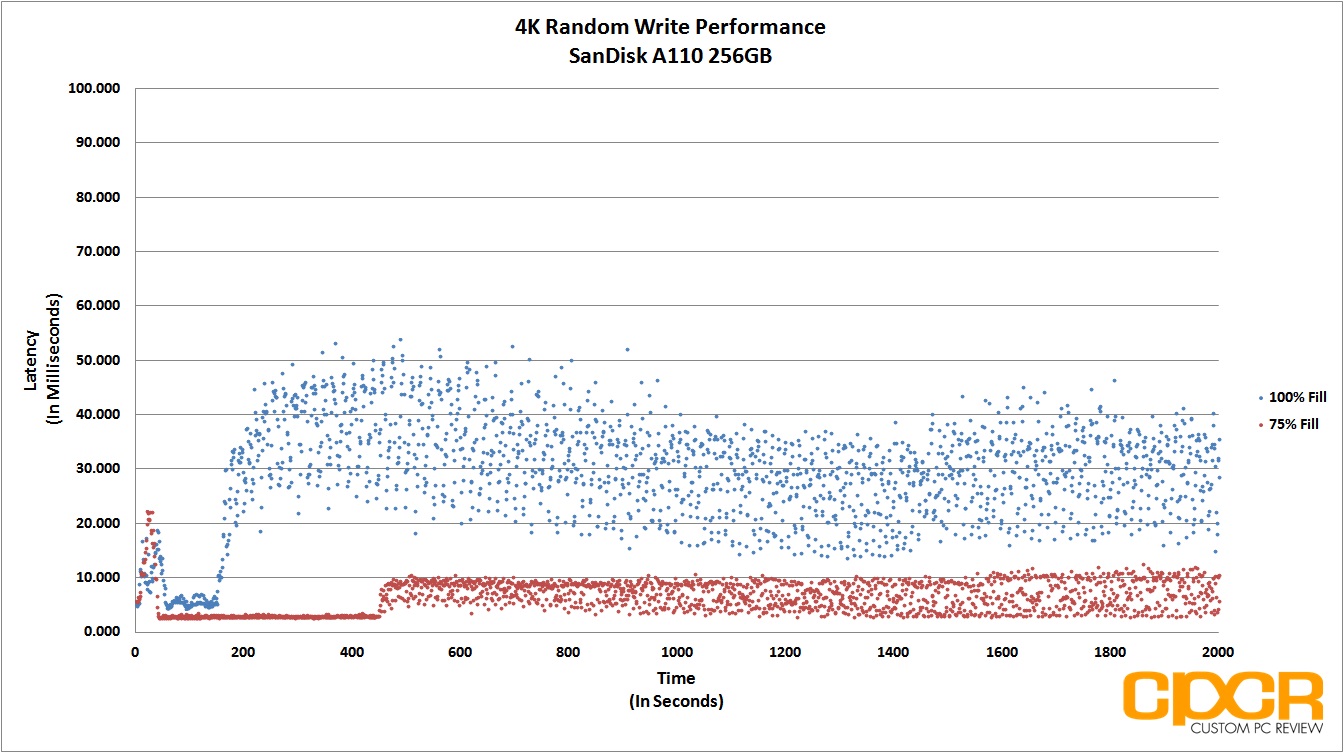
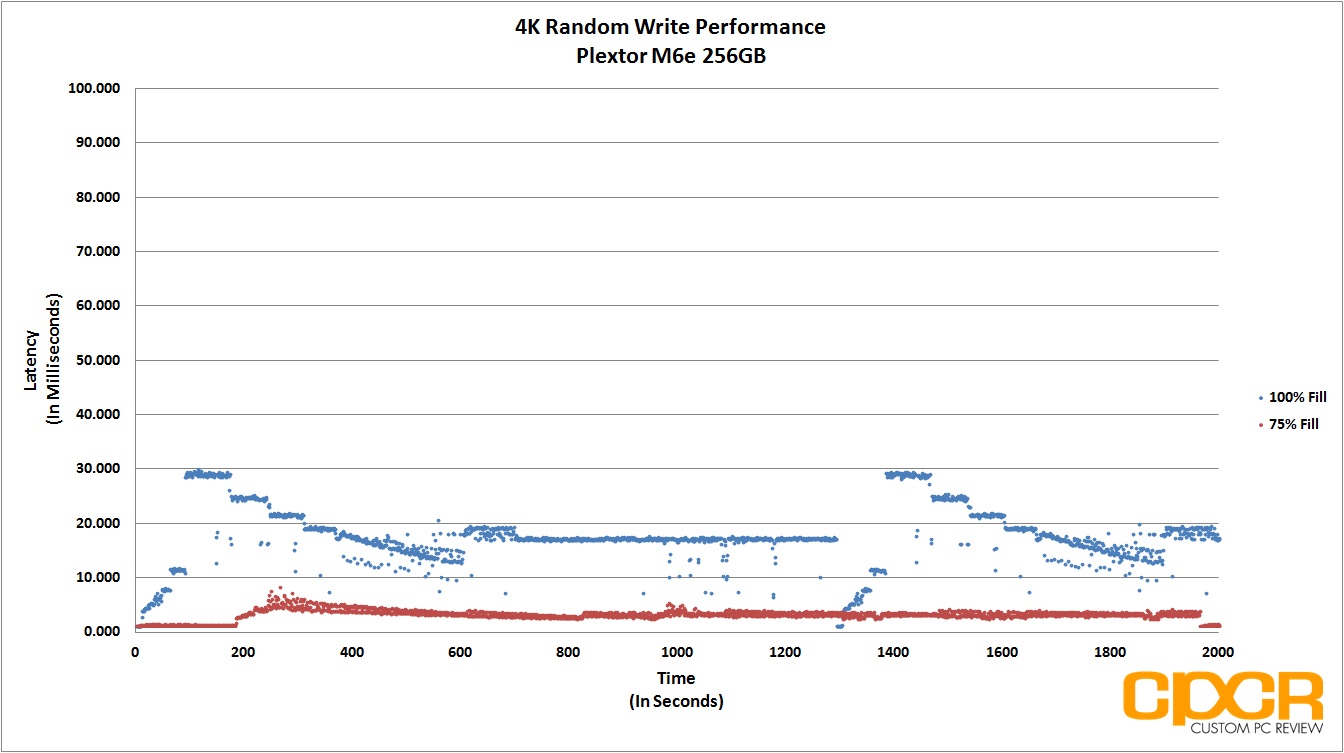
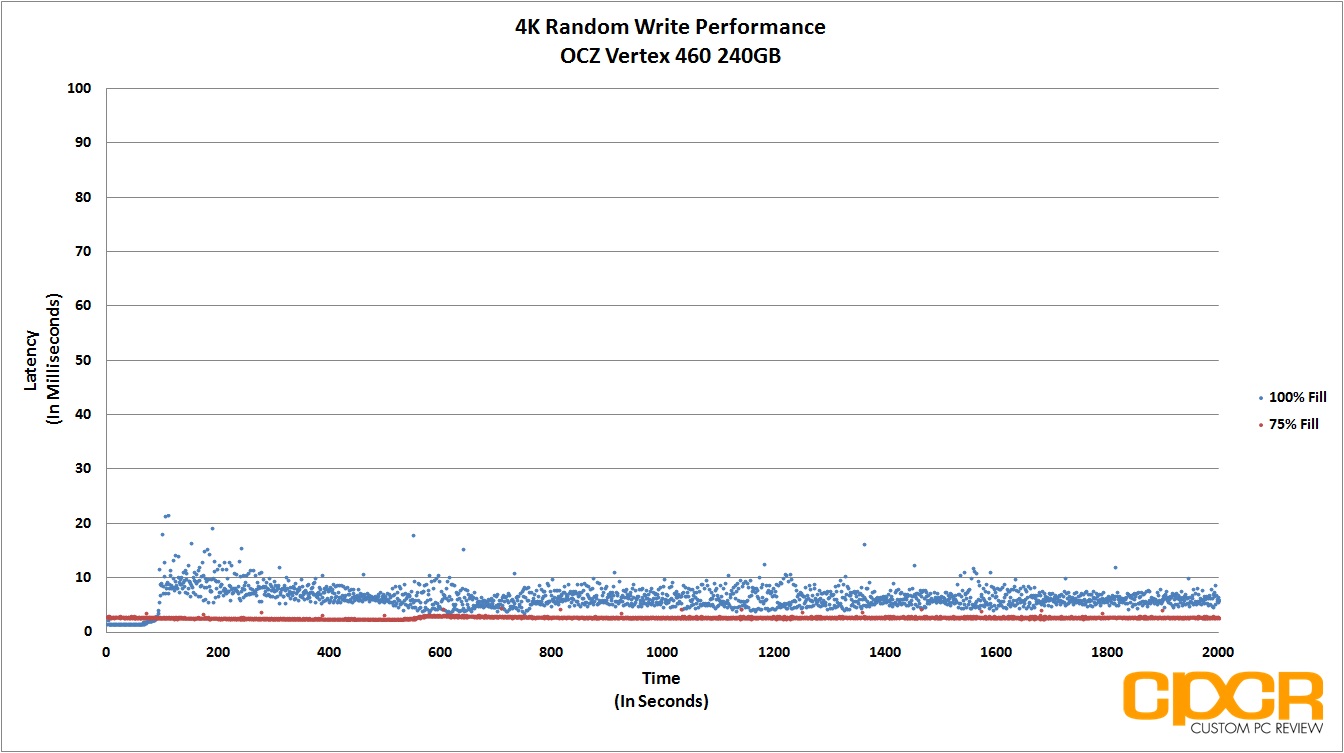
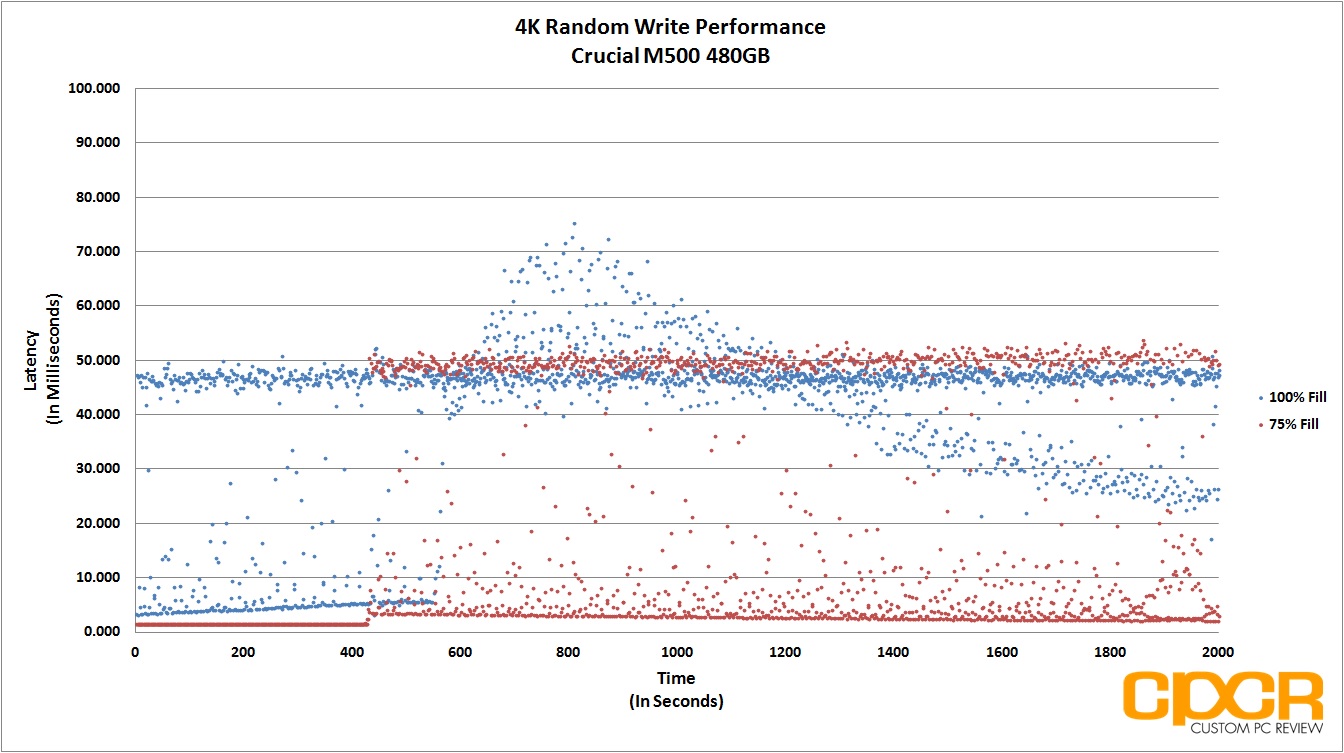
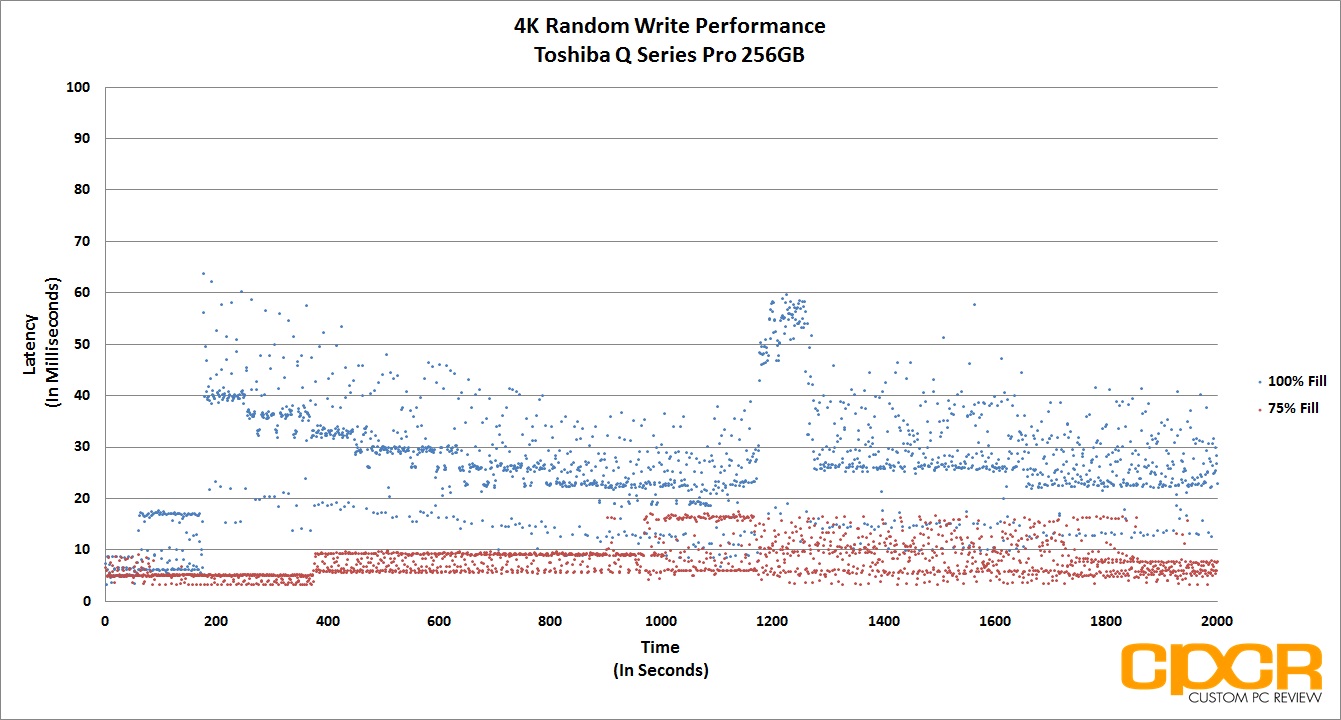

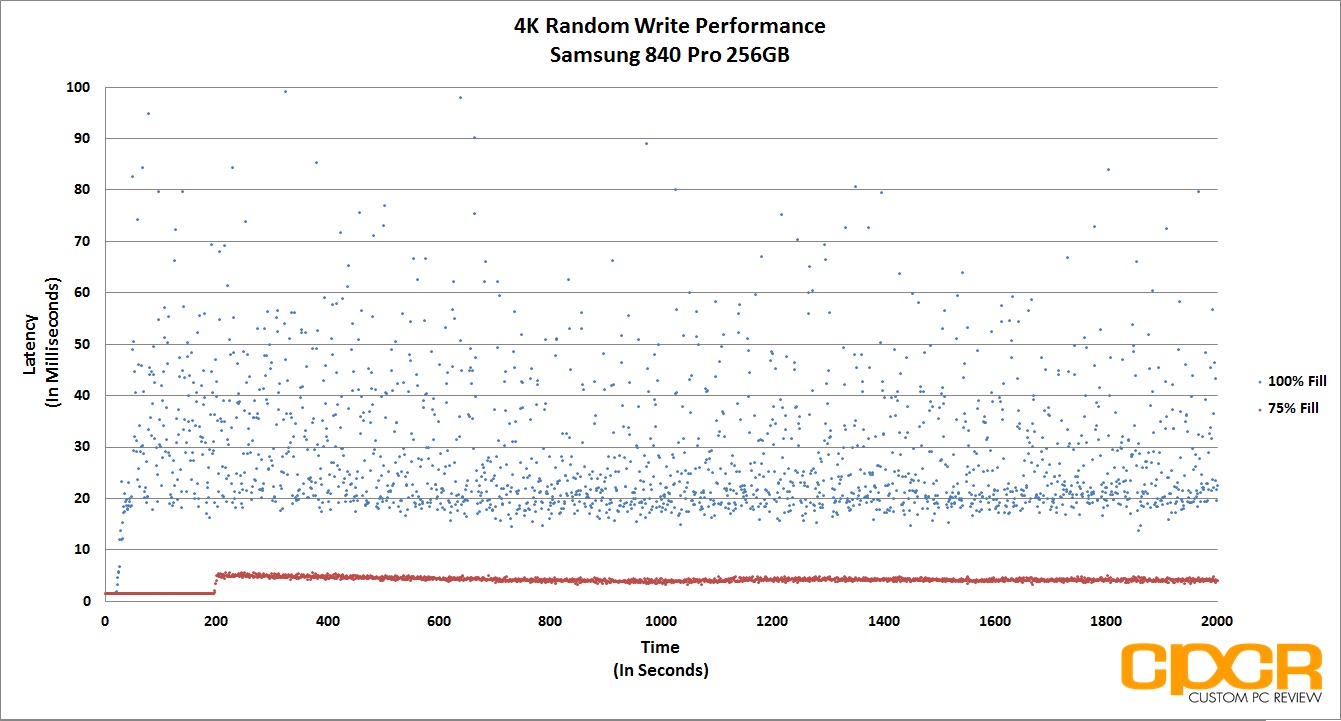
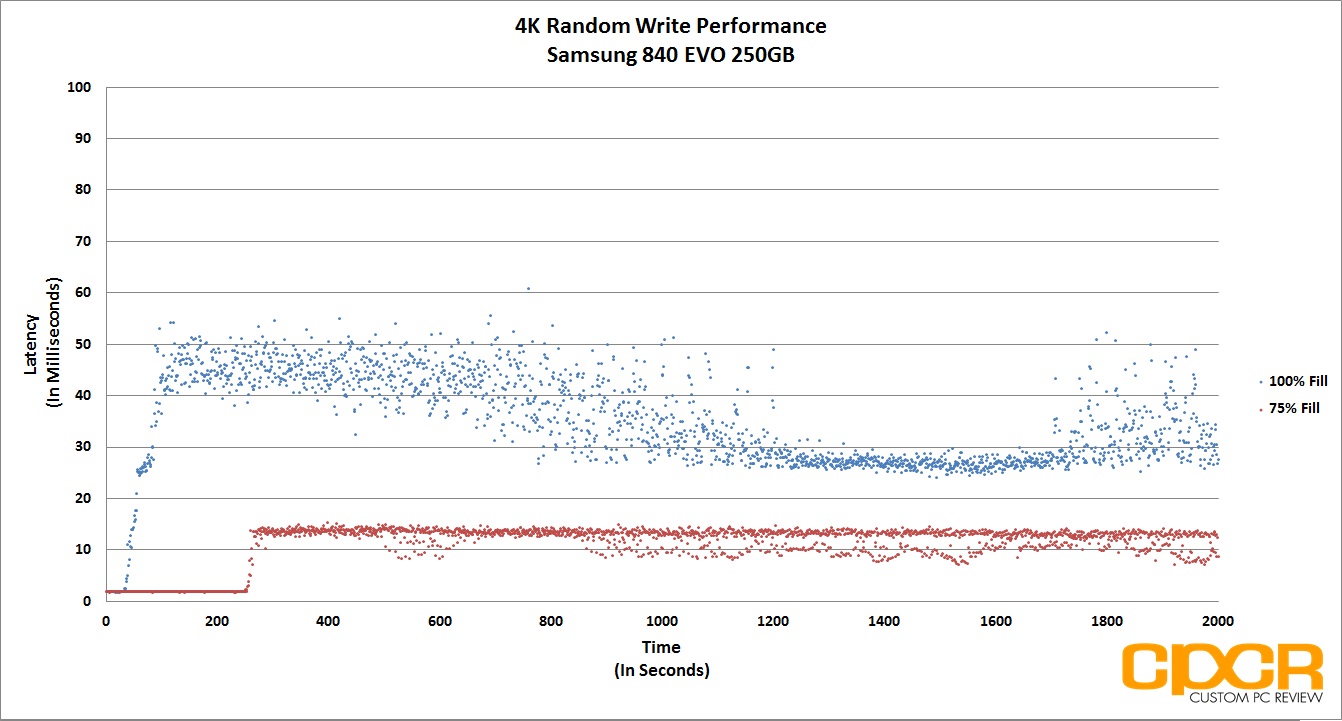
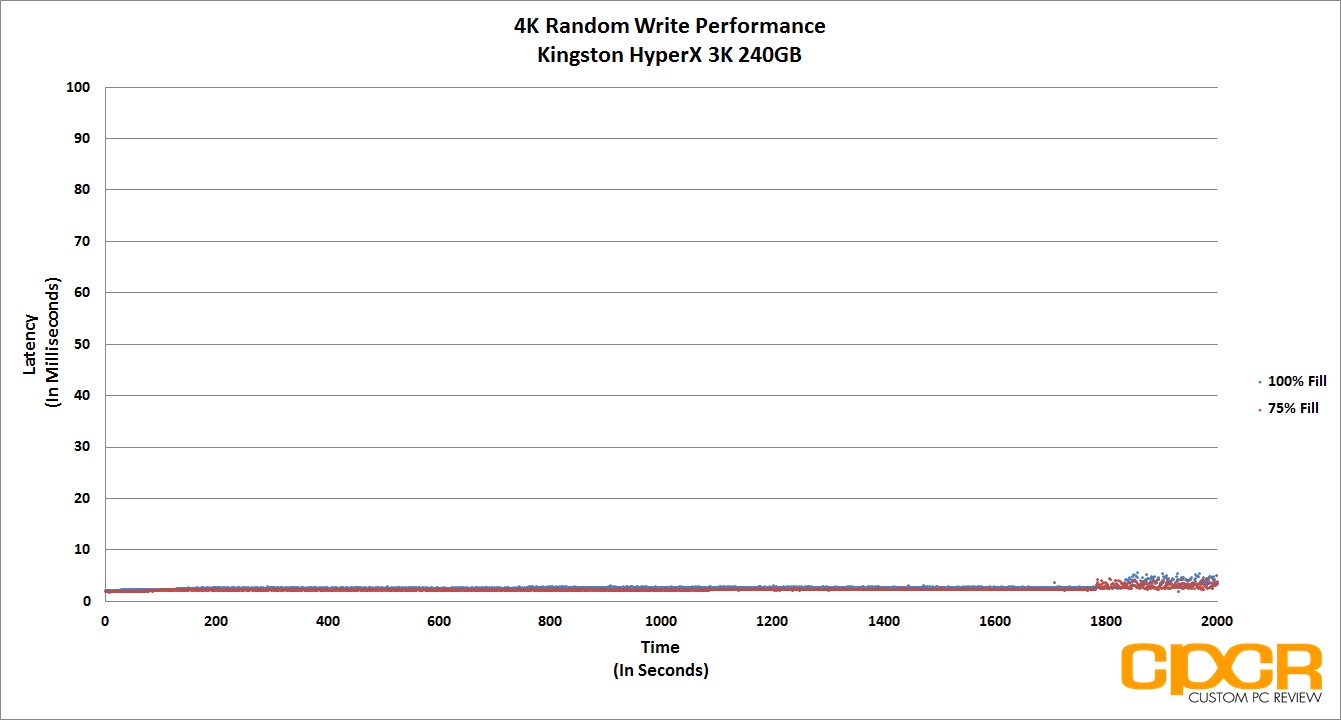
Performance Analysis
Latency is well kept under 35ms, so no complaints here. Consistency is decent for a mainstream drive, but it’s definitely no Samsung 850 PRO or SanDisk Extreme PRO.
[section label=”10. FIO – 128K Random Write”]
Samsung 850 EVO 500GB Performance
FIO 128K Random Write Consistency Testing
In addition to testing 4K random write consistency, we’ll also begin to test for 128K random write consistency to see how well a SSD is able to hold itself to a level of performance when getting hammered with larger file transfers.
[tabgroup]
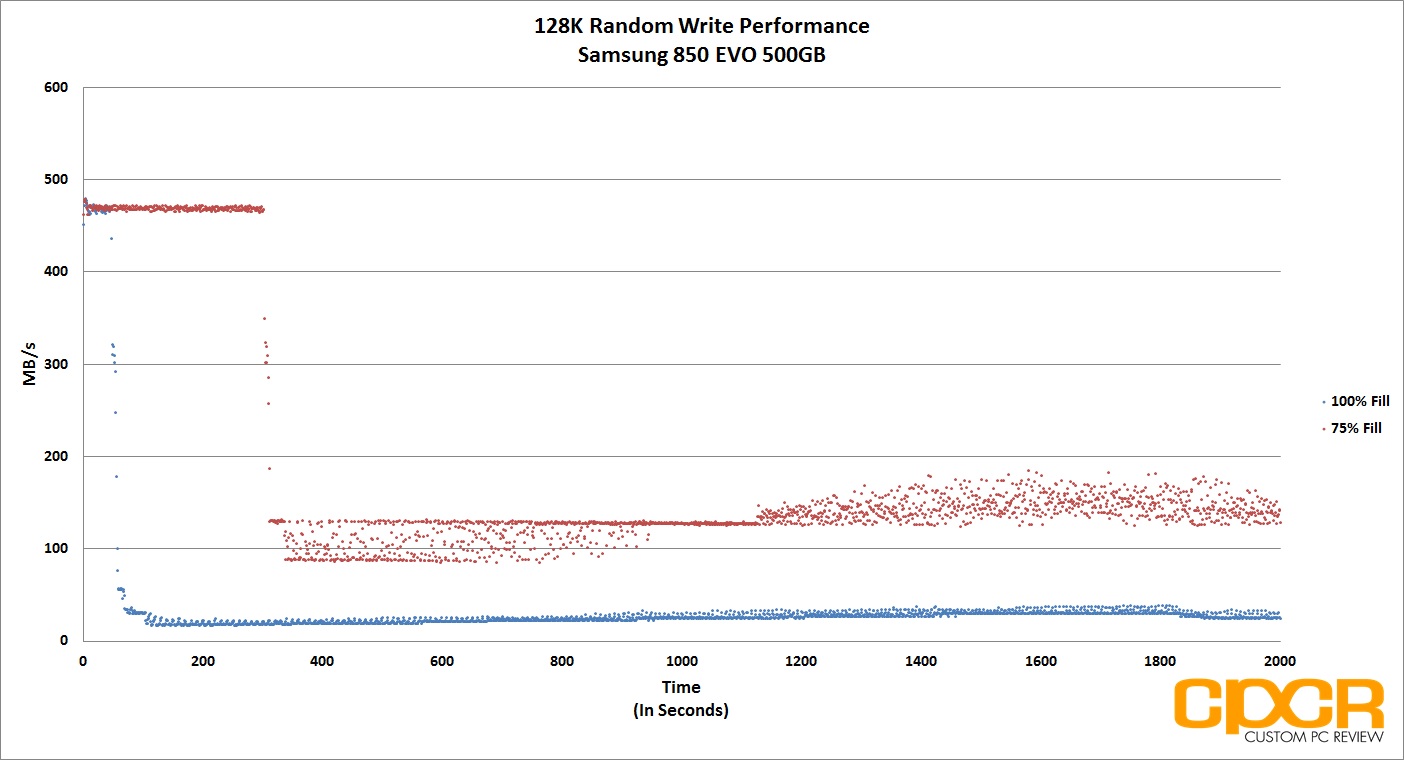

Performance Analysis
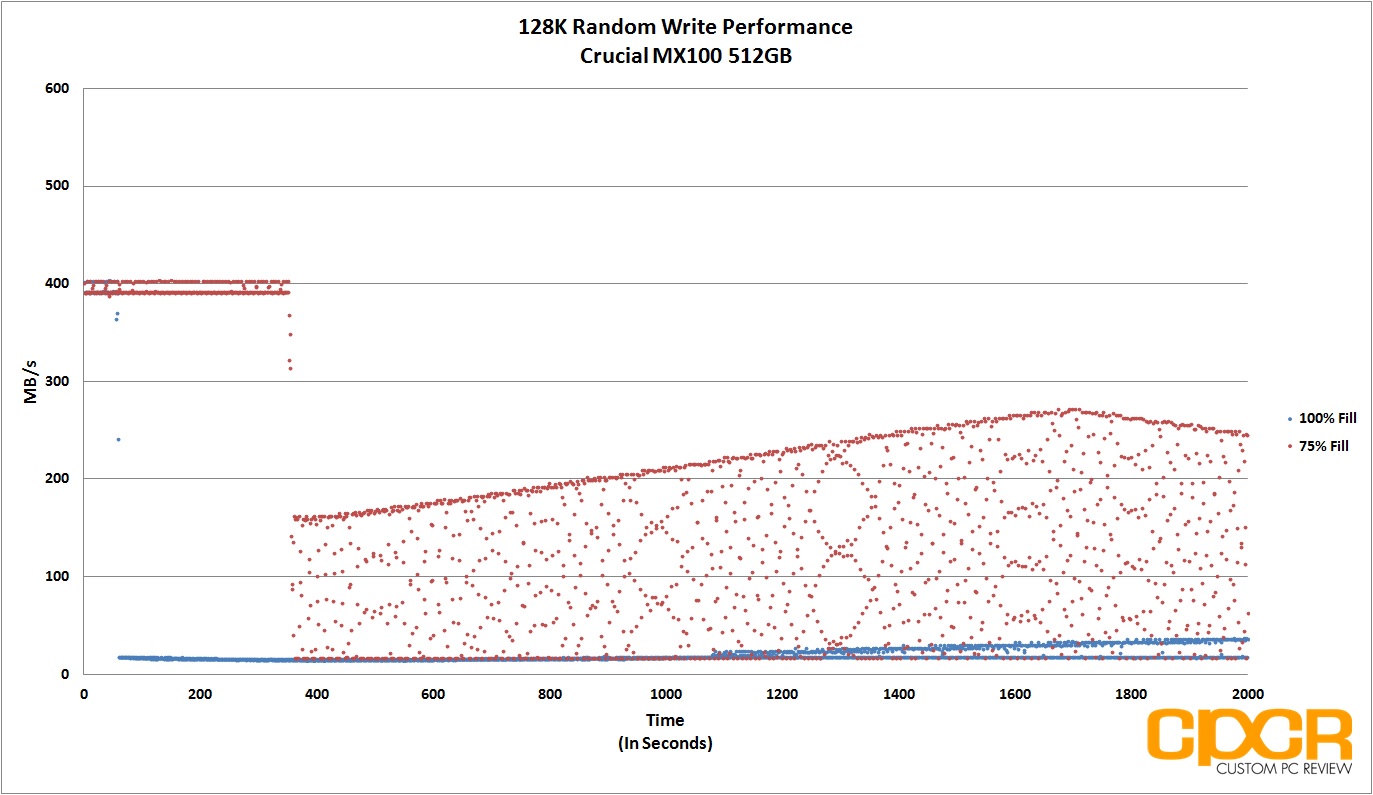
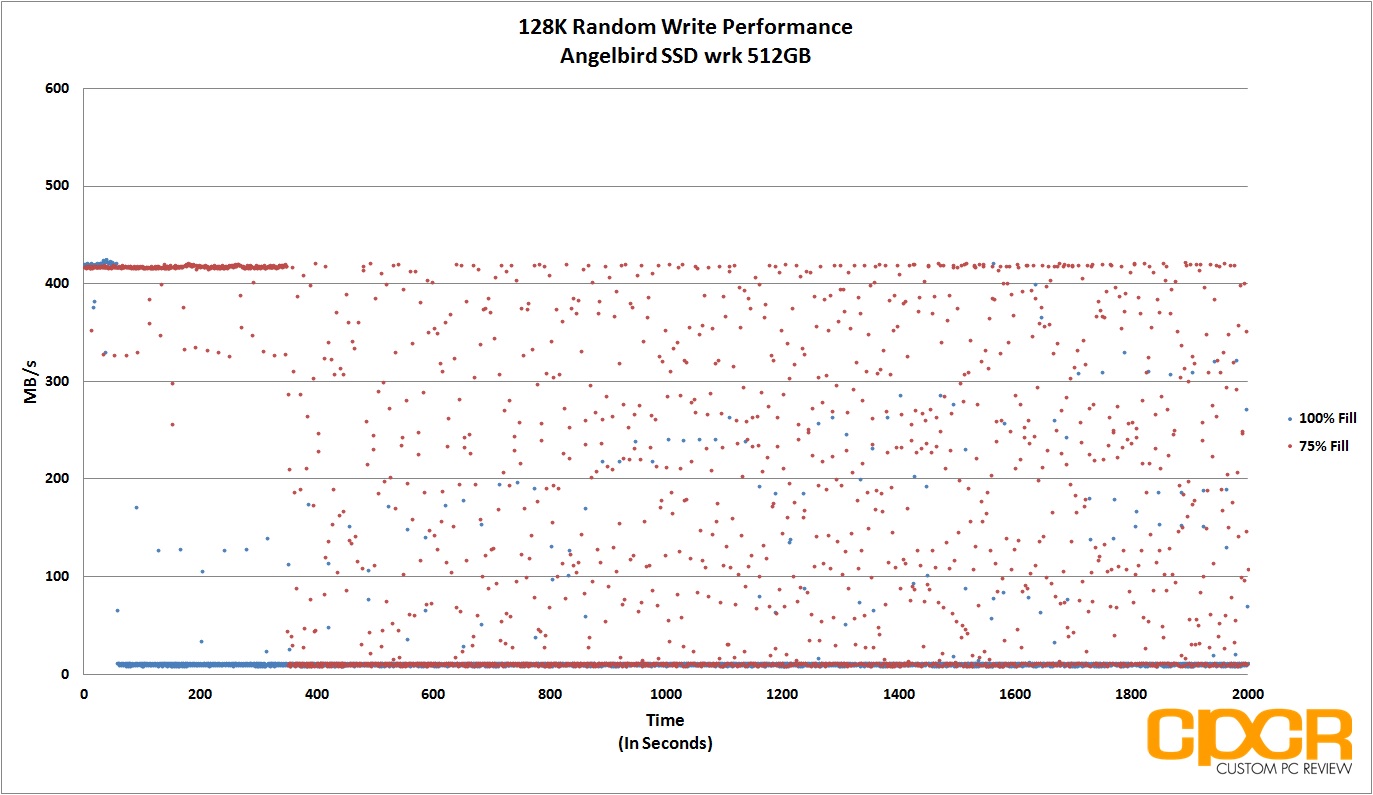
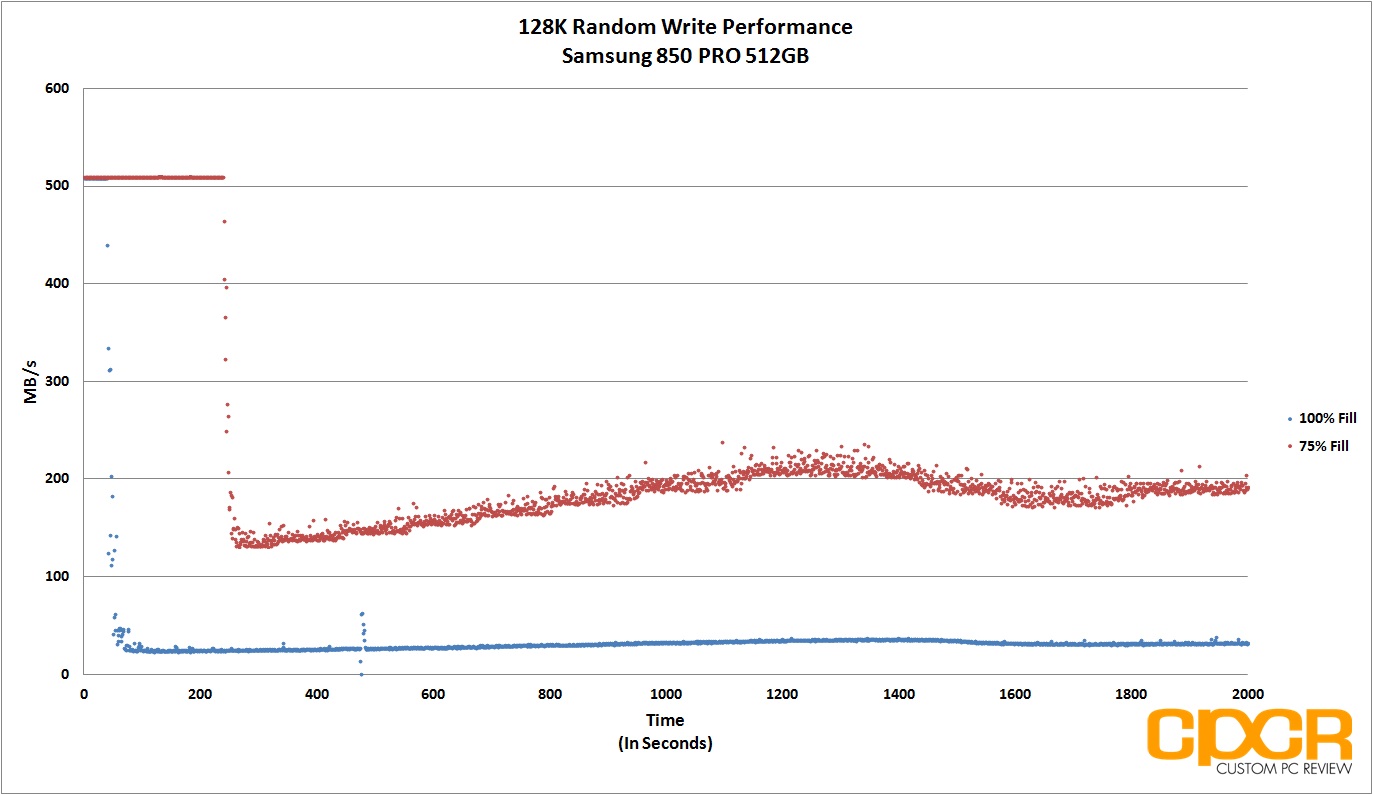
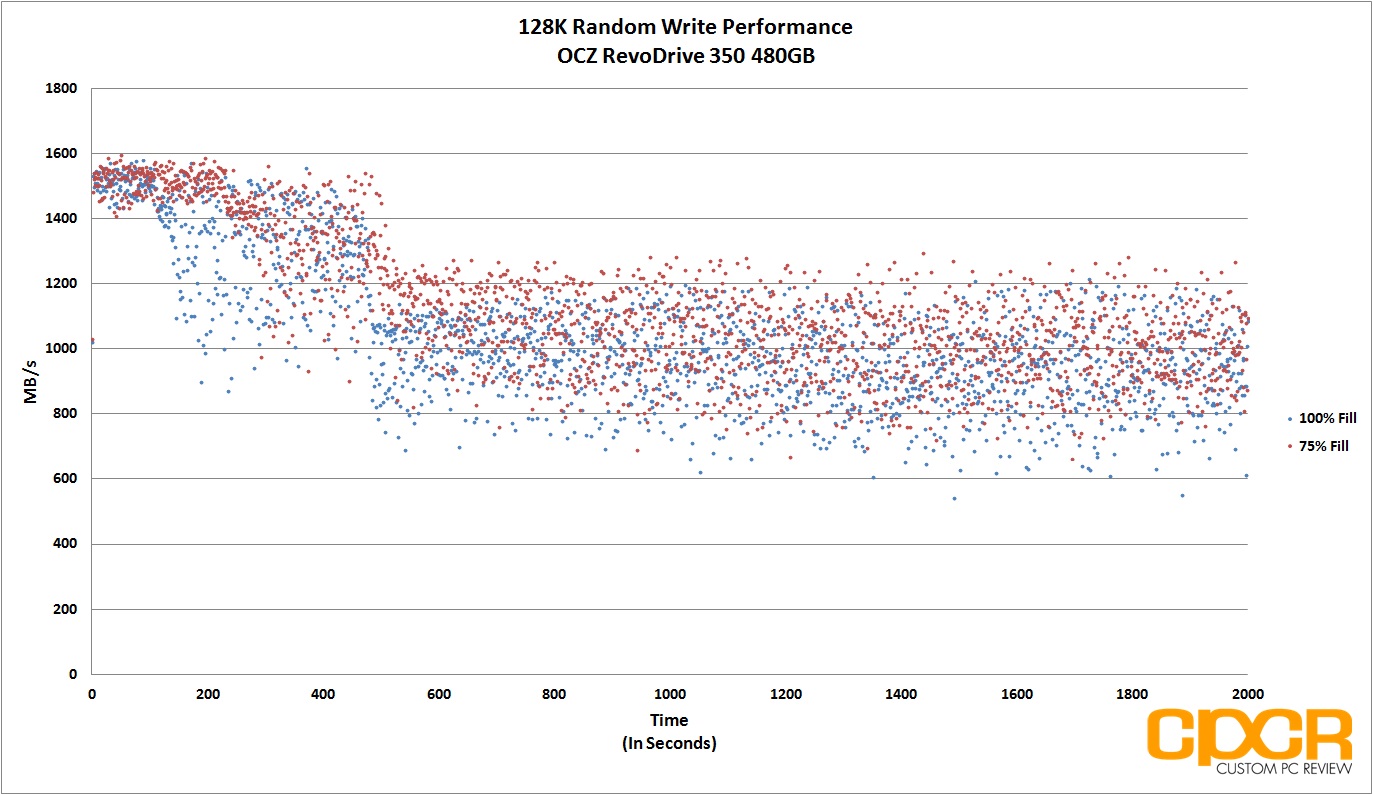
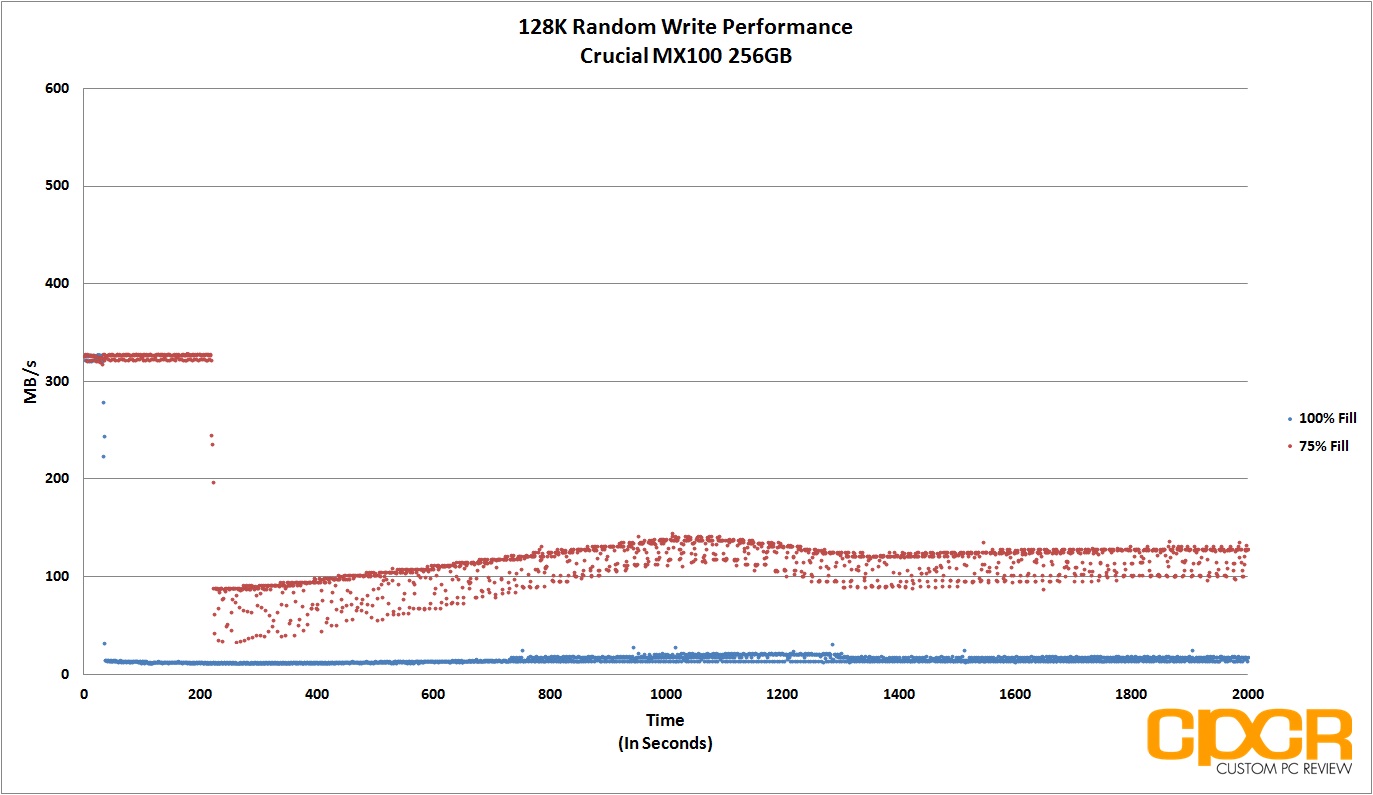
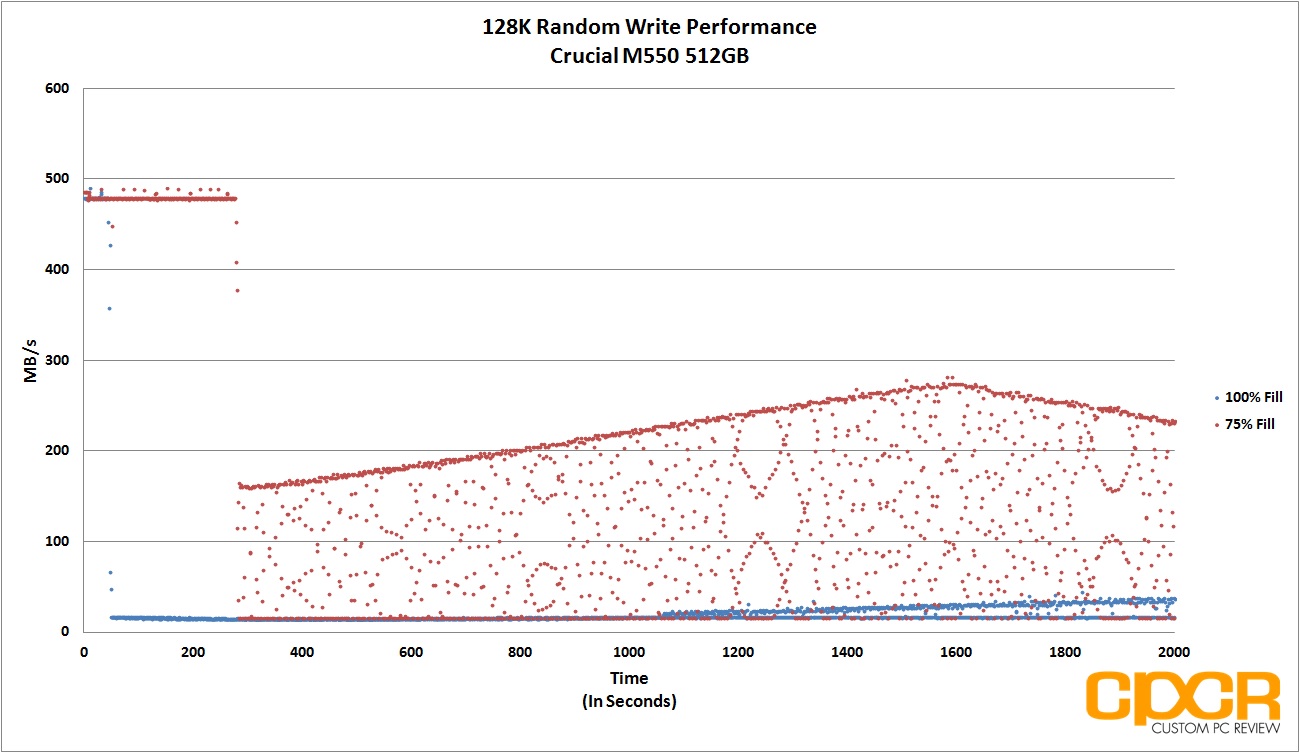
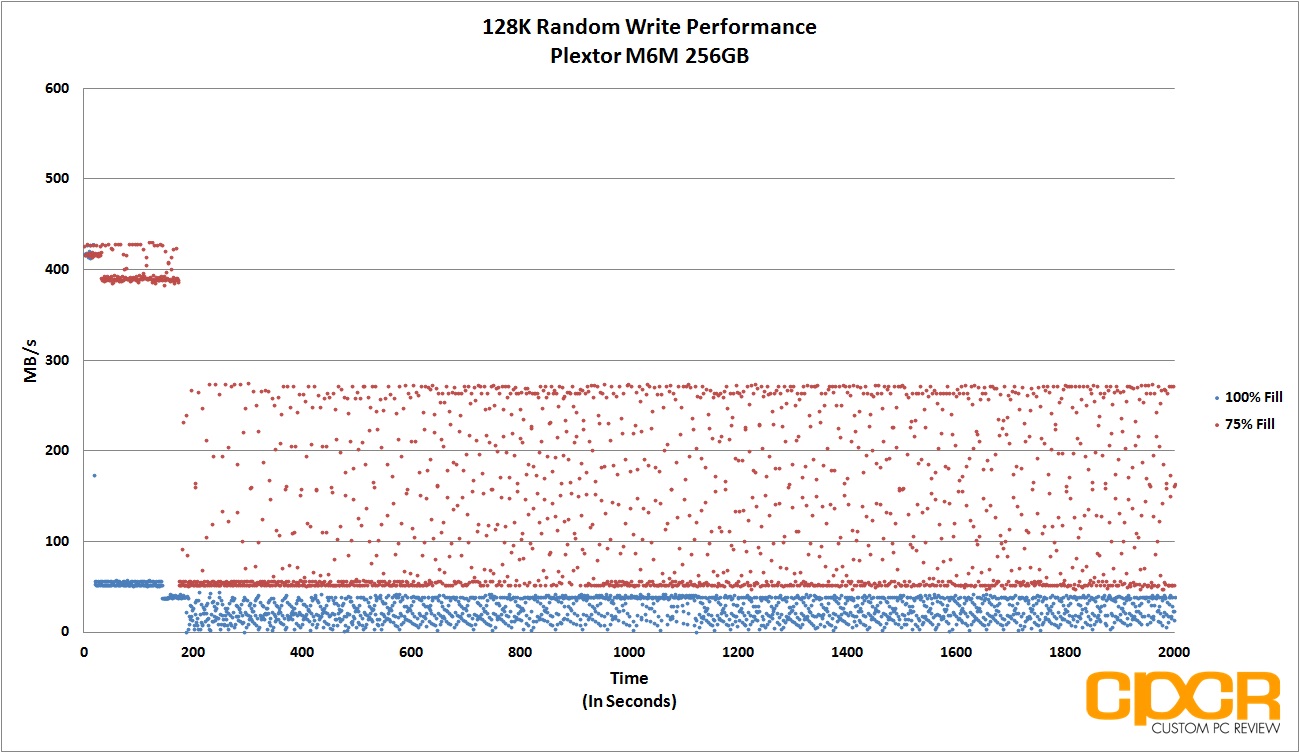
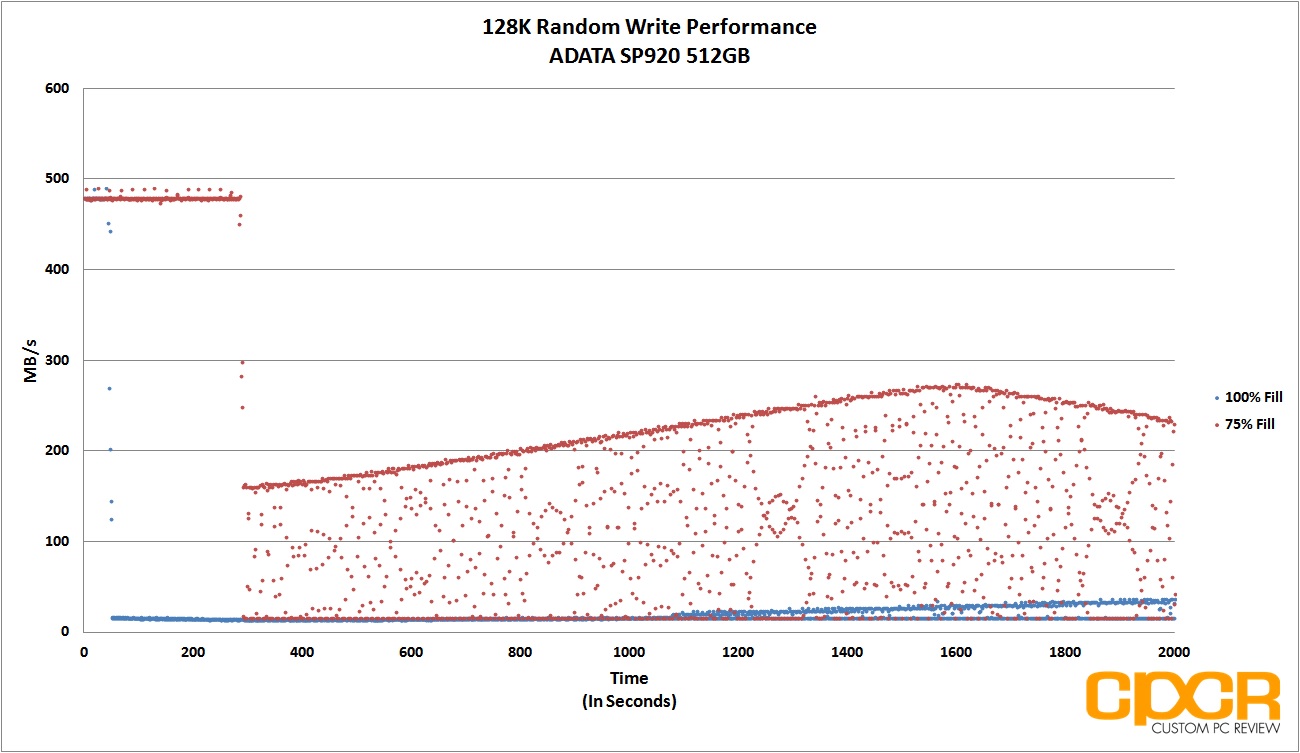
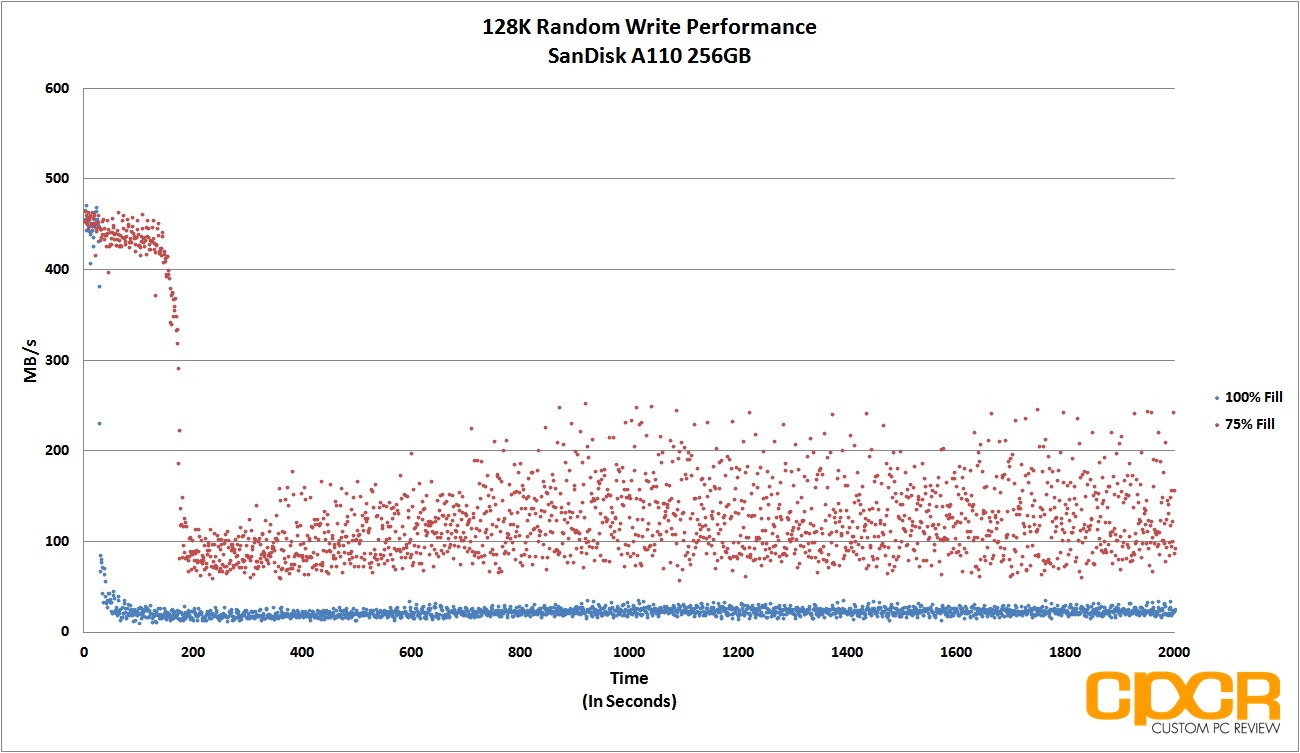
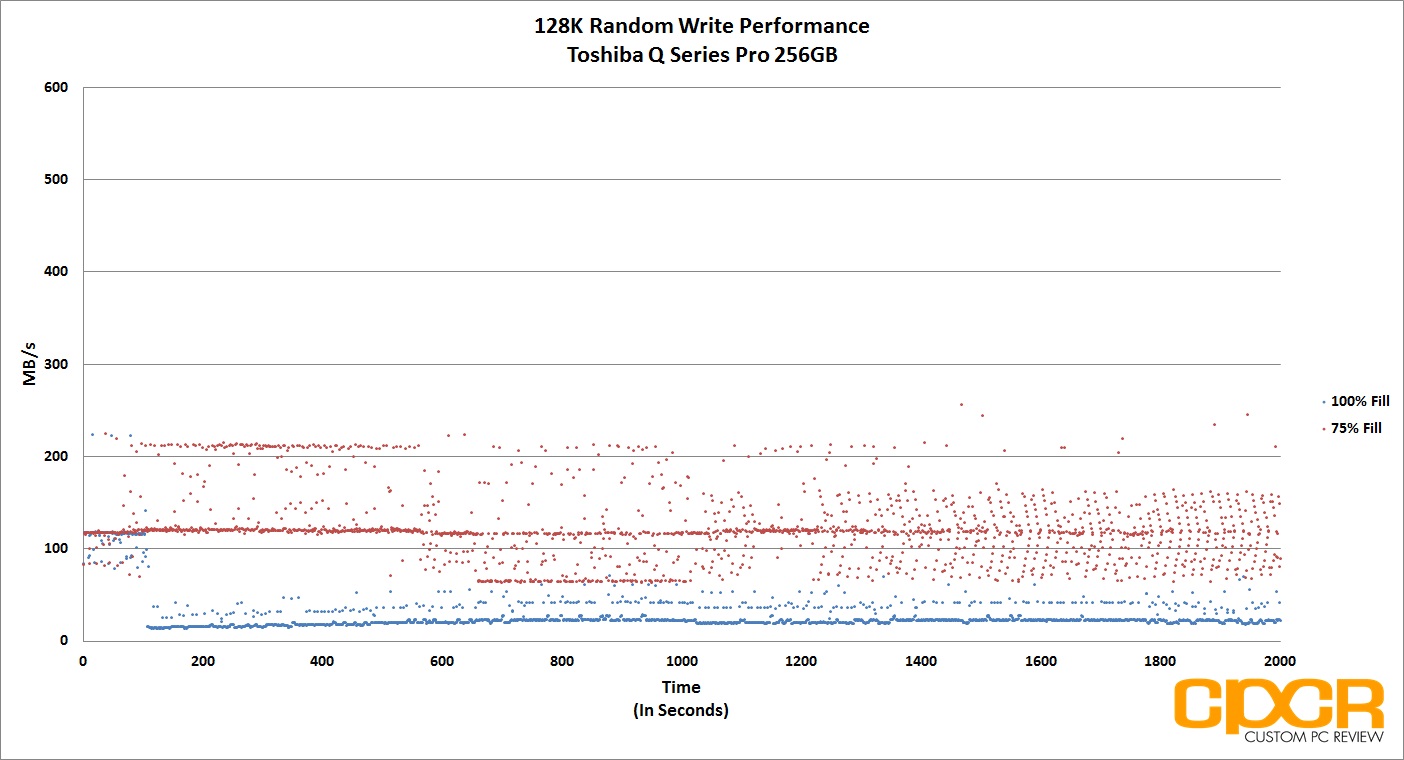
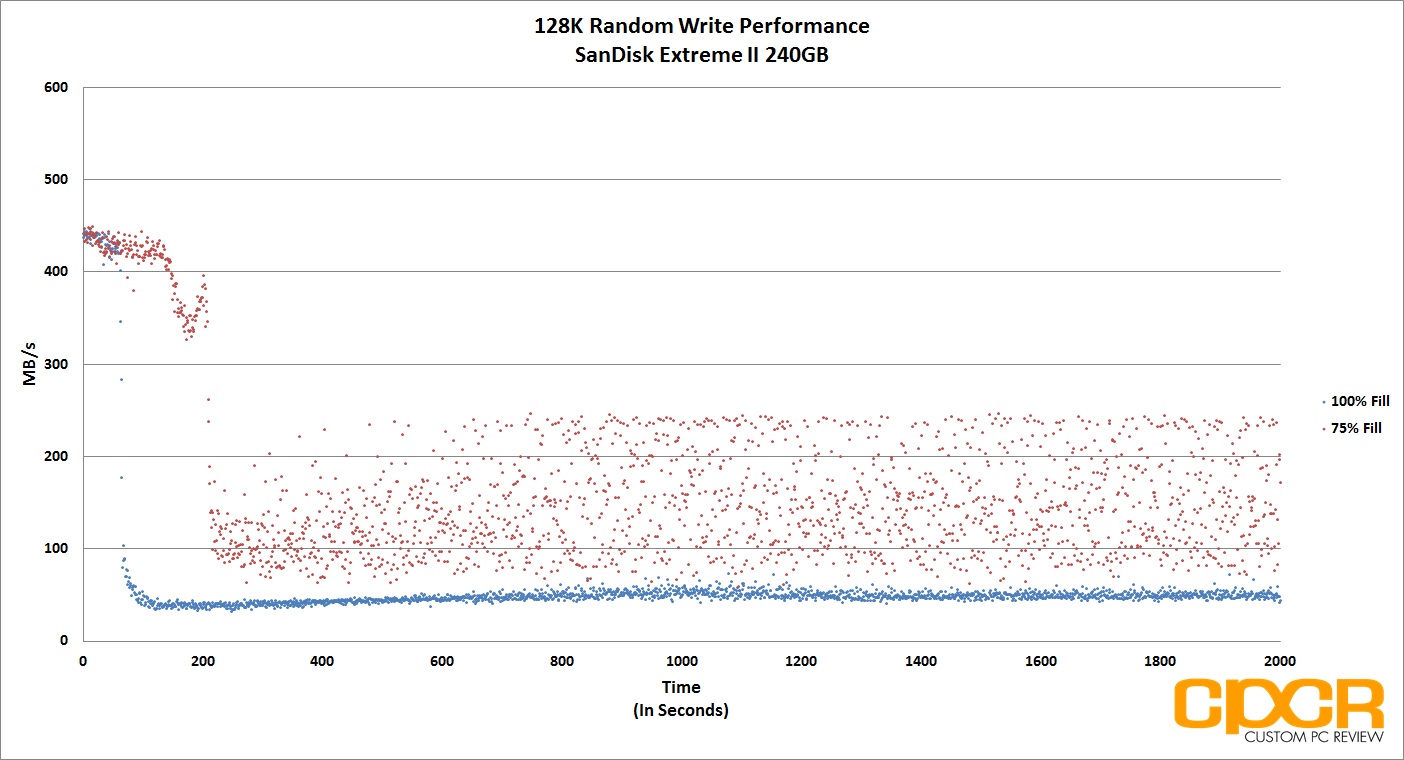
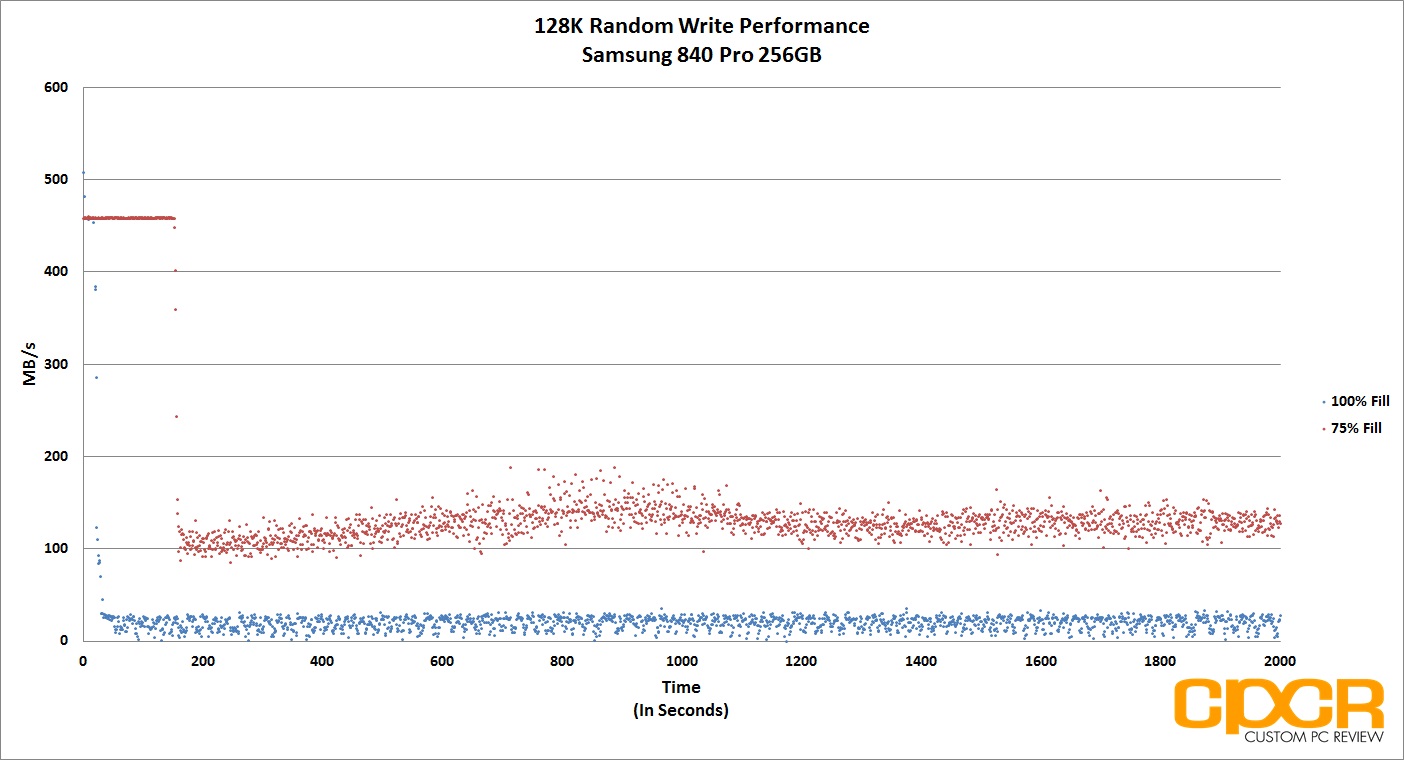
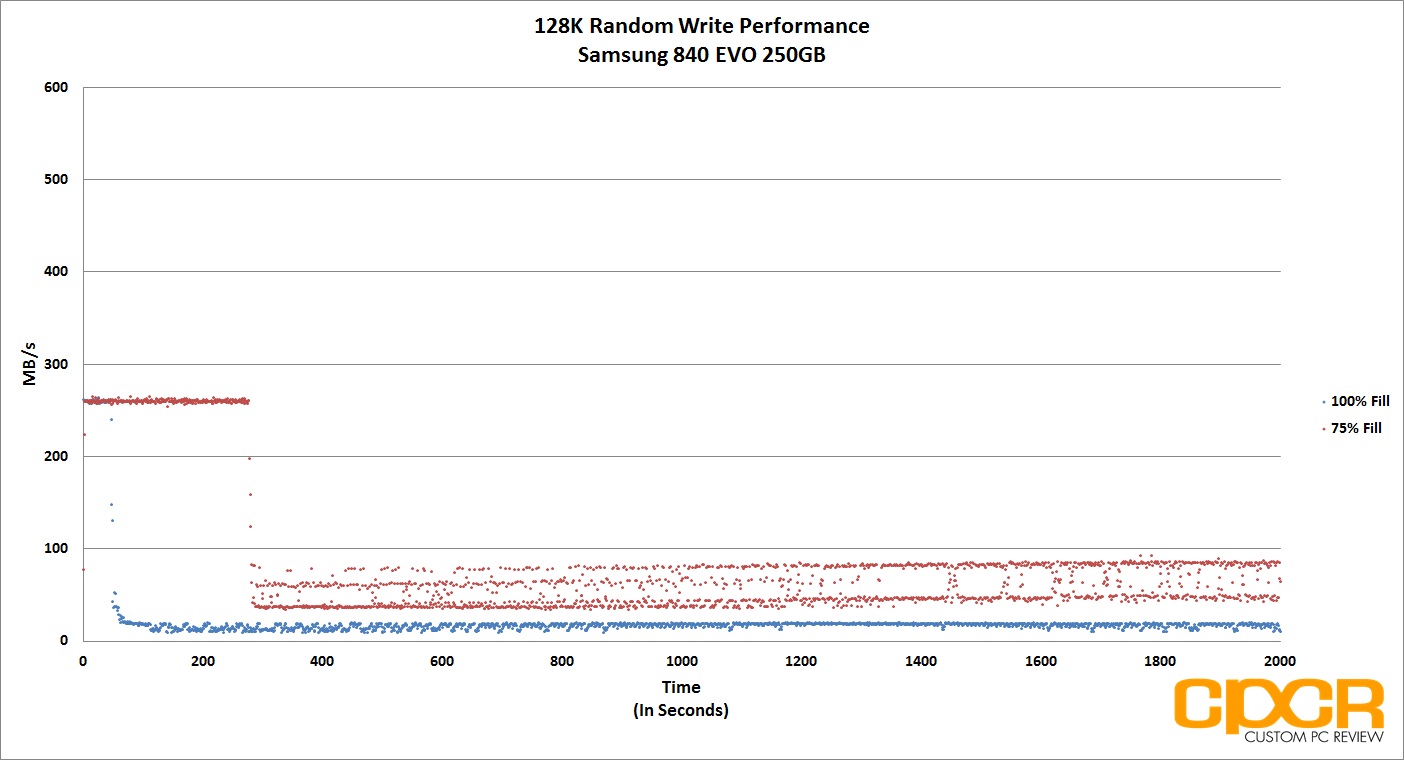
Similar to the Samsung 840 EVO, the Samsung 850 EVO performs poorly when there’s zero spare area available as the drive’s performance dipped to a consistent ~30MB/s when constantly hammered with 128K data. That said, the drive performs quite well when there’s a good chunk of spare area available, maintaining an average of ~150MB/s without issue.
[section label=”11. Power Consumption”]
Samsung 850 EVO 500GB Power Consumption
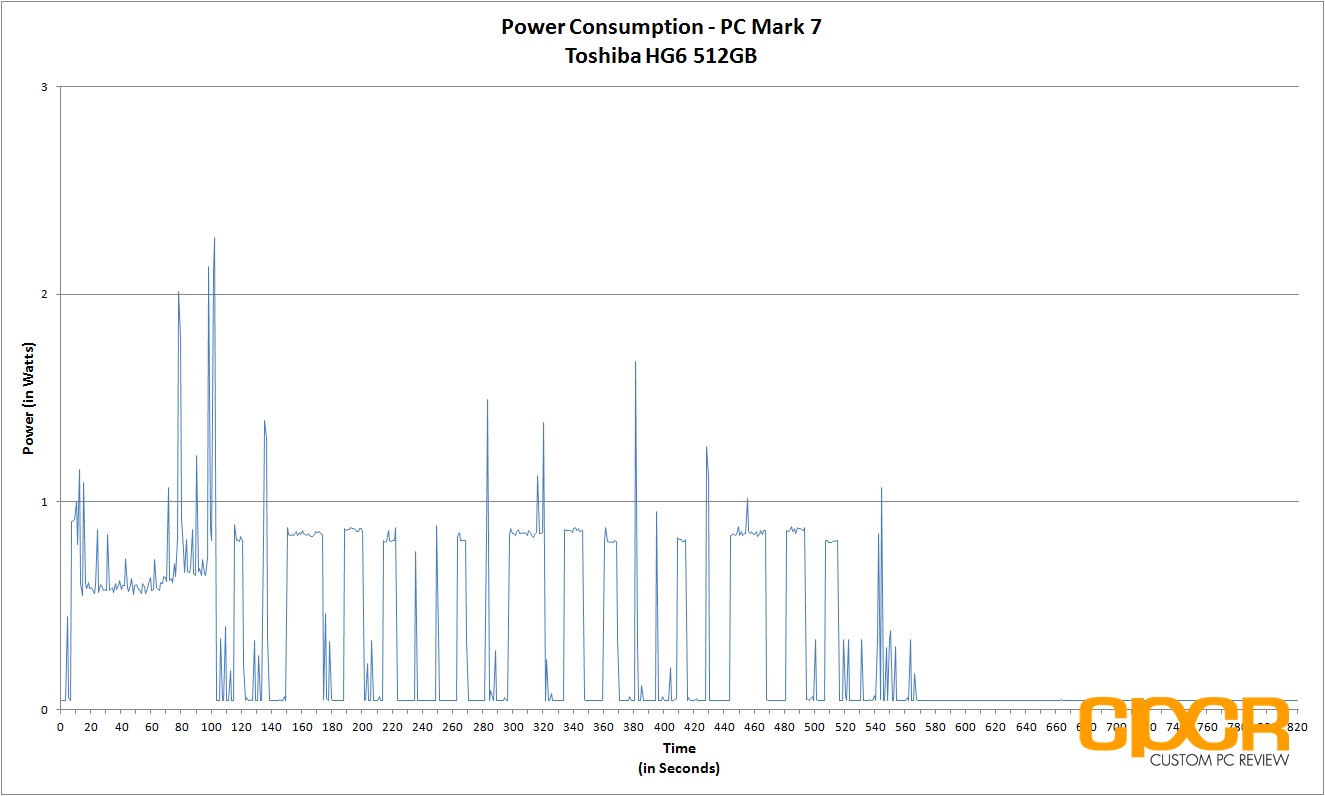
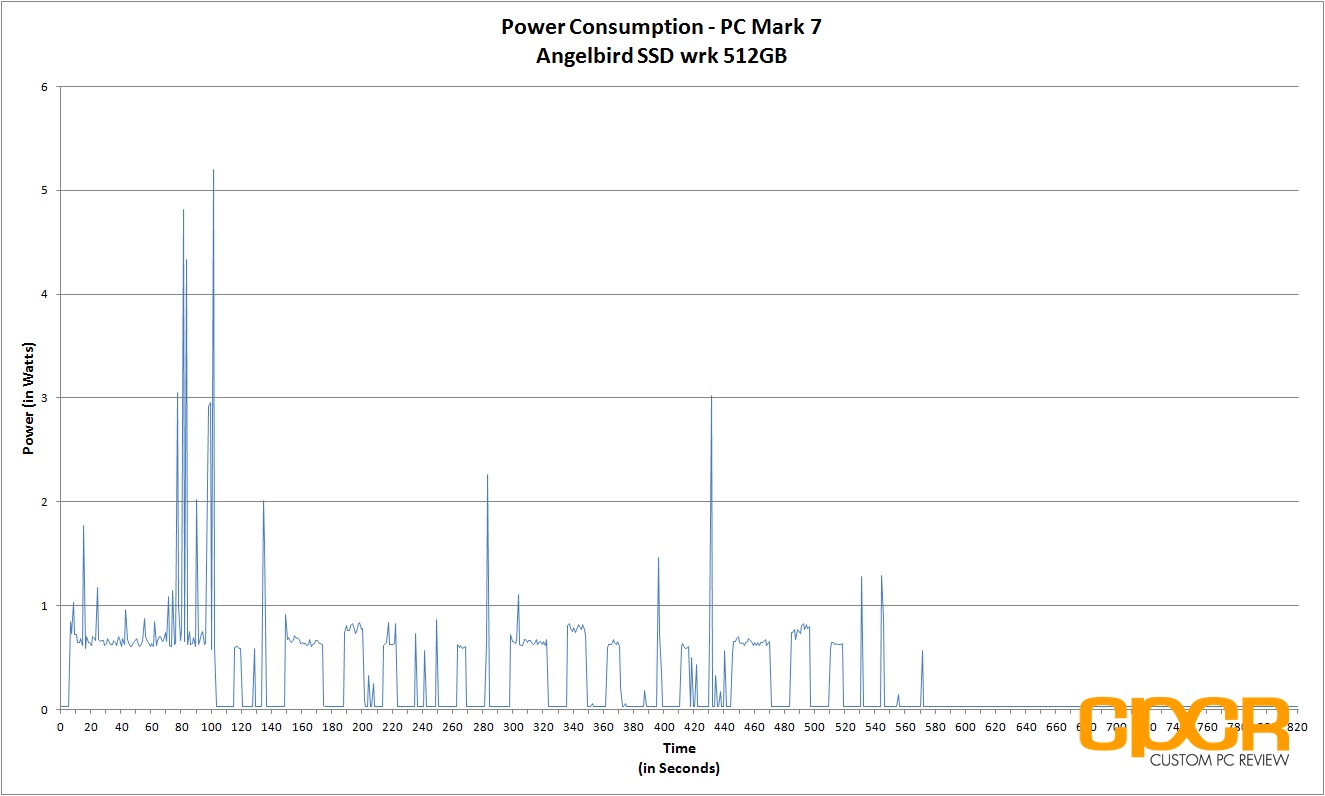
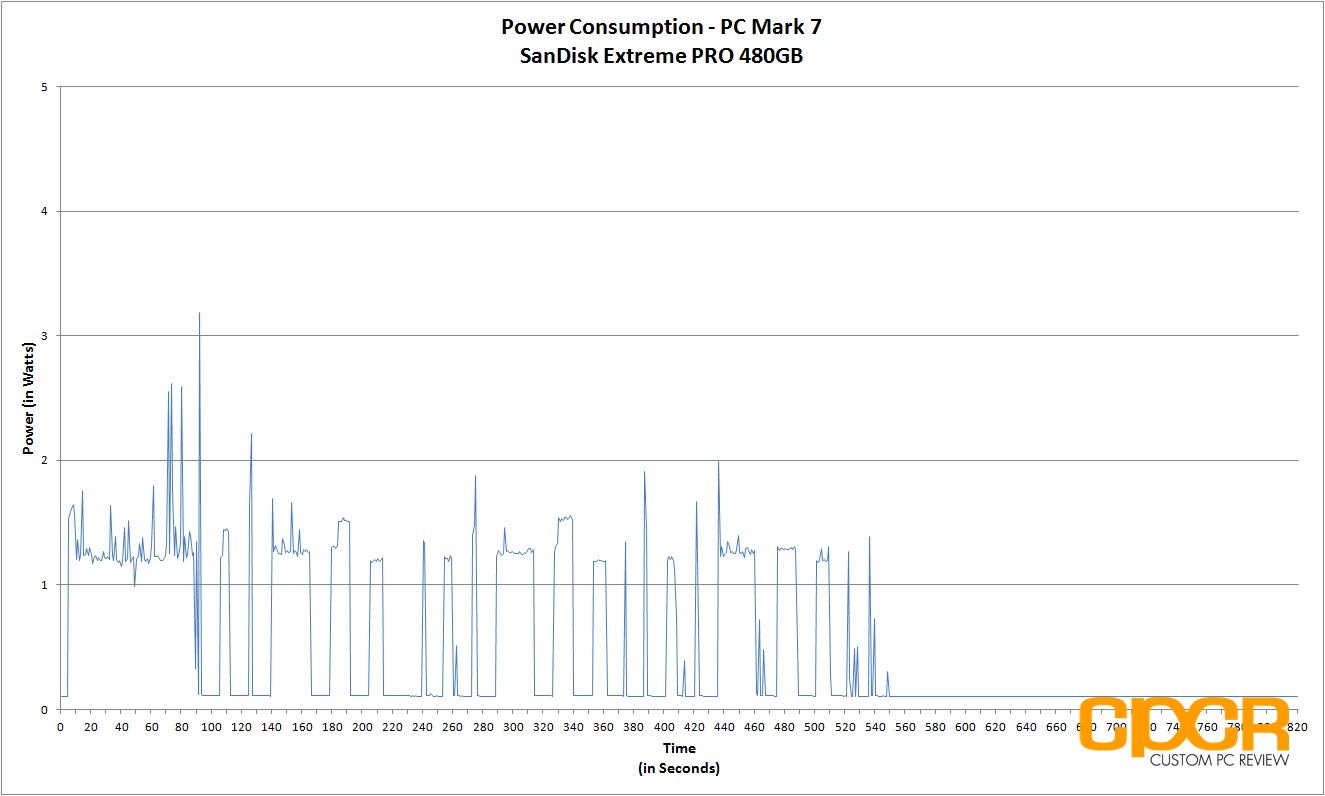
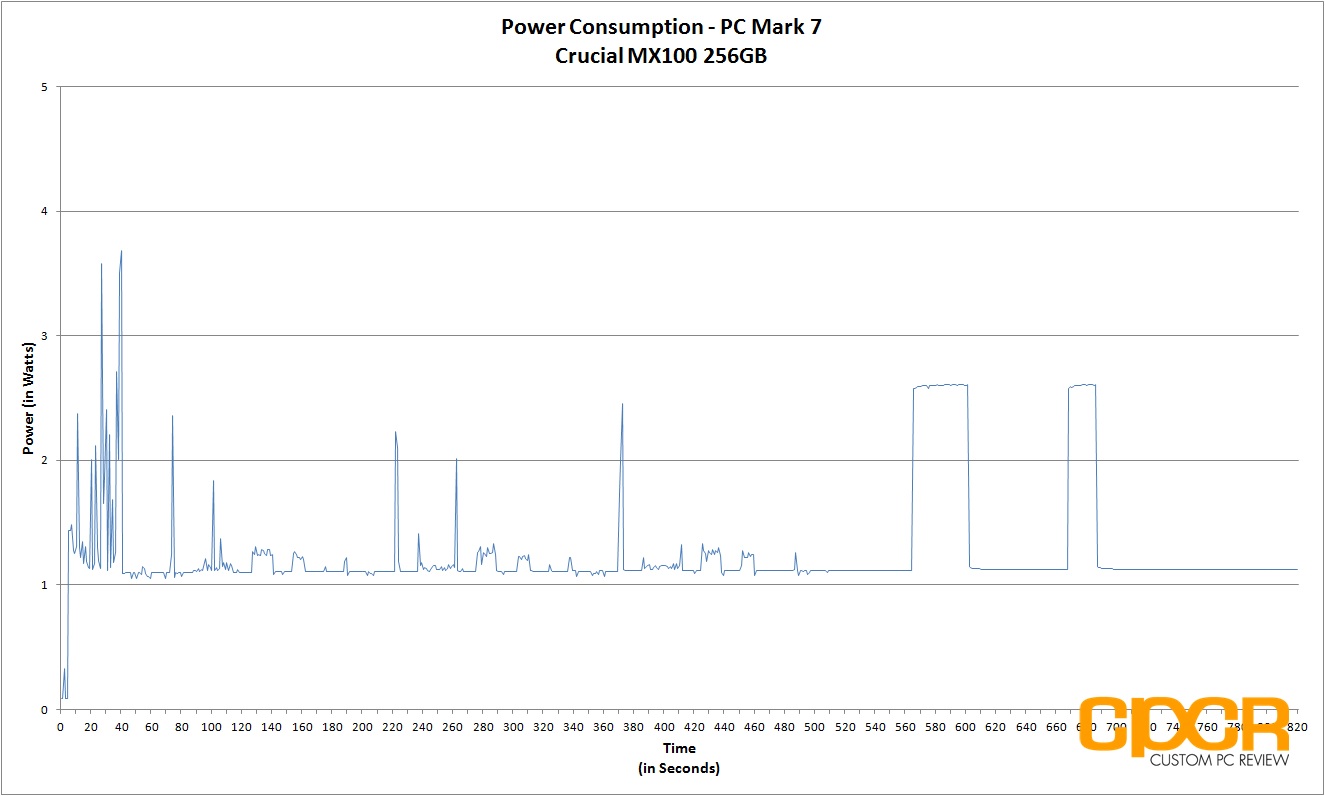
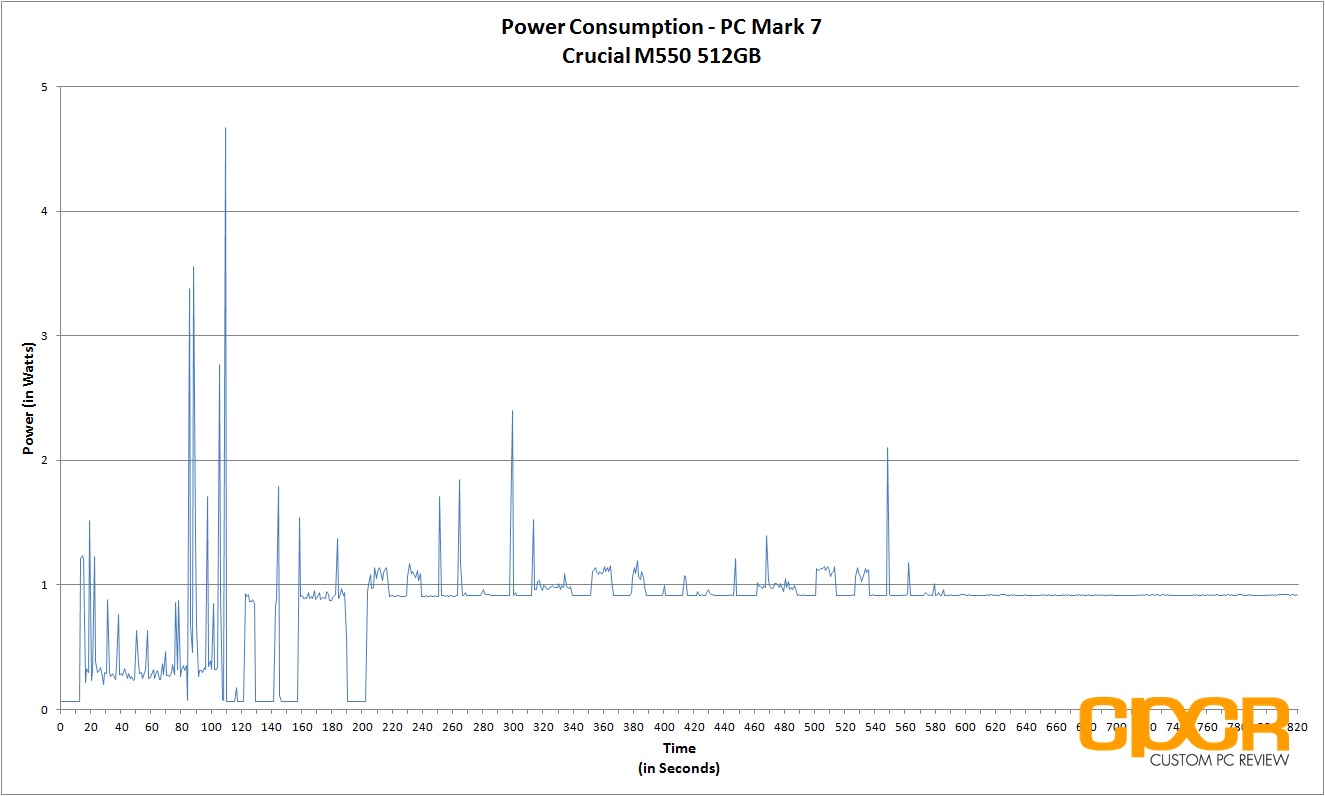
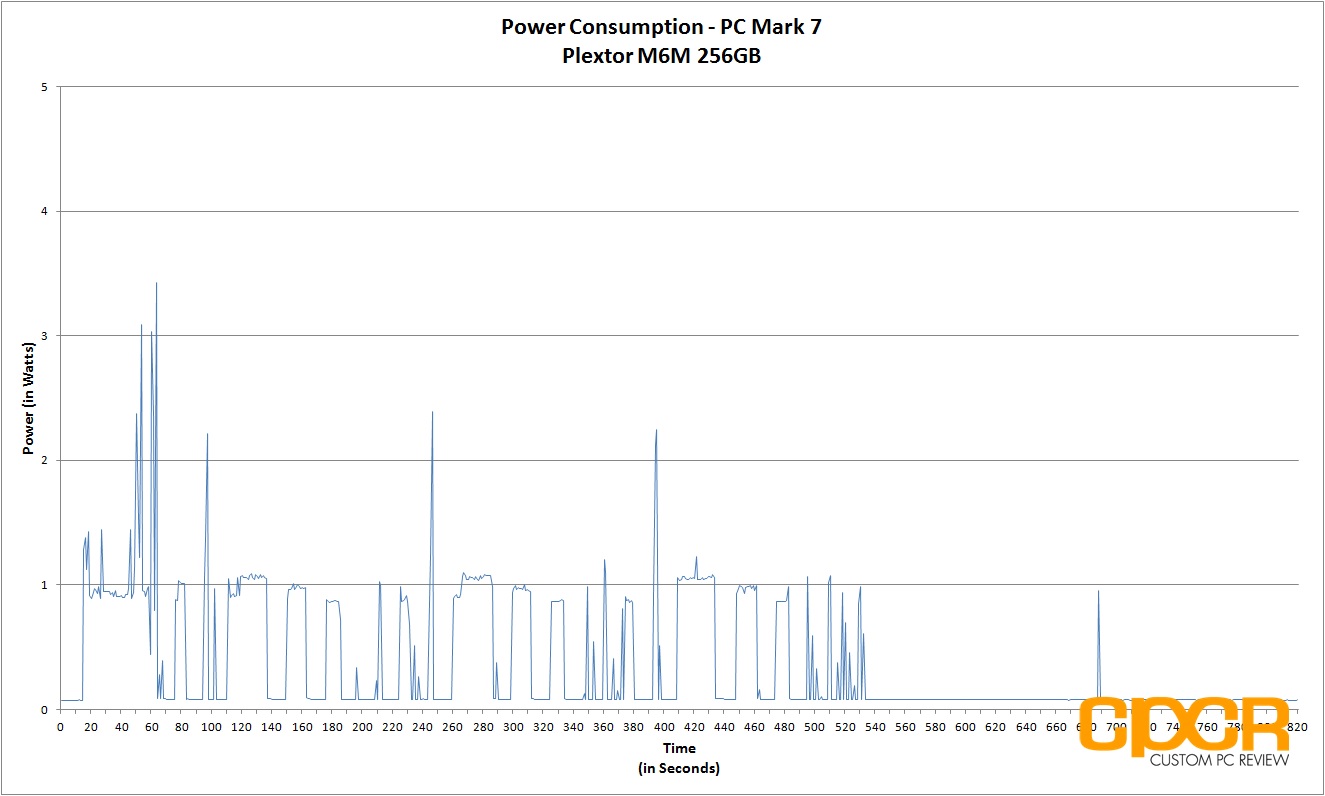
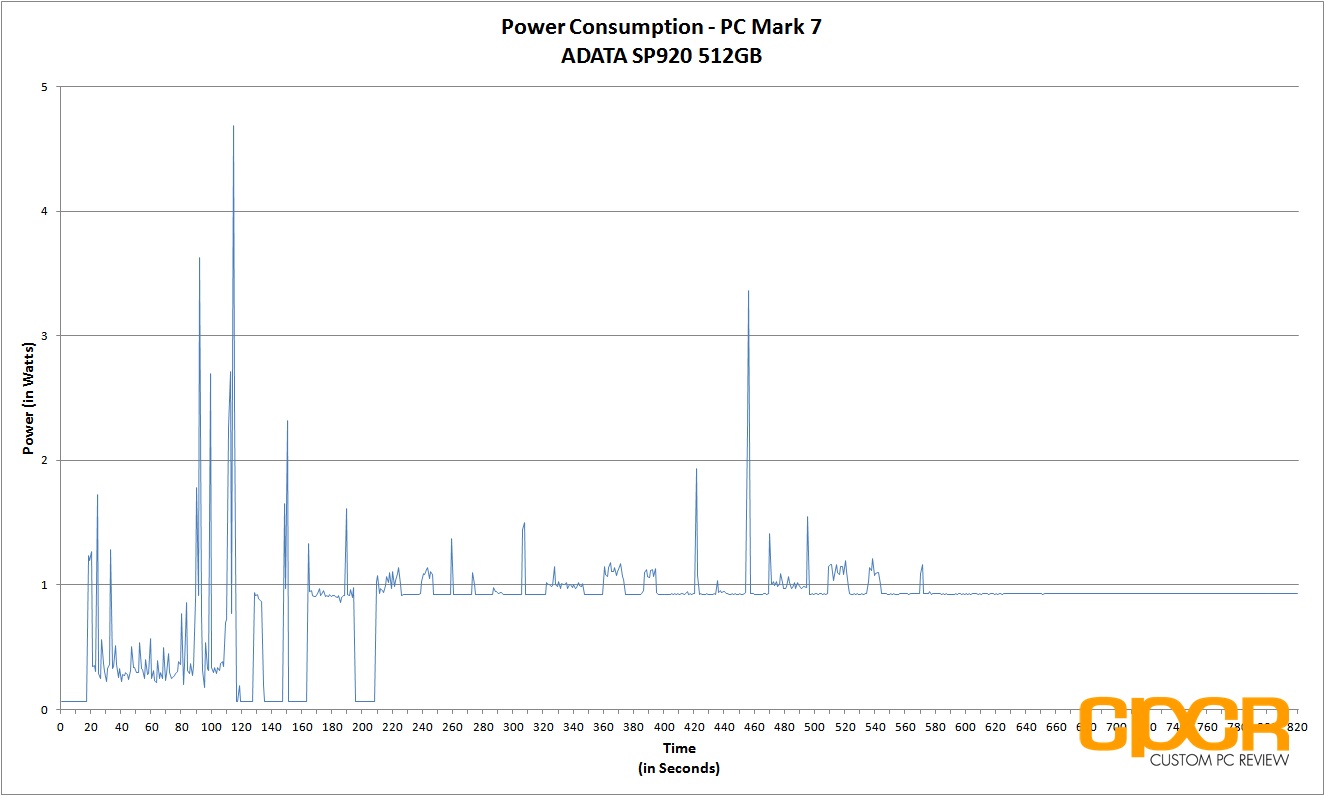
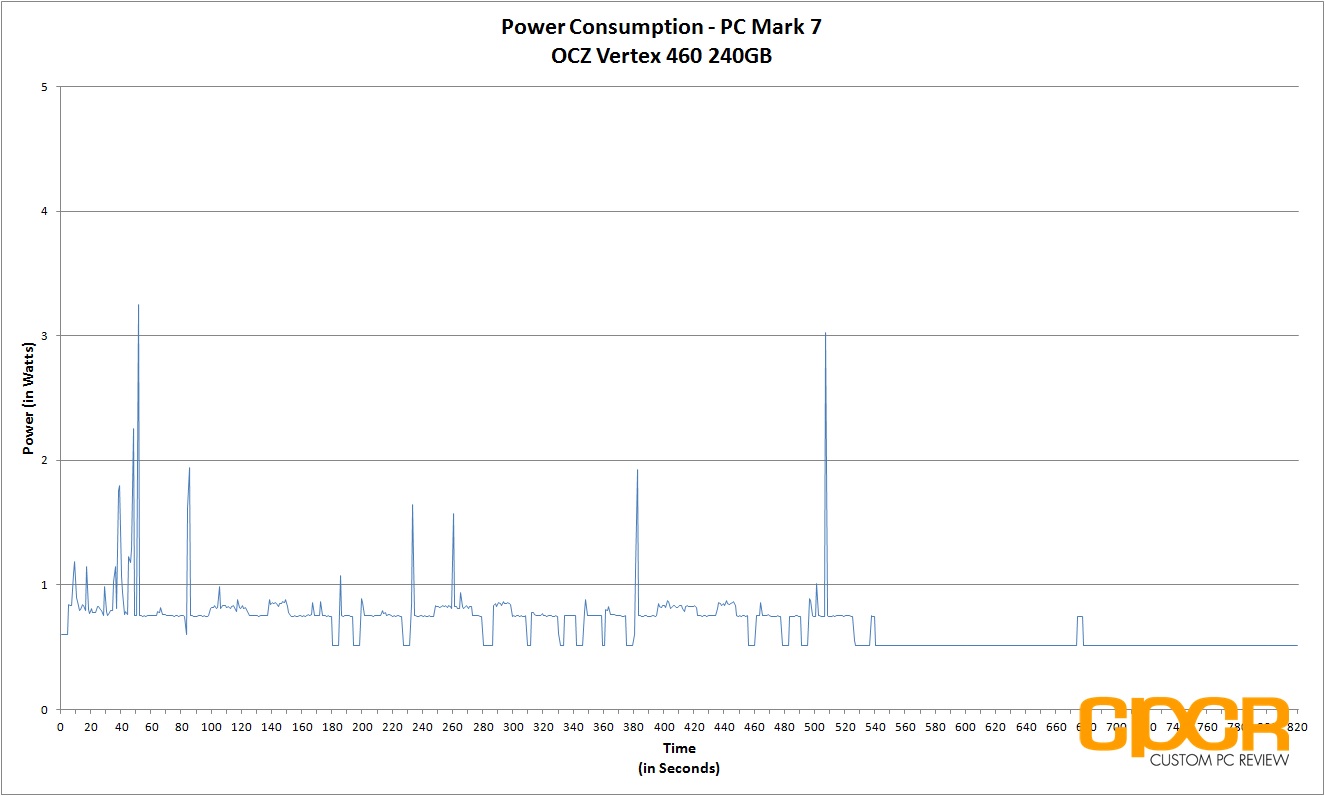
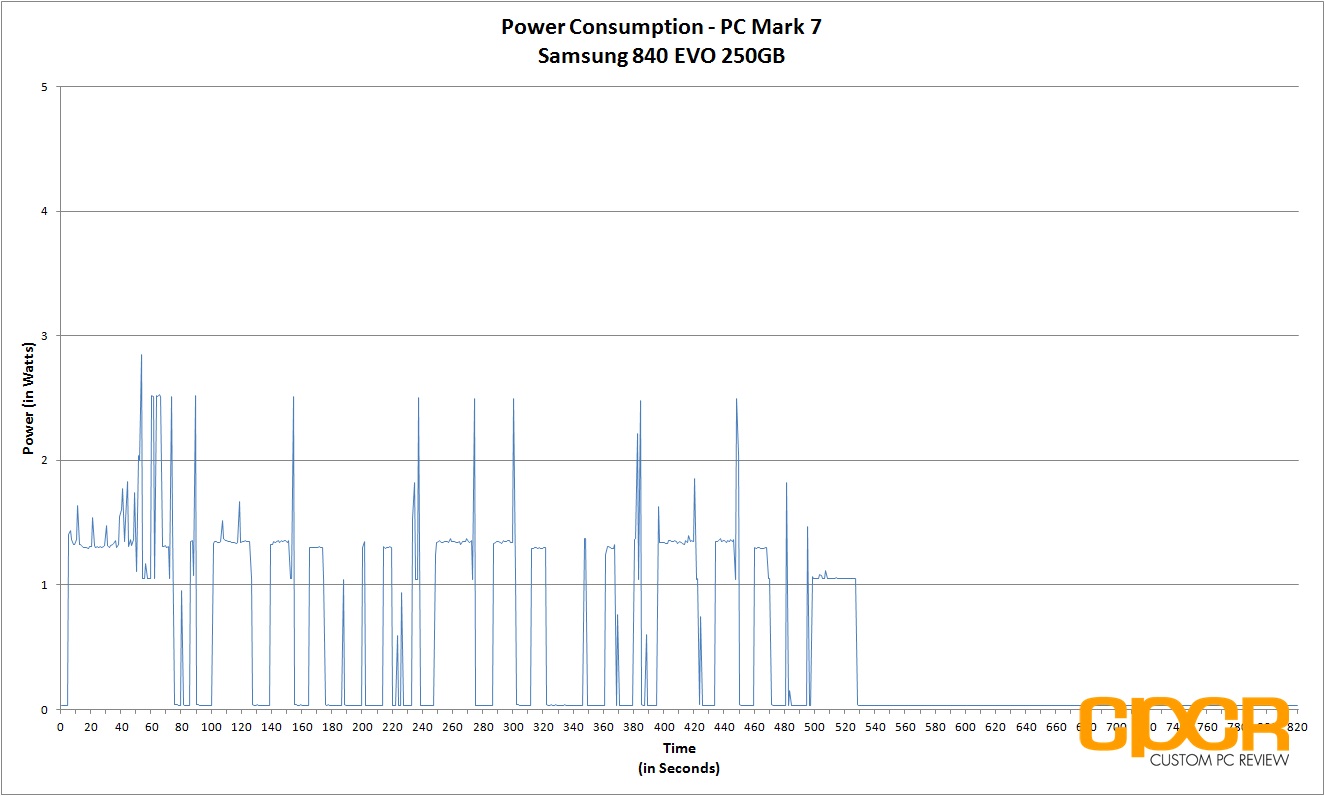
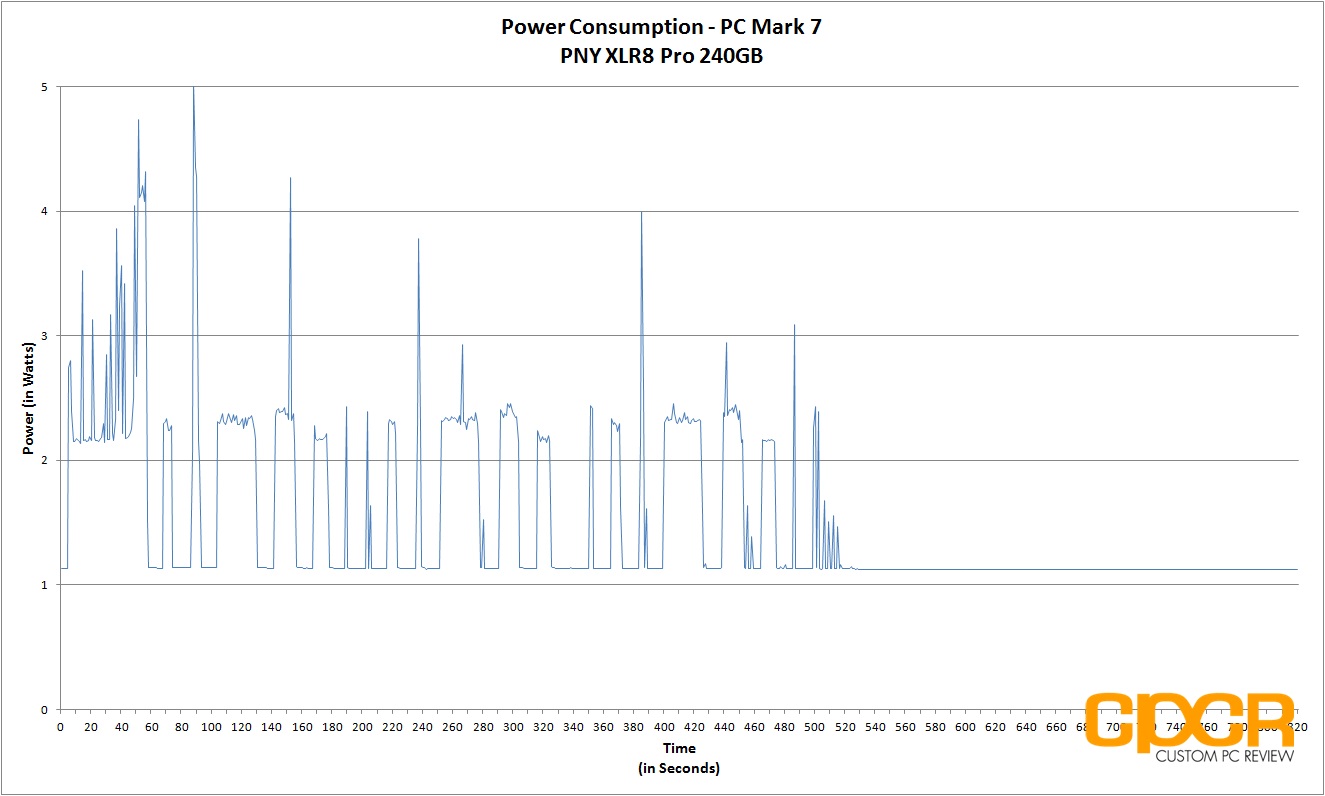
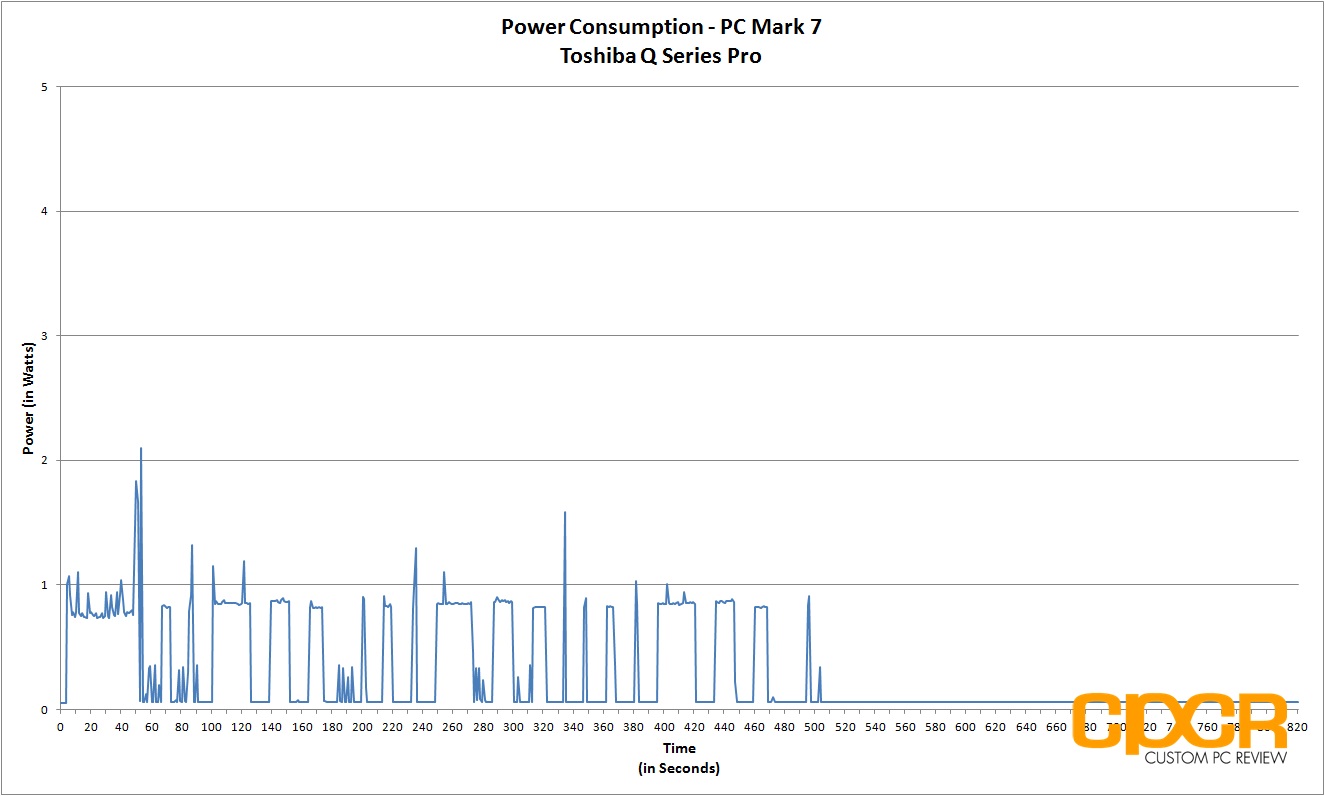
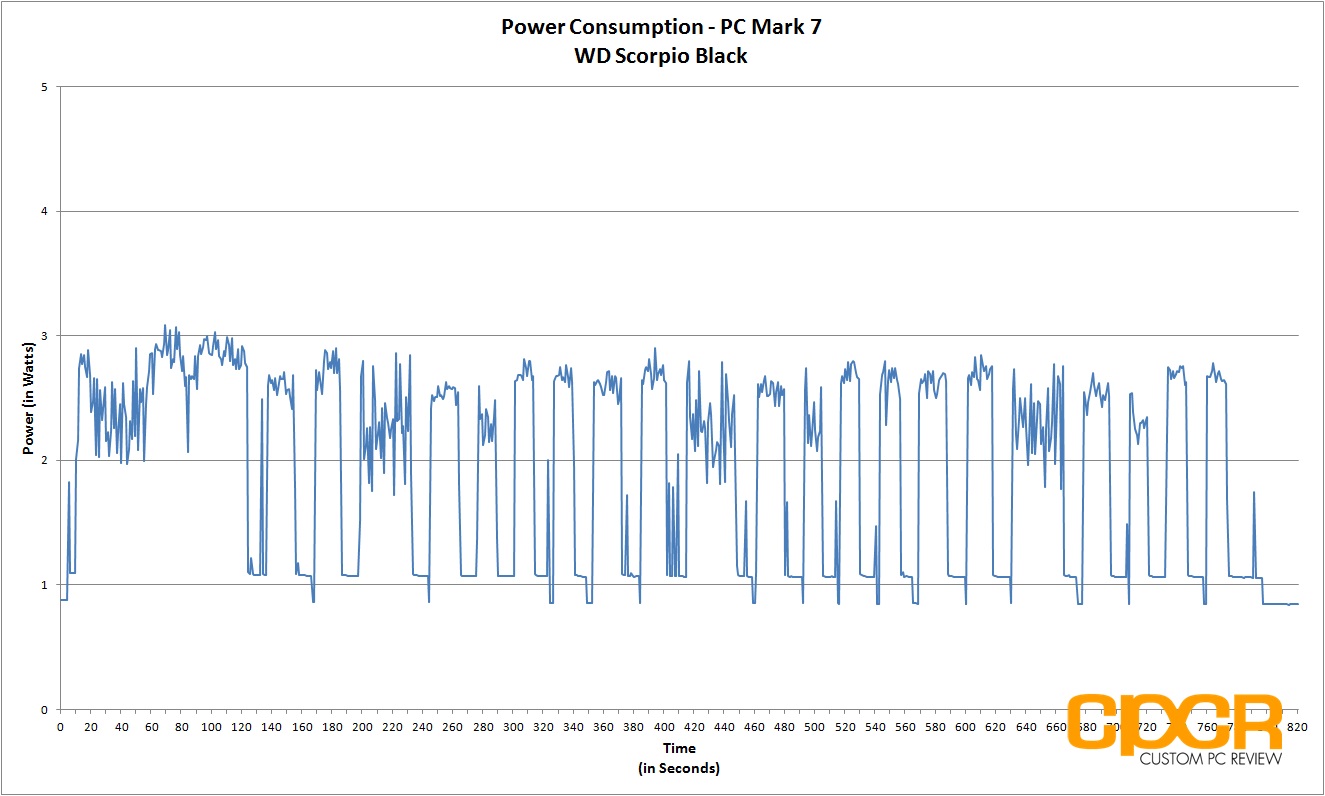
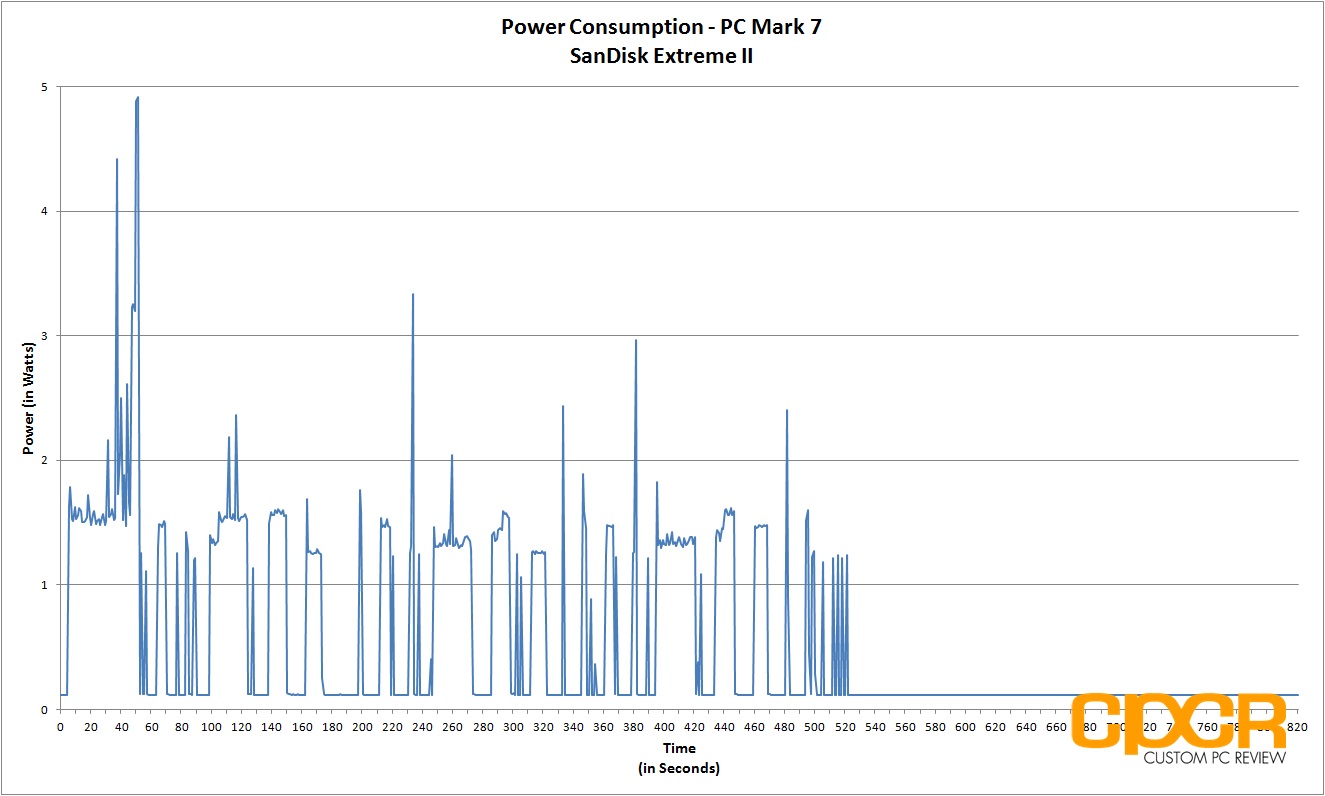
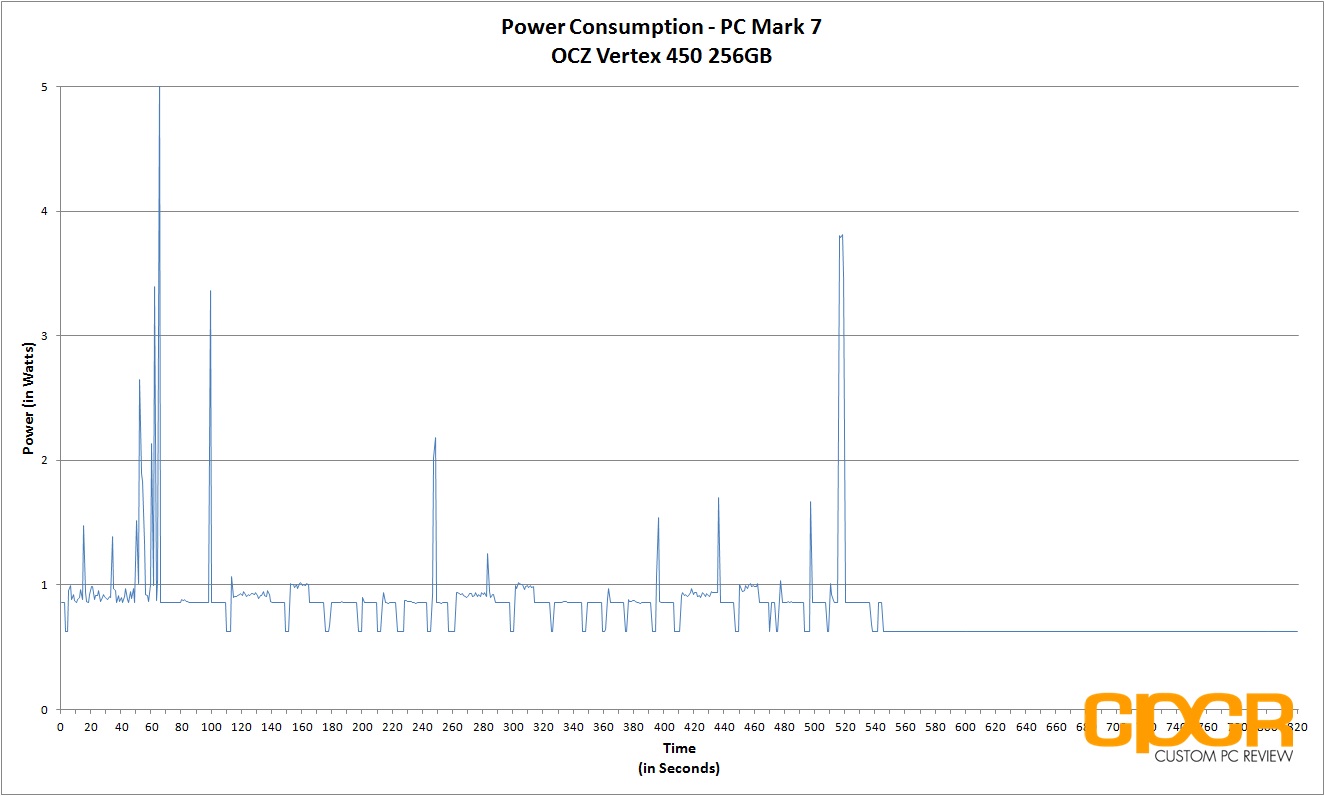
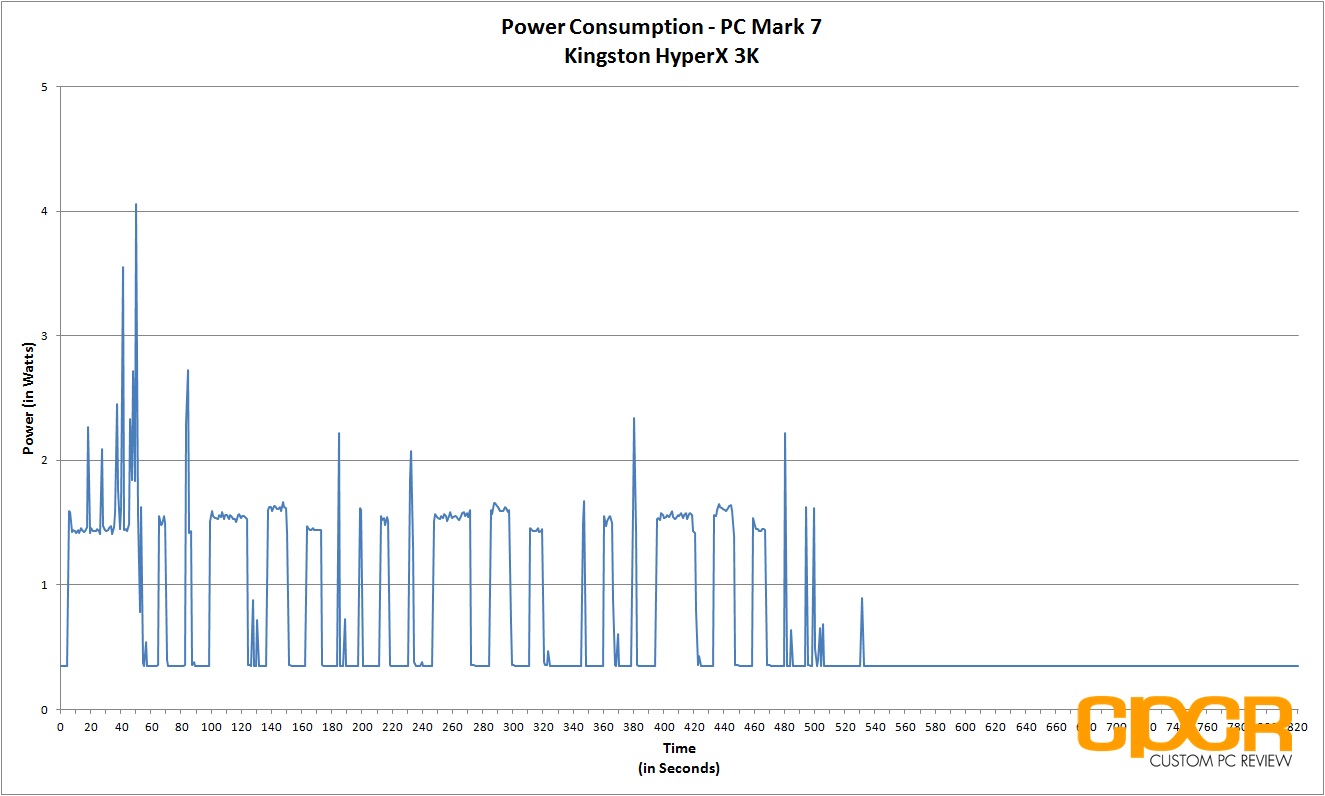
Previously, our power consumption analysis only tested for idle and maximum load power consumption, but we felt that this was a bad way to accurately measure power consumption. The reason for this is because SSDs tend to be bursty while in operation and will spike in power usage, but only for very short periods of time. As such, many of our SSDs appeared to have even higher power consumption than traditional hard drives, which is untrue.
In order to better represent a drive’s power consumption, our solution was to run a test closer to the real-world and record a trace of the exact power consumption during testing. Since PC Mark 7 has been recognized by the industry as a fantastic real-world benchmark, we’ll be recording the drive’s power consumption while running the benchmark.
All tests below are measured by our B&K Precision 5491B Bench Multimeter tapped directly into the 5v line running from the power supply to the drive. All testing here is conducted with “HIPM (Host Initiated Power Management)/DIPM (Device Initiated Power Management)” enabled and “AHCI Link Power Management – Adaptive” set to 0 milliseconds for maximum power efficiency.
[tabgroup]
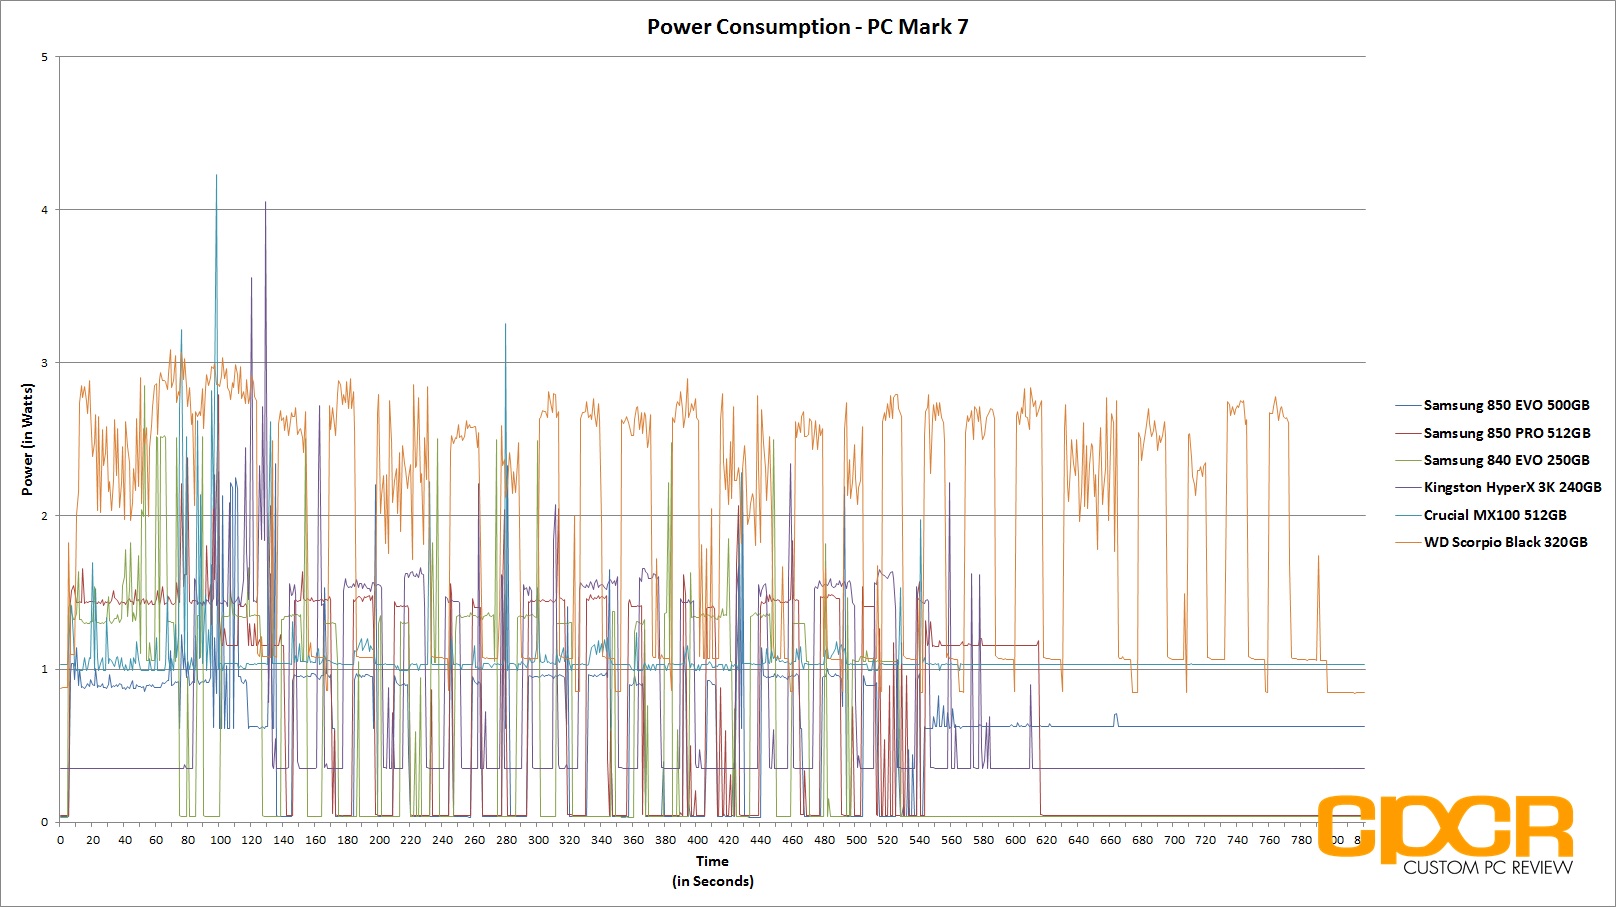
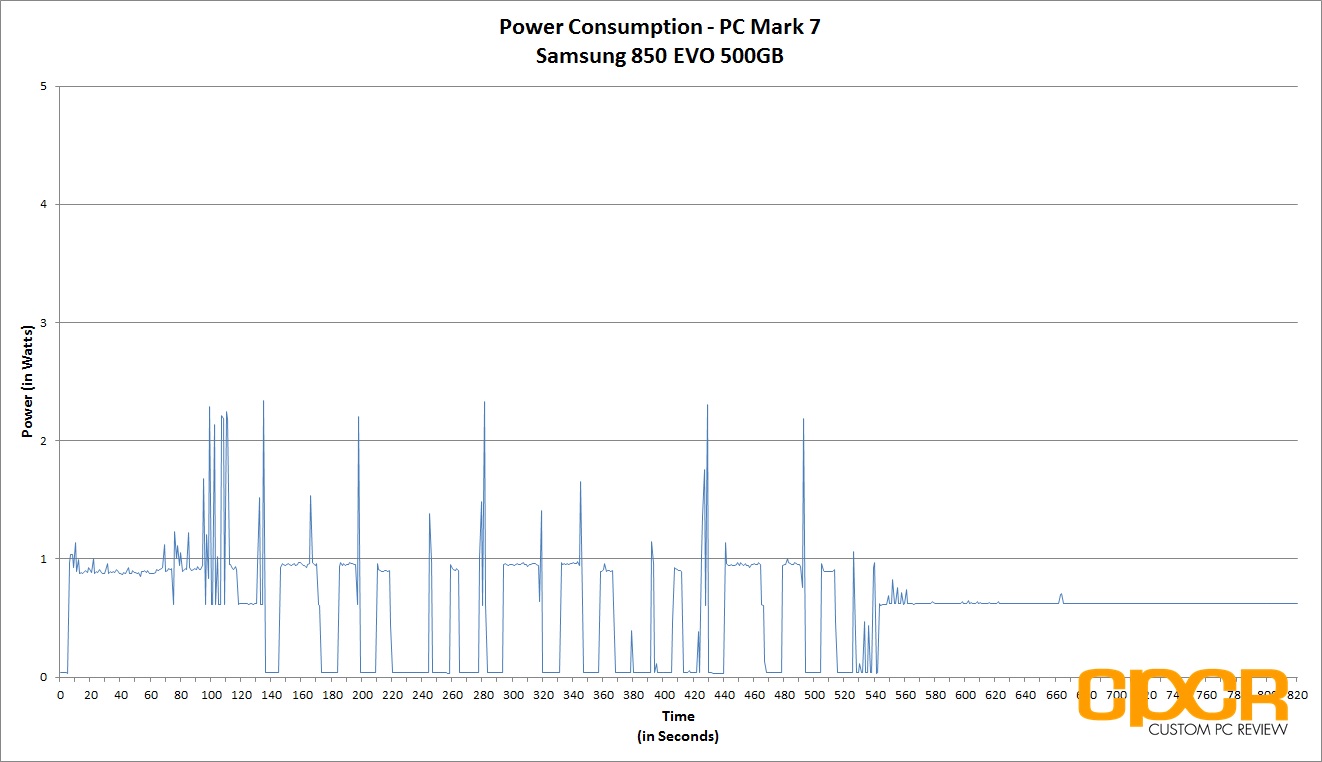

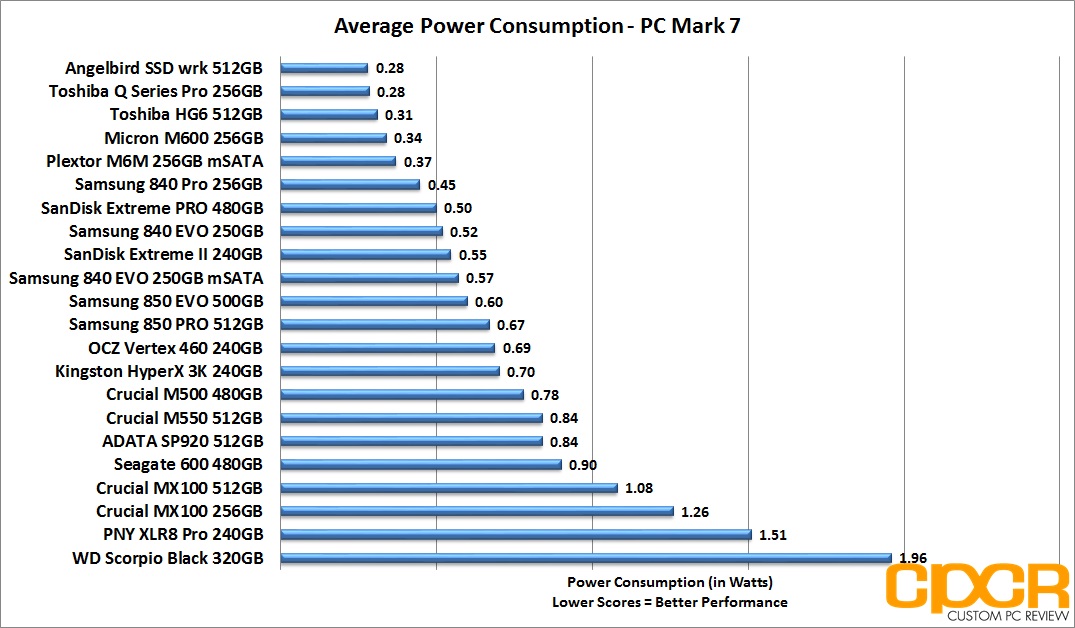
Performance Analysis
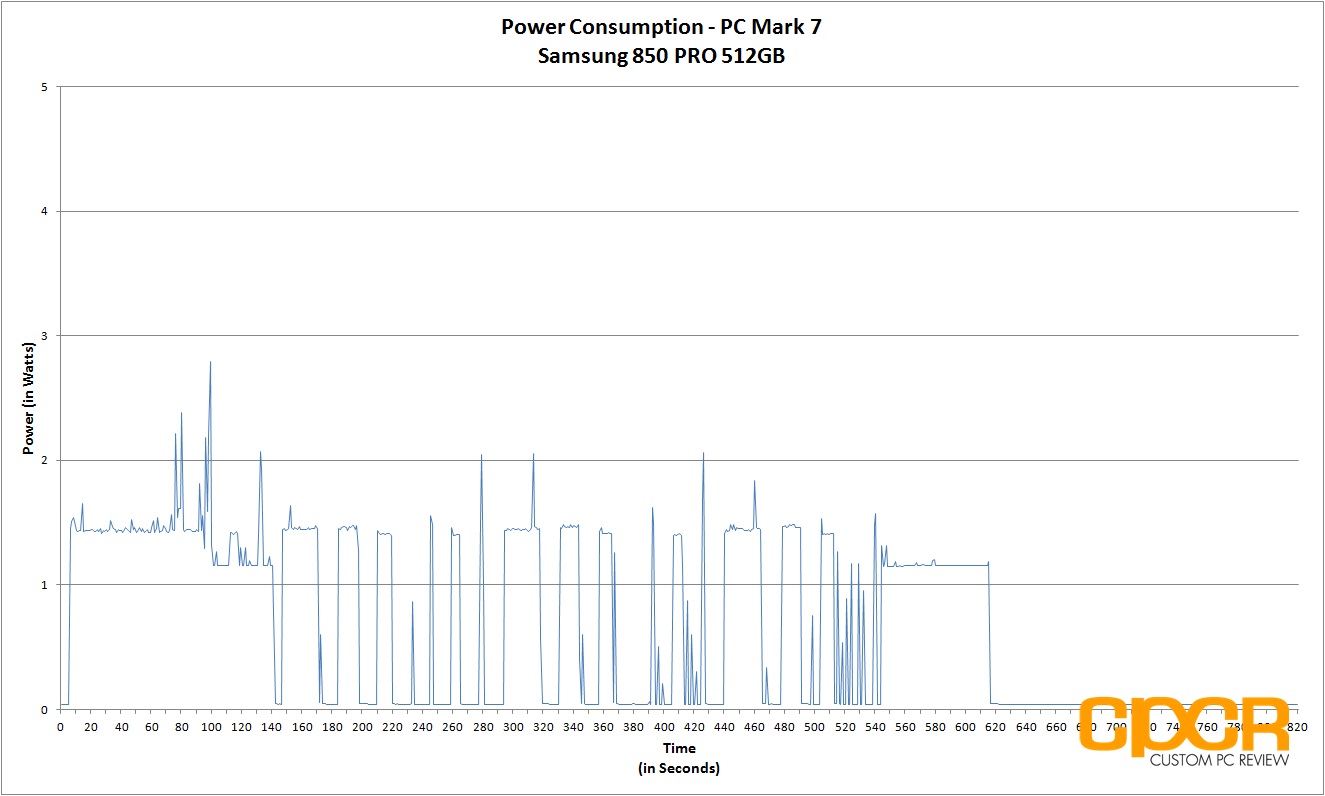
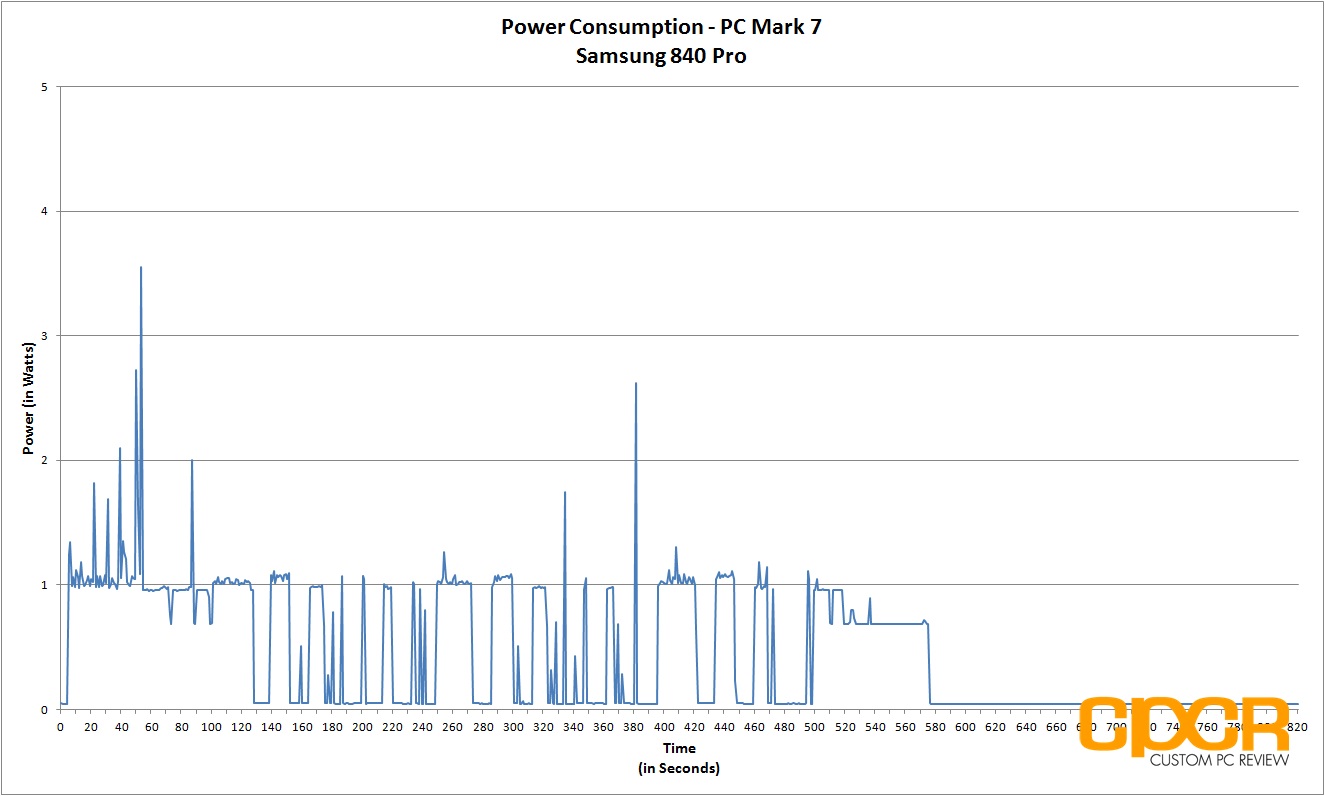
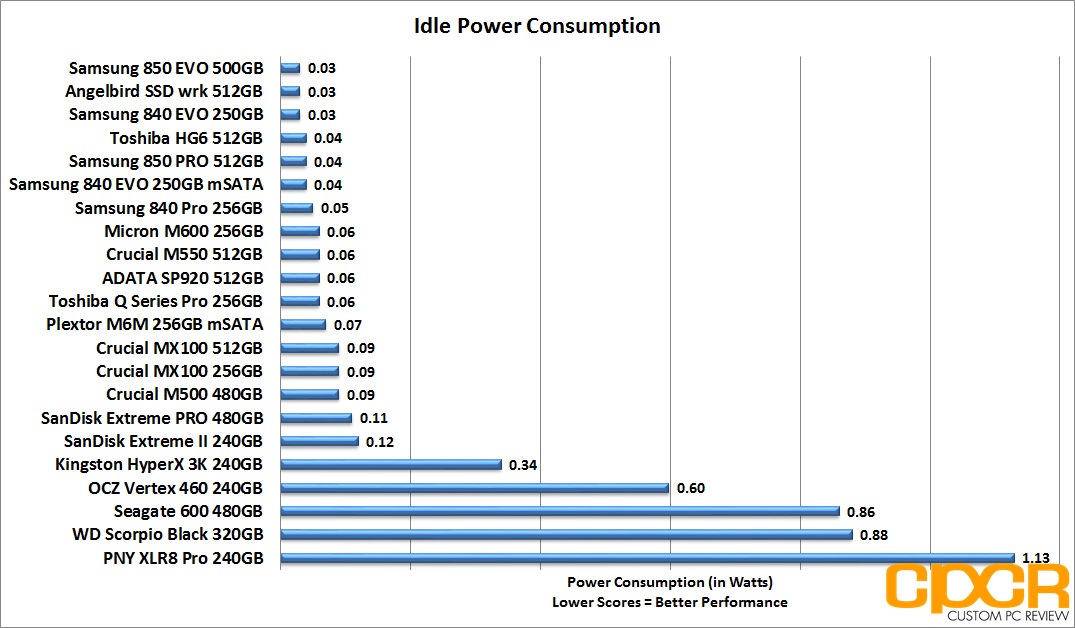
According to Samsung, the 850 EVO’s TLC 3D V-NAND requires only half the power required of 2D planar NAND and the drive itself can save up to 30% more power than its predecessor, the Samsung 840 EVO. Unfortunately, this was not reflected in testing as active idle power consumption was comparable to the Samsung 840 EVO at 0.03w, but average power consumption during our PC Mark 7 benchmarking run was slightly worse for the Samsung 850 EVO which averaged 0.60w versus the Samsung 840 EVO’s 0.52w.
We’re not quite sure why this is the case, but looking at the power consumption trace for the Samsung 850 EVO, it appears that the drive spends a considerable amount of time in a slightly higher power state after write operations end most likely for drive maintenance. When compared to the power consumption trace of the Samsung 850 PRO, both drives exhibit the same behavior, which may be due to something like a new garbage collection routine. That said, despite the slightly lower power efficiency compared to the Samsung 840 EVO, the Samsung 850 EVO (and the Samsung 850 PRO for that matter) is still one of the most power efficient drives with one of the lowest idle power consumption numbers we’ve seen to date.
[section label=12. TurboWrite & RAPID Revisited]
TurboWrite Revisited
Along with the introduction of the Samsung 840 EVO, Samsung also introduced TurboWrite technology, which was originally designed to help improve the Samsung 840 EVO’s write performance. By taking a small amount of TLC NAND and re-purposing it as a SLC cache, the Samsung 840 EVO was able to lessen the write performance hit from using inherently slower TLC NAND and denser 128Gb NAND dies (with the smaller capacity drives).
| Manufacturer | Samsung | Samsung | Samsung | Samsung |
|---|---|---|---|---|
| Model | 850 EVO | 850 EVO | 850 EVO | 850 EVO |
| Capacity | 120 GB | 250 GB | 500 GB | 1 TB |
| TurboWrite Buffer Size | 3GB | 3GB | 6GB | 12GB |
| Sequential Write Performance | 520MB/s (150MB/s) | 520MB/s (300MB/s) | 520MB/s (500MB/s) | 520MB/s (520MB/s) |
| 4K Write Performance (QD32) | 88,000 (38,000) | 88,000 (70,000) | 90,000 (80,000) | 90,000 (80,000) |
* (_____) signifies performance after TurboWrite
In the Samsung 850 EVO, Samsung has kept TurboWrite technology which once again greatly helps the performance of the smaller capacity drives. The 120GB Samsung 850 EVO for example gets the biggest benefit from TurboWrite as it gets a TurboWrite performance of up to 520MB/s sequential writes and 88,000 IOPS 4K random writes. After TurboWrite, that number drops down to 150MB/s sequential writes and 38,000 IOPS 4K random writes. Similarly, the Samsung 850 EVO 250GB gets a TurboWrite performance of 520MB/s sequential writes and 88,000 IOPS 4K random reads while after TurboWrite, that number drops down to 300MB/s sequential writes and 70,000 IOPS 4K random write.
Since we received the Samsung 850 EVO 500GB model, we don’t really get a huge benefit from having TurboWrite. TurboWrite performance on the Samsung 850 EVO 500GB is 520MB/s sequential writes and 90,000 IOPS 4K random writes, however, the after TurboWrite performance is still a respectable 500MB/s sequential writes and 80,000 IOPS 4K random writes.
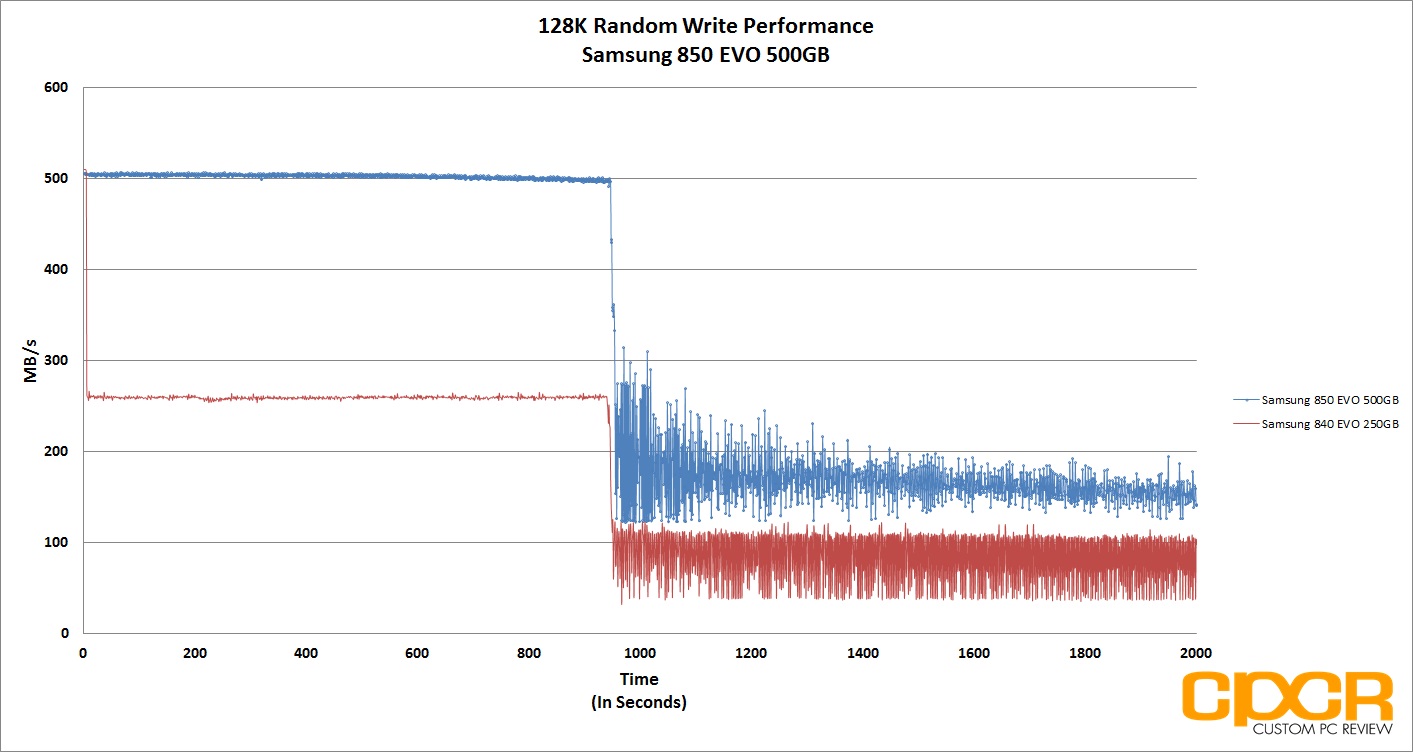
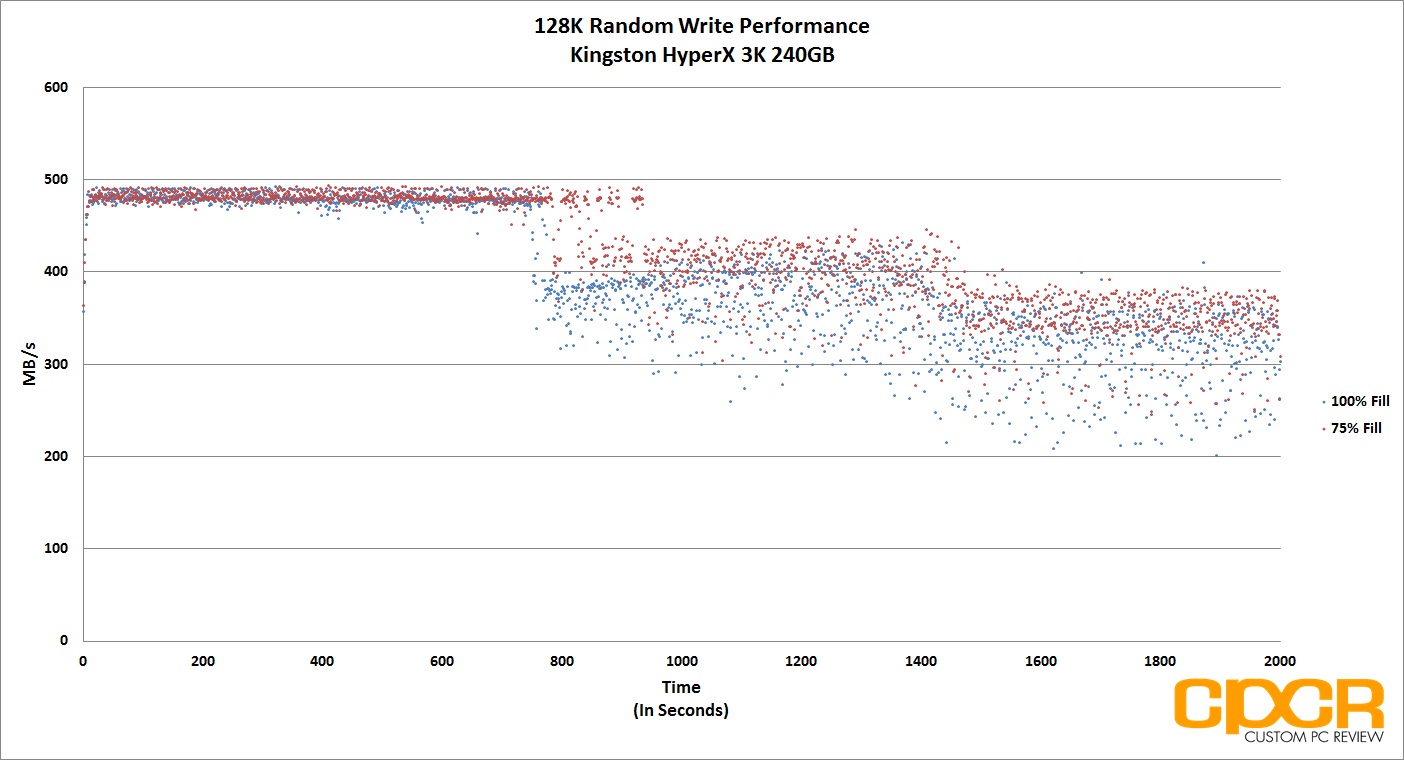
Above we have both the Samsung 850 EVO 500GB and the Samsung 840 EVO 250GB running 128K random writes with zero pre-conditioning. On the Samsung 850 EVO 500GB, there’s very little loss of performance until the drive gets filled with data and there’s very little difference between TurboWrite and after TurboWrite performance. On the older and more importantly lower capacity Samsung 840 EVO however, there’s a significant drop in performance after just a couple seconds of high performance writes which signifies that the drive is in after TurboWrite mode. Similarly, this is what I expect from the Samsung 850 EVO 120GB and 250GB drives as well although I didn’t get a chance to actually test either of those drives.
RAPID Mode Revisited
Among the many benefits of having a Samsung SSD (840 PRO or newer) is access to RAPID, or Real Time Acceleration Processing of I/O Data, mode. For those unfamiliar with RAPID mode, RAPID mode is a real time, seamless caching software that automatically re-purposes fast, unused system memory as a cache for the SSD.
When Samsung launched the Samsung 850 PRO earlier this year, they also introduced a new version of their Samsung Magician software suite, Samsung Magician 4.4, which upgraded RAPID mode to version 2.0. This increased the maximum cache size to 4GB total system memory for systems with 16GB or more of system memory. After that, with the introduction of Samsung Magician 4.5, Samsung further upgraded RAPID mode to version 2.1 which further improved error handling and fixed some compatibility issues with IRST (Intel Rapid Storage Technology).
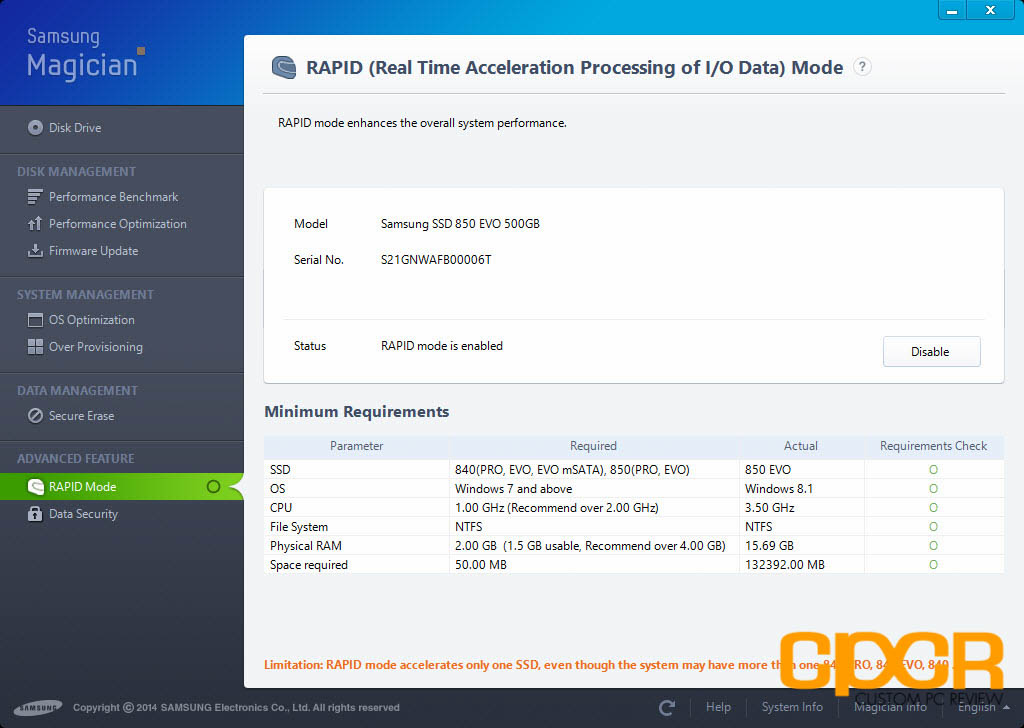
The beauty of RAPID mode is that enabling it literally just requires a push of a button.
Crystal Disk Mark 3.0.1. x64
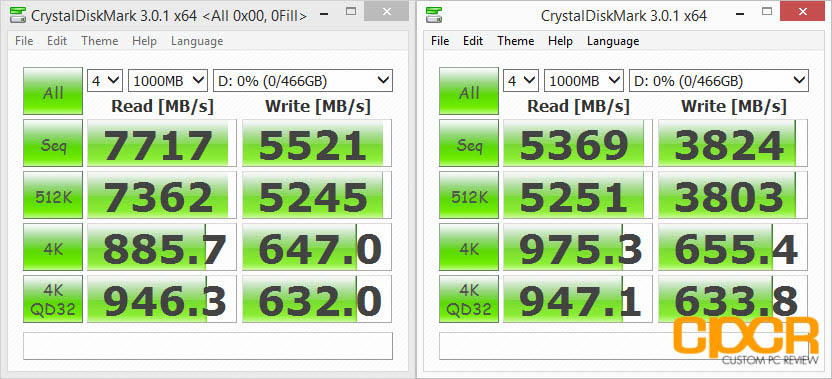
Performance Analysis
As we’ve seen from testing in prior reviews, RAPID mode is a very amazing piece of software. After enabling RAPID mode on the Samsung 850 EVO, the drive was pushing almost ~8GB/s sequential reads and ~5GB/s sequential writes. 4K random read/write performance was equally mindblowing as well with the drive pushing almost ~1,000MB/s reads and ~700MB/s writes.
PC Mark 8 Expanded Storage Benchmark
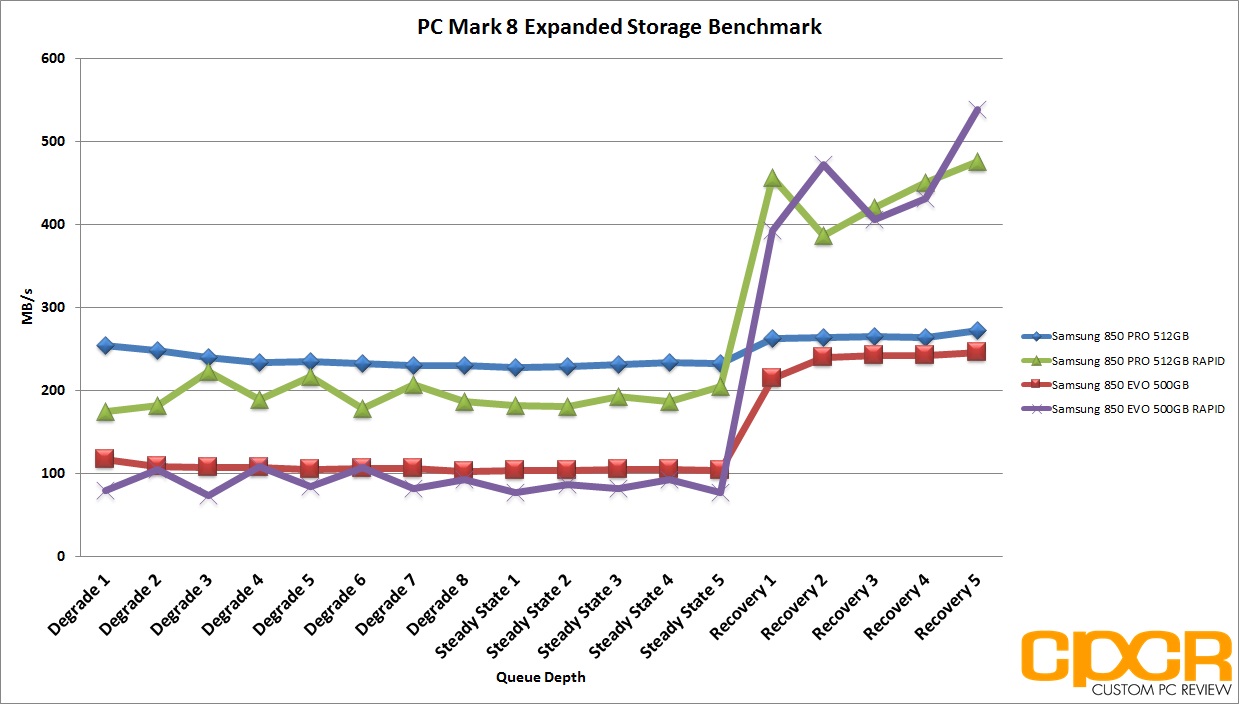
Performance Analysis
Using PC Mark 8’s Expanded Storage Benchmark, we can get a more in depth look at how RAPID mode works and where its shortcomings lie. Above, we can see that the Samsung 850 EVO’s performance without RAPID mode is better during times where there’s a heavy, relatively random load being placed on the drive. During this time, RAPID mode is attempting to figure out how to cache the data coming through, but with the data constantly changing, RAPID mode is actually slowing the storage sub-system down. However, as the data being accessed becomes more and more similar (and consequently easier to cache) such as during the five recovery phases, RAPID mode is able to cache the data quite effectively, leading to the massive performance boost we’ve come to expect from RAPID mode.
[section label=13. Conclusion]
Samsung 850 EVO 500GB Conclusions
 With the release of the Samsung 850 EVO, Samsung is now completely 3D V-NAND across the board for consumer SSDs which makes them a very serious force to be reckoned with. Against competitors, Samsung’s NAND technology is not only superior in performance and endurance, but it’s also at least 6-12 months ahead of everyone else, which will probably force the rest of the NAND vendors to accelerate development of their own 3D NAND product. Even if most competitors could catch up to Samsung NAND technology within the next 6-12 months, Samsung will likely be in their 3rd generation 3D V-NAND product by then with more layers, higher density and even lower cost. Samsung took a huge gamble by skipping a die shrink and jumping straight to 3D NAND, but their products will dominate 2015 and short of deep price cuts, there’s very little anyone else can do about it.
Speaking with Samsung representatives, I’ve also been told that 2TB capacities are entirely possible even with current technology however, they didn’t launch a 2TB Samsung 850 EVO because they believe that the cost is still a bit too high for mass consumer adoption. By the 3Q2015 however, it’s entirely possible that 2TB client SSDs using 256Gb, 384Gb or even denser NAND dies could hit store shelves which should start to make things a bit worrisome for harddrive vendors as well.
As for the Samsung 850 EVO, personally I see it being the best mainstream drive on the market at least until 2H2015. It has everything most consumers would want or need from a SSD and personally I don’t foresee any SSD vendor producing a comparable product until then. Performance on the drive is a very good for a mainstream drive and among its competitors, it’s the fastest we’ve tested. Fresh out of the box, the performance is faster than a number of enthusiast SSDs and only in heavy, punishing workloads does the drive really show any weakness. Even then, the Samsung 850 EVO has shown an incredible ability to quickly recover performance through its internal drive maintenance algorithms. As seen in PC Mark 8’s Expanded Storage Benchmark, as soon as the 850 EVO is allowed a bit of time to perform its internal garbage collection routines, performance is back up very quickly.
Of course, performance isn’t the whole picture when it comes to the Samsung 850 EVO and Samsung’s newer client drives in general as they’re also packed with features that are unavailable from most competitors. The biggest draw is probably Samsung’s Magician software suite which is currently the most full featured, easy to use software suite available from any SSD manufacturer. Included within Magician is RAPID mode, which depending on how routine your specific workload is, could greatly help improve user experience. Along with Samsung Magician is also Samsung’s Data Migration software as well which can help users easily switch from an existing drive to the Samsung 850 EVO. Finally, the Samsung 850 EVO also features a full set of hardware accelerated encryption features which includes TCG Opal 2.0 and IEEE-1667 which will be useful for business users and enthusiasts looking to keep their data safe without suffering the performance penalty typically associated with software encryption.
As for power efficiency, the Samsung 850 EVO scores high marks here as well with idle active power efficiency being one of the lowest we’ve seen for any SSD on the market at a mere 0.03w. Average active power consumption during our PC Mark 7 benchmarking run however, wasn’t as efficient falling slightly short of the Samsung 840 EVO, but is still fairly efficient overall especially since most client drives generally tend to spend most of their time in the idle state.
| Manufacturer | Samsung | Samsung | Samsung | Samsung |
|---|---|---|---|---|
| Model | 850 EVO | 850 EVO | 850 EVO | 850 EVO |
| SKU | MZ-75E120B/AM | MZ-75E250B/AM | MZ-75E500B/AM | MZ-75E1T0B/AM |
| Capacity | 120 GB | 250 GB | 500 GB | 1 TB |
| MSRP | $99.99 | $149.99 | $269.99 | $499.99 |
| Price/GB | ~$0.83 | ~$0.60 | ~$0.54 | ~$0.50 |
| Check Price | Click Here | Click Here | Click Here | Click Here |
MSRP pricing on the Samsung 850 EVO is expected to be unchanged from the launch prices of the Samsung 840 EVO, so $99.99 for the 120GB drive ($~0.83/GB), $149.99 for the 250GB drive (~$0.60/GB), $269.99 for the 500GB drive (~$0.54/GB) and $499.99 for the 1TB drive (~$0.50/GB). As usual, prices should be slightly lower once production ramps and inventory stabilizes, so I’d definitely expect prices to drop at least down to the ~$0.42/GB range in the coming months. As far as availability goes, we haven’t gotten any specifics, but we’ll keep you updated as we learn more. Samsung does however expect to see these drives on retail shelves by the end of the month.
All things considered, the Samsung 850 EVO is the best mainstream SSD on the market today offering superior technology, superior performance, superior features, superior software, and a superior warranty that’s unmatched by the competition. If you’ve been waiting on a SSD that offers the perfect blend of performance, features and reliability at an affordable price, the Samsung 850 EVO is it. Highly recommended!

Sample provided by: Samsung
Availability: Coming soon!
**Update 12/10/14 – According to Amazon, the Samsung 850 EVO will be available on December 26, 2014. Pre-orders are available now.
