[section label=1. Introduction]
Same Great 840 EVO, Now in mSATA
 Several months ago at the 2013 Samsung Global SSD Summit, Samsung unveiled their latest and greatest SSD, the Samsung 840 EVO. Based off a brand new MEX controller and Samsung’s latest 19nm TLC Toggle Mode 2.0 NAND, it quickly became one of the most successful consumer SSDs on the market due to its great performance, competitive pricing, and proven Samsung reliability.
Now I’d have to say ever since the release of the Samsung 840 EVO back in July, I’ve been expecting a mSATA form factor version of the 840 EVO as well, at least on the OEM side of things. When I reviewed the 250GB edition of the Samsung 840 EVO, I noticed that it had a very small PCB, about the size of a mSATA SSD, with only two NAND packages onboard. Given that Samsung already produces a mSATA PM840 SSD based on the 840 Pro, it was logical that an 840 EVO based SSD in the mSATA form factor would arrive, especially since the SATA version’s PCB is already about the size of a mSATA SSD anyway.
Fast forward five months after the initial launch of the 840 EVO and Samsung is now launching the Samsung 840 EVO mSATA SSD. I expected Samsung to introduce a 120GB, 240GB, and 500GB mSATA 840 EVO, but what I didn’t expect was a 1TB edition as well. Whereas the 120GB, 250GB, and 500GB 840 EVOs used four NAND packages or less, the 750GB and 1TB editions used eight packages, which wouldn’t normally fit into a mSATA PCB. This means that Samsung has figured out a way to fit 1TB of data into four tiny little NAND packages. That’s very impressive and it could mean some serious capacities down the line with 8, or even 16 of these high density NAND packages on a full sized 2.5″ SATA PCB.
Samsung 840 EVO mSATA Specifications
| Manufacturer | Samsung | Samsung | Samsung | Samsung |
|---|---|---|---|---|
| Model | 840 EVO | 840 EVO | 840 EVO | 840 EVO |
| Model Number | MZ-MTE120BW | MZ-MTE250BW | MZ-MTE500BW | MZ-MTE1T0BW |
| Form Factor | mSATA | mSATA | mSATA | mSATA |
| Capacity | 120 GB | 250 GB | 500 GB | 1000 GB (1TB) |
| Controller | Samsung MEX | Samsung MEX | Samsung MEX | Samsung MEX |
| NAND | 19nm Samsung Toggle 2.0 TLC | 19nm Samsung Toggle 2.0 TLC | 19nm Samsung Toggle 2.0 TLC | 19nm Samsung Toggle 2.0 TLC |
| Sequential Reads | 540MB/s | 540MB/s | 540MB/s | 540MB/s |
| Sequential Writes | 520MB/s | 520MB/s | 520MB/s | 520MB/s |
| 4K Random Read | 95,000 IOPS | 97,000 IOPS | 97,000 IOPS | 97,000 IOPS |
| 4K Random Write | 37,000 IOPS | 71,000 IOPS | 88,000 IOPS | 88,000 IOPS |
| Interface | SATA 3, 6GB/s | SATA 3, 6GB/s | SATA 3, 6GB/s | SATA 3, 6GB/s |
| Warranty | 3 Years | 3 Years | 3 Years | 3 Years |
From the specs, it looks like the Samsung 840 EVO mSATA is pretty much identical to the Samsung 840 EVO SATA. The 500GB/1TB editions will have the highest level of performance topping out at 540MB/s sequential reads and 520MB/s sequential writes with 4K reads/writes topping out at 97,000 and 88,000 IOPS respectively.
Our review today will be focused on the Samsung 840 EVO 250GB mSATA SSD. The Samsung 840 EVO 250GB mSATA is rated at up to 540MB/s sequential reads and 520MB/s sequential writes, which is identical to the maximum sequential read/write performance on the 500GB and 1TB models, but it does suffer a bit in 4K write performance, dropping to a maximum of 71,000 IOPS. In order to reach these lofty performance numbers on slower, more error prone 19nm 128Gb TLC NAND, Samsung is implementing TurboWrite technology, which we’ve covered in our review of the SATA based Samsung 840 EVO.
Let’s take a closer look!
[section label=2. A Closer Look]
A Closer Look at the Samsung 840 EVO 250GB mSATA
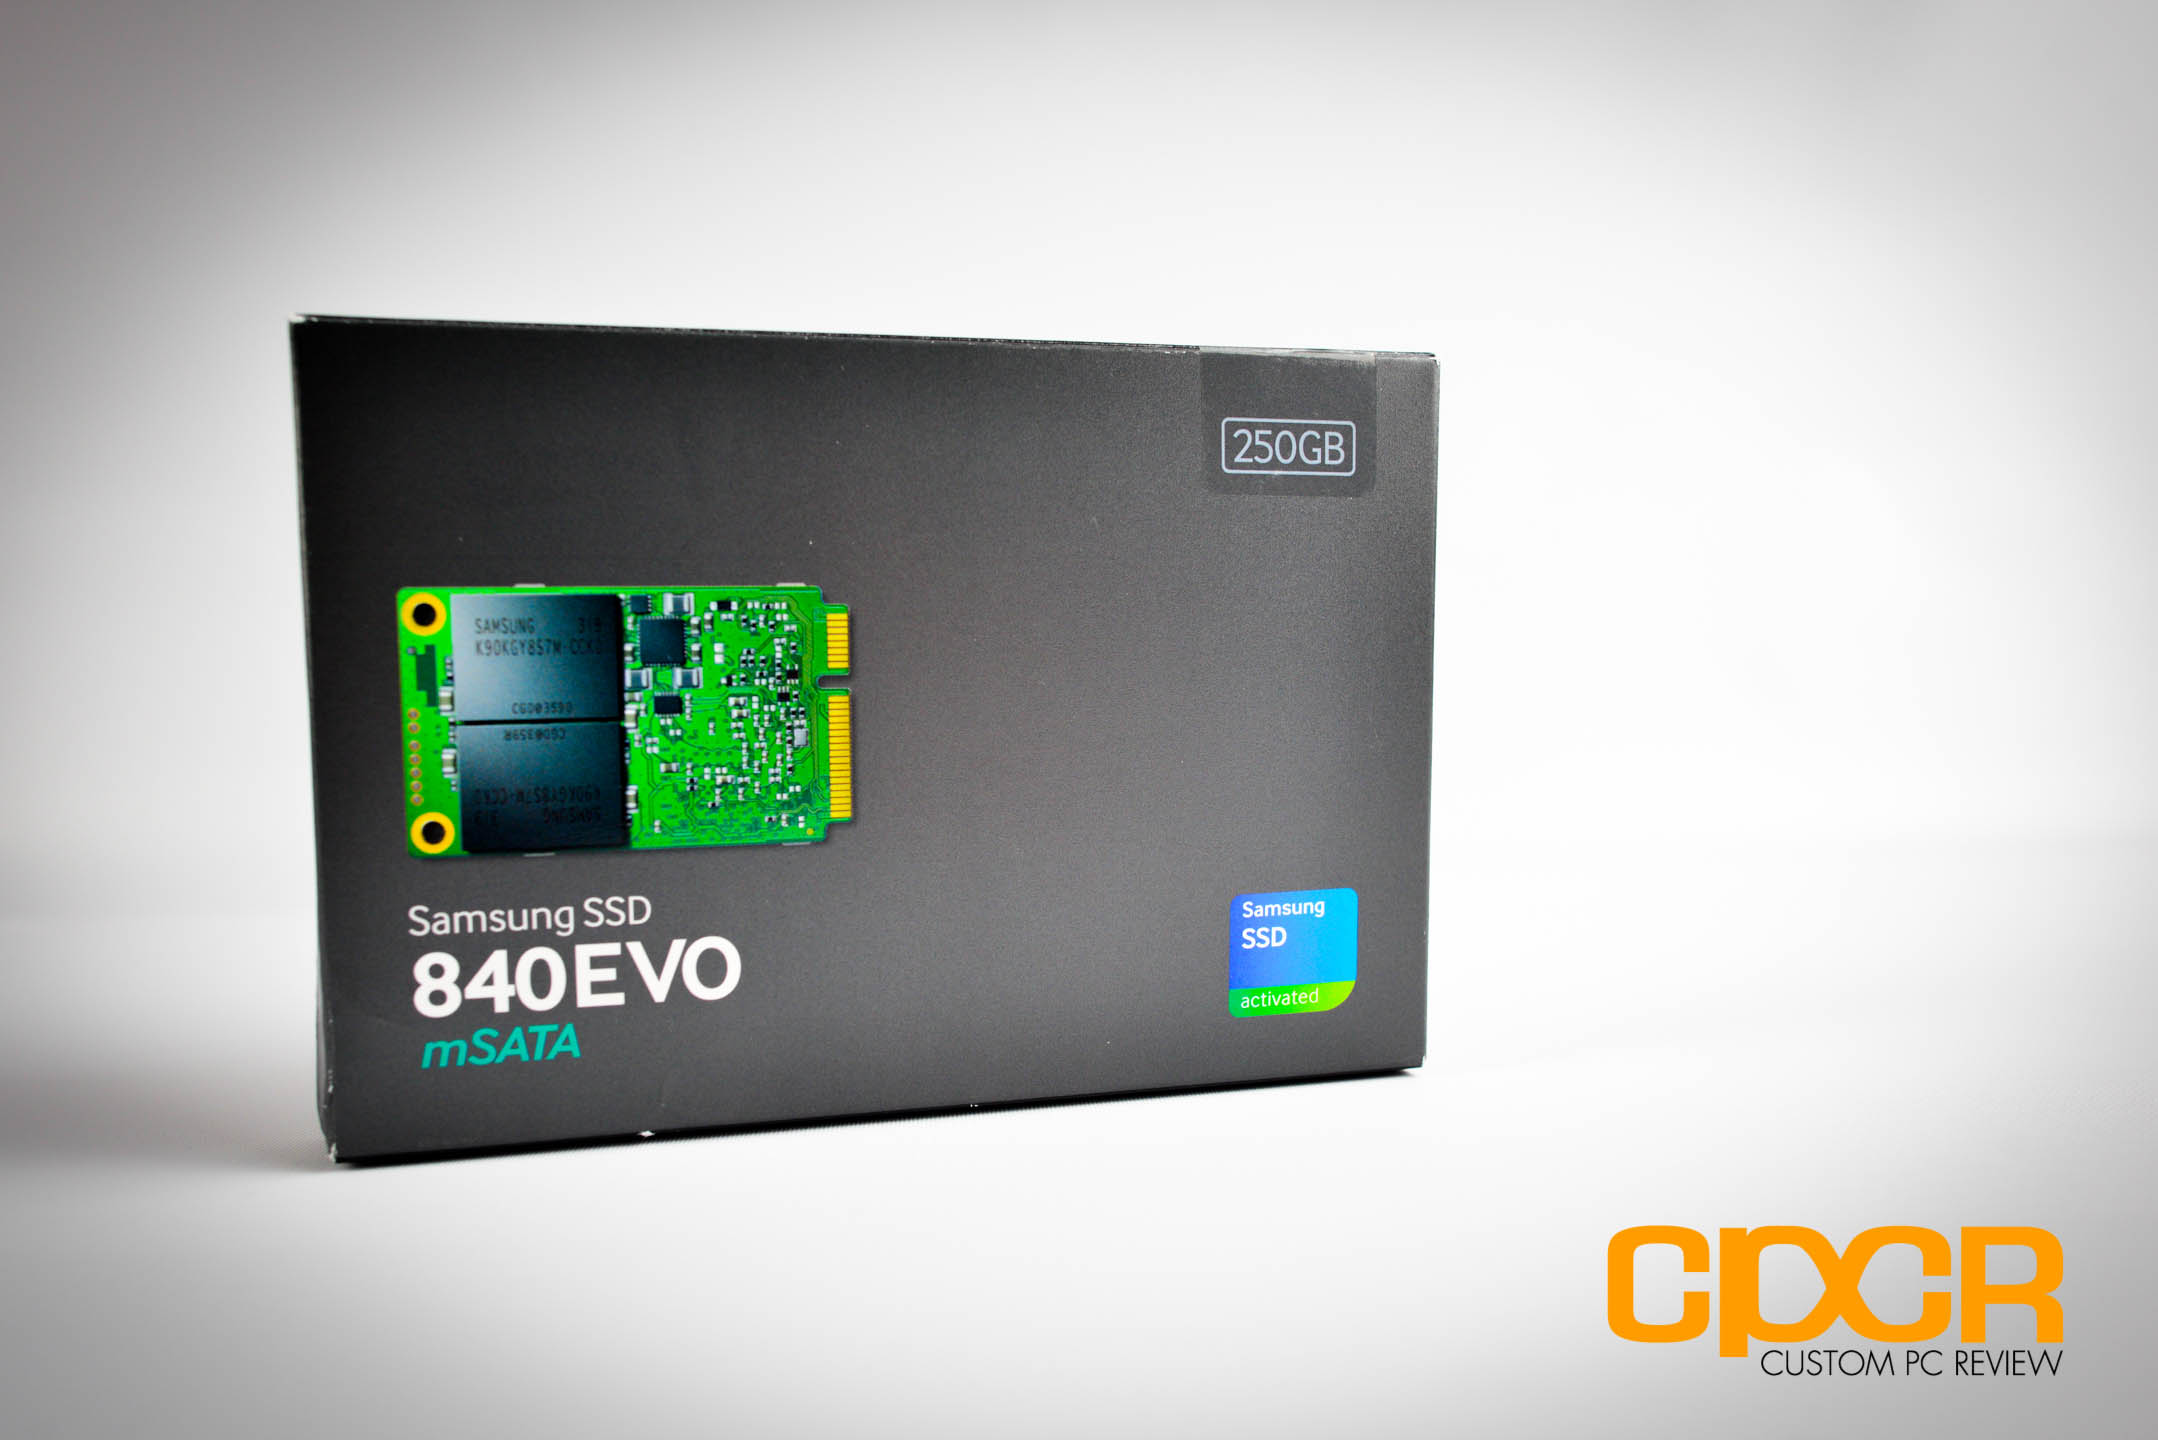
Here’s a look at the packaging for the Samsung 840 EVO mSATA. It’s a pretty big box considering the drive itself is exactly the same size as the drive pictured on the box. Then again, who cares?

The Samsung 840 EVO mSATA will only come in the bare drive form so it’s pretty light on the accessories. All you’ll get is the bare drive itself along with some documentation. That’s it.
There’s no data migration kits, no adapters, nothing, and as far as I know, there won’t be any options to get a kit either. The 840 EVO mSATA will support the Samsung Magician software suite along with Samsung’s Data Migration software, so if you can find a way to rig a mSATA adapter to your system you can still perform a data migration if absolutely necessary. At that point though, a fresh install is probably a better idea. If only OEMs would start shipping recovery disks with their systems… another discussion for another time.
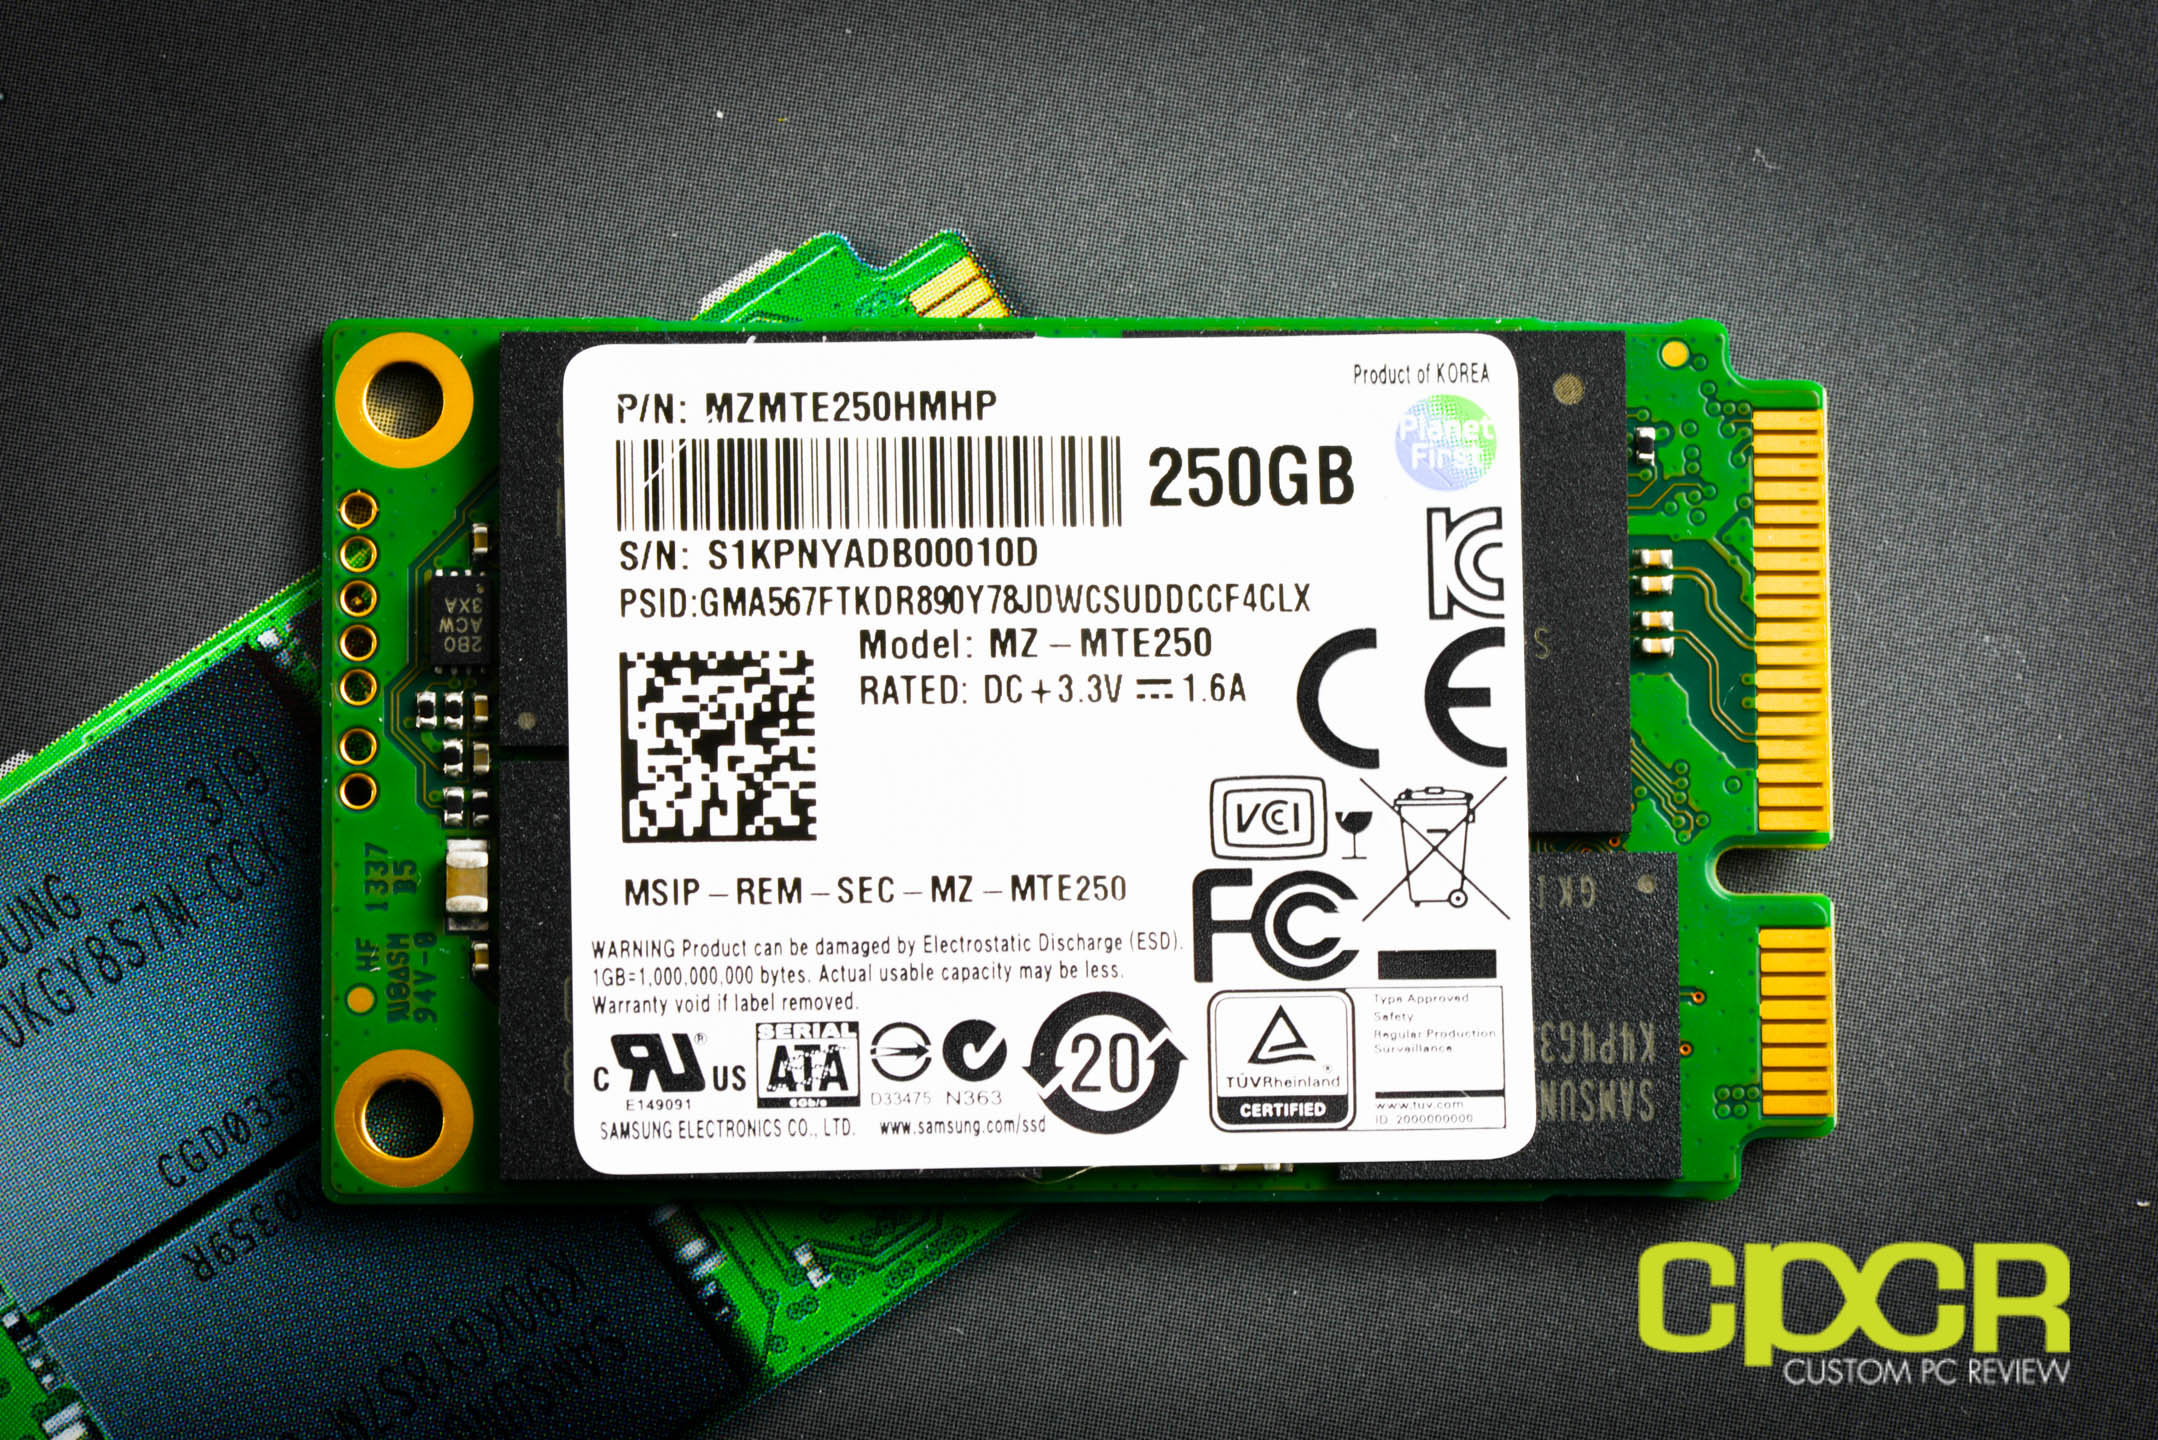
Here’s a closer look at the Samsung 840 EVO mSATA 250GB. There’s a large informational sticker that covers the top of the unit which contains all the important part numbers, specifications, serial numbers, etc. For our specific drive, the model # is MZ-MTE250, or part number MZMTE250HMHP.
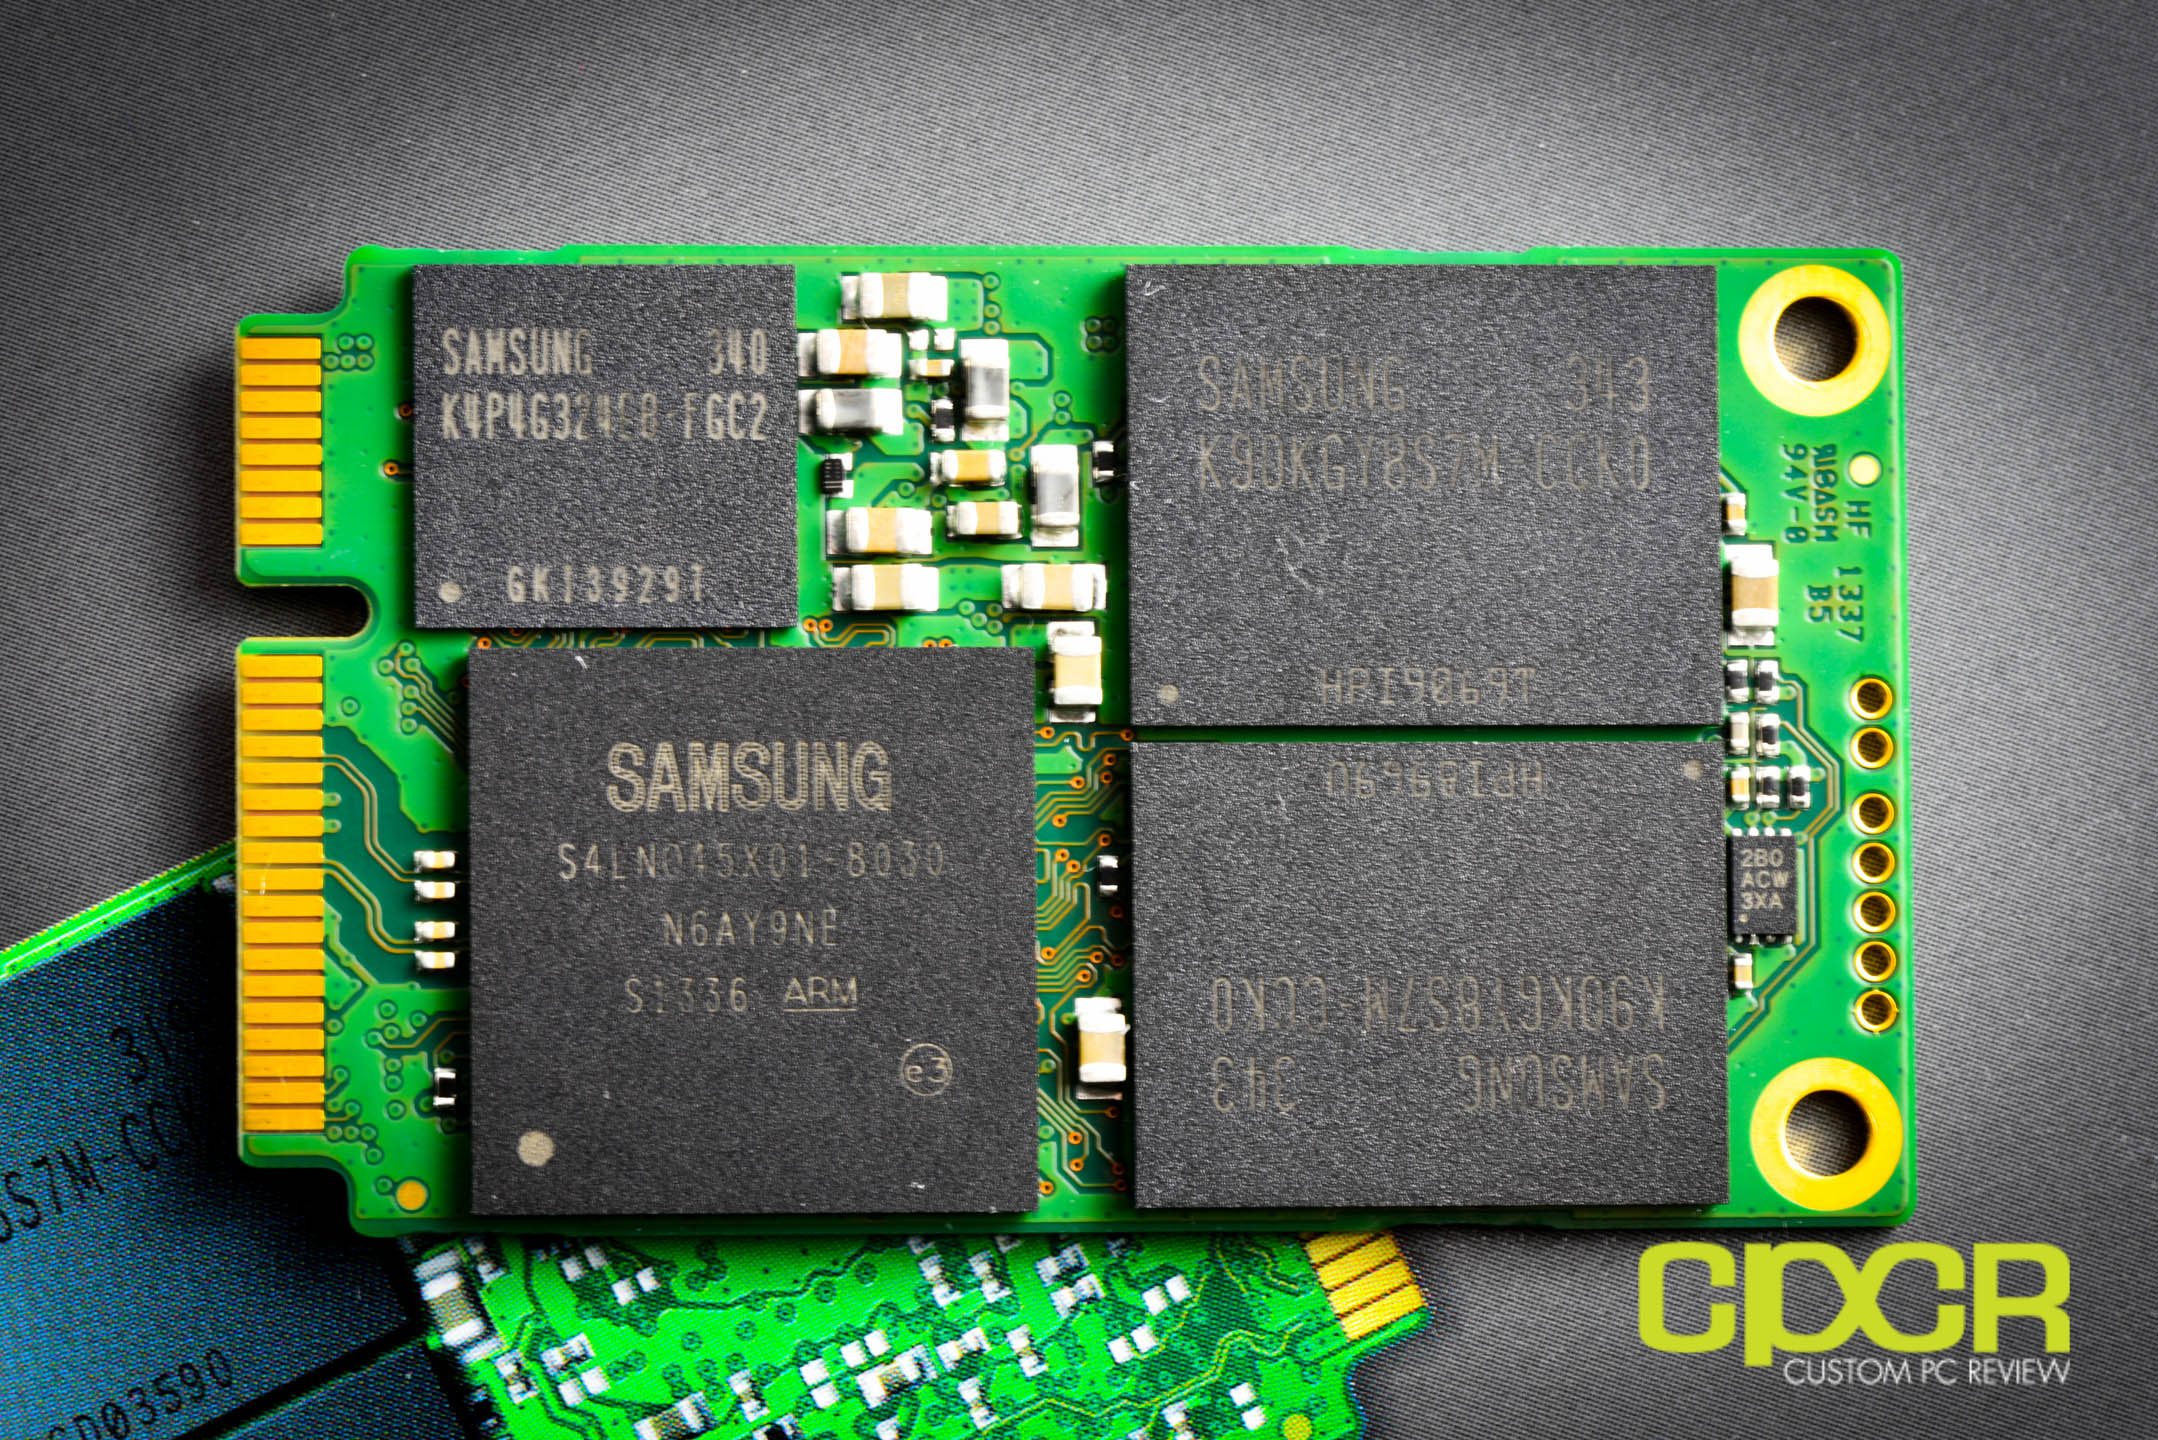
Removing the sticker, we can see that it’s designed to cover all the important components onboard. I’d advise you not to do this as it’ll probably void your warranty. Here we can see that the Samsung 840 EVO mSATA employs the use of a single controller, a DRAM cache, and two NAND packages.
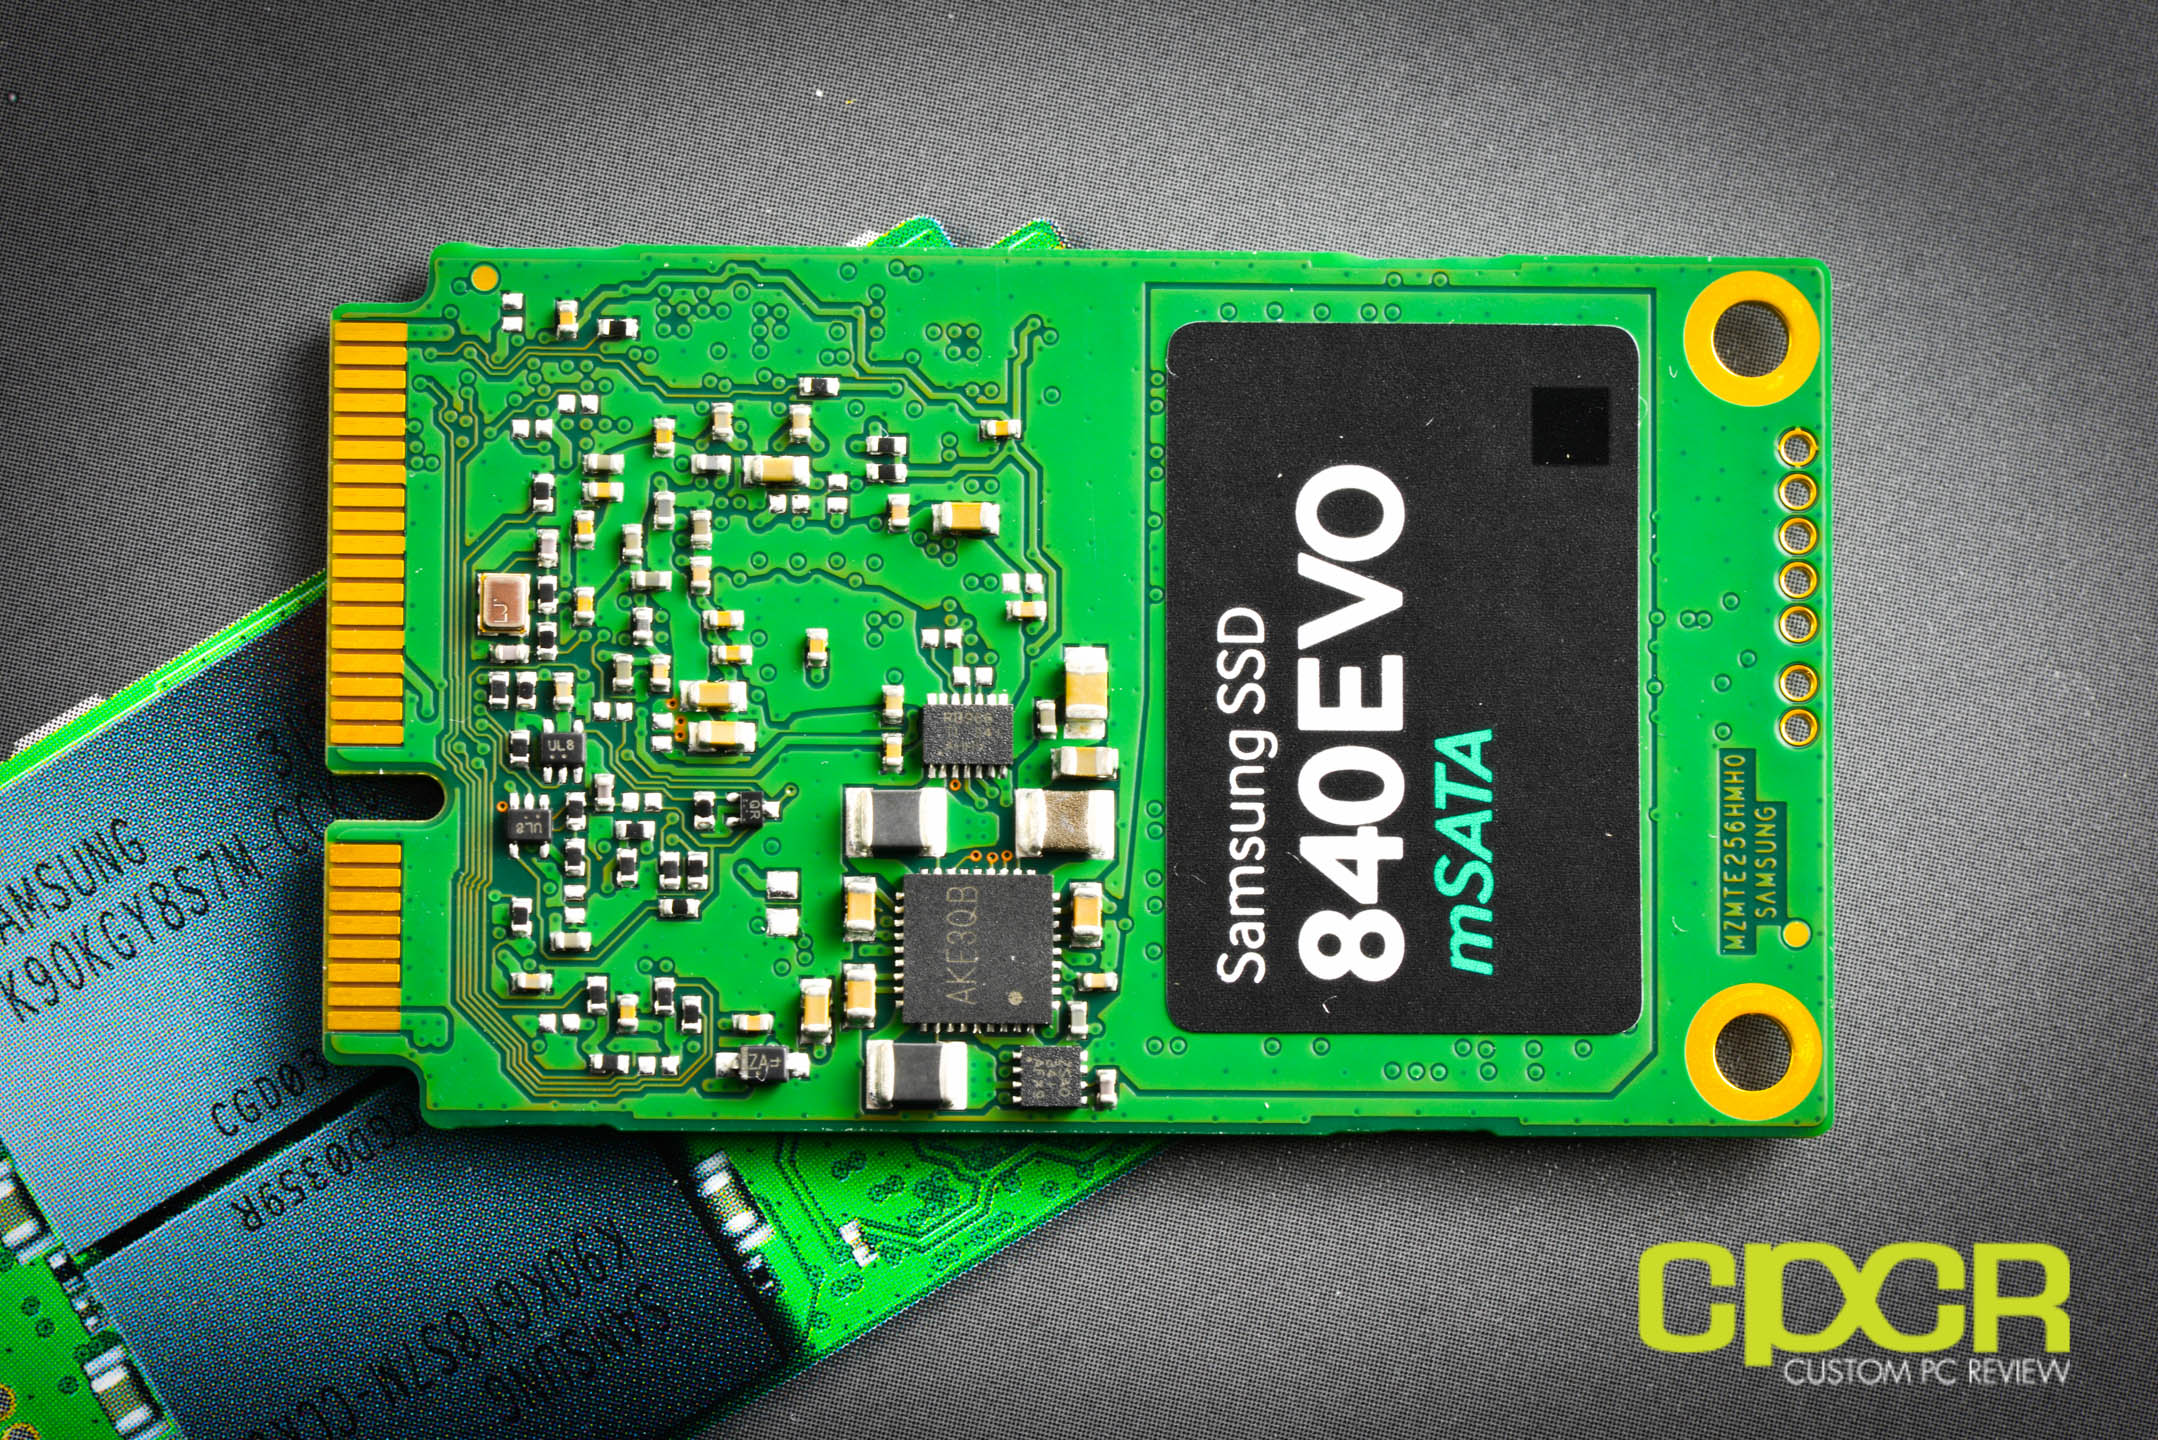
Flipping the unit around, there’s another sticker sitting on top of an open area on the PCB that can accommodate two additional NAND packages for a maximum total of four NAND packages on the SSD. It’s unnecessary for the 250GB model, but the 1TB model will probably have the additional area populated.
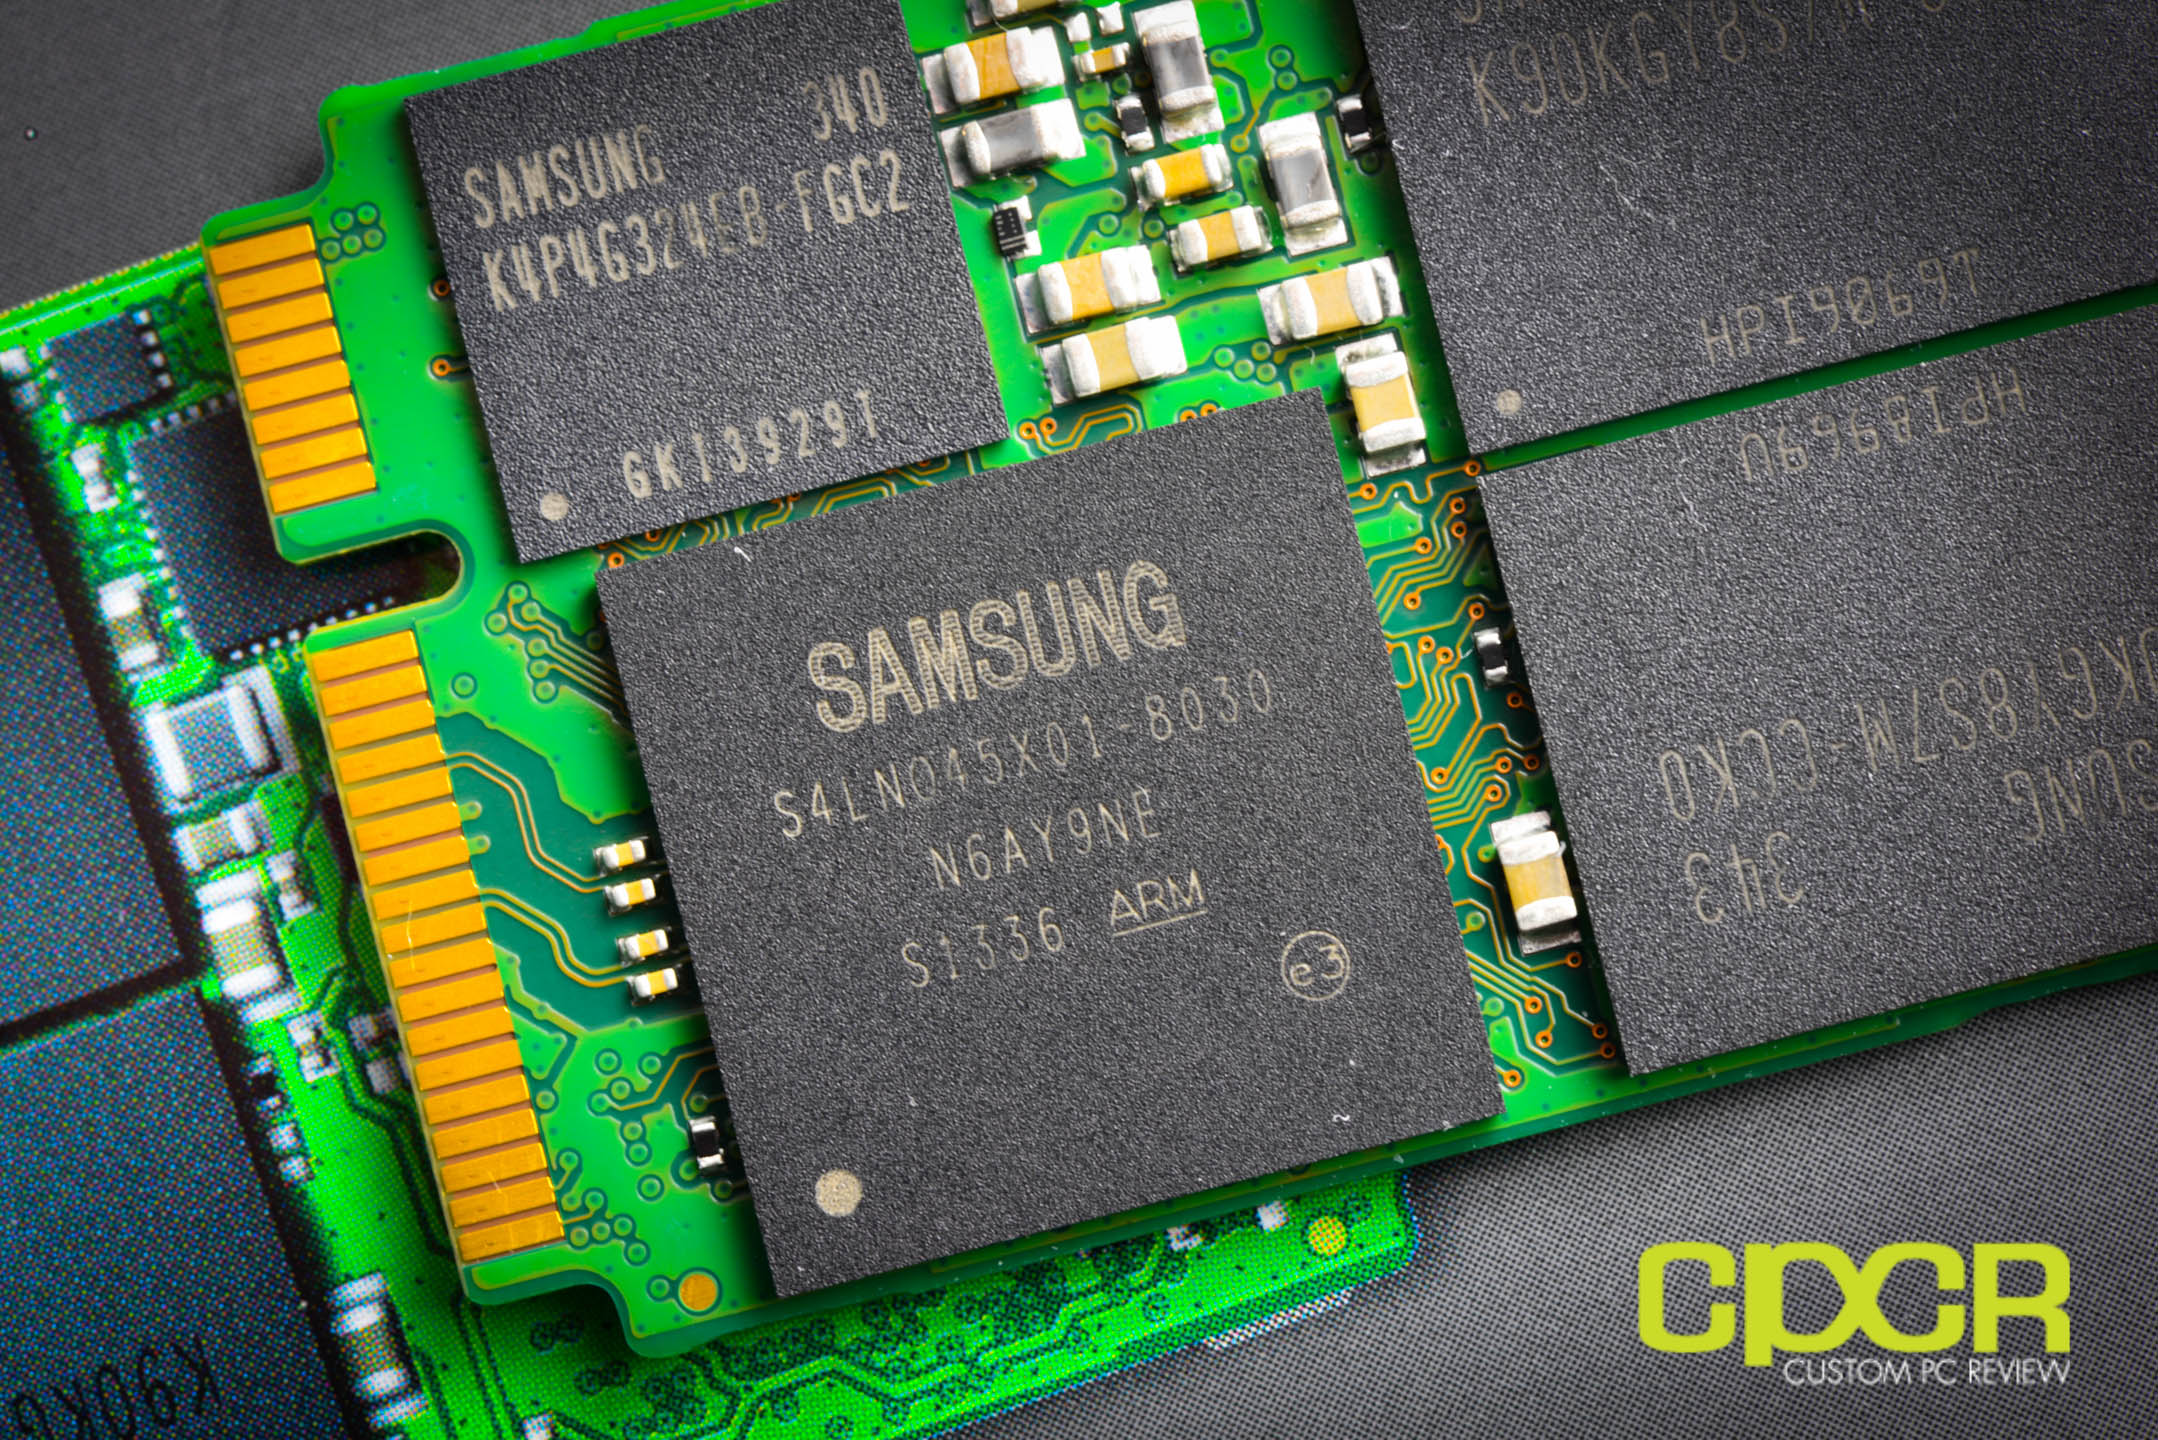
Zooming in on the controller, we can see that Samsung is still using the same exact in-house Samsung MEX controller that debuted with the SATA based Samsung 840 EVO. It’s a 3-core ARM based controller with the model number S4LN045X01-8030. It features improved signal processing technology and a 33% faster core clock than the MDX controller that debuted with the launch of the Samsung 840 Pro and the vanilla Samsung 840.
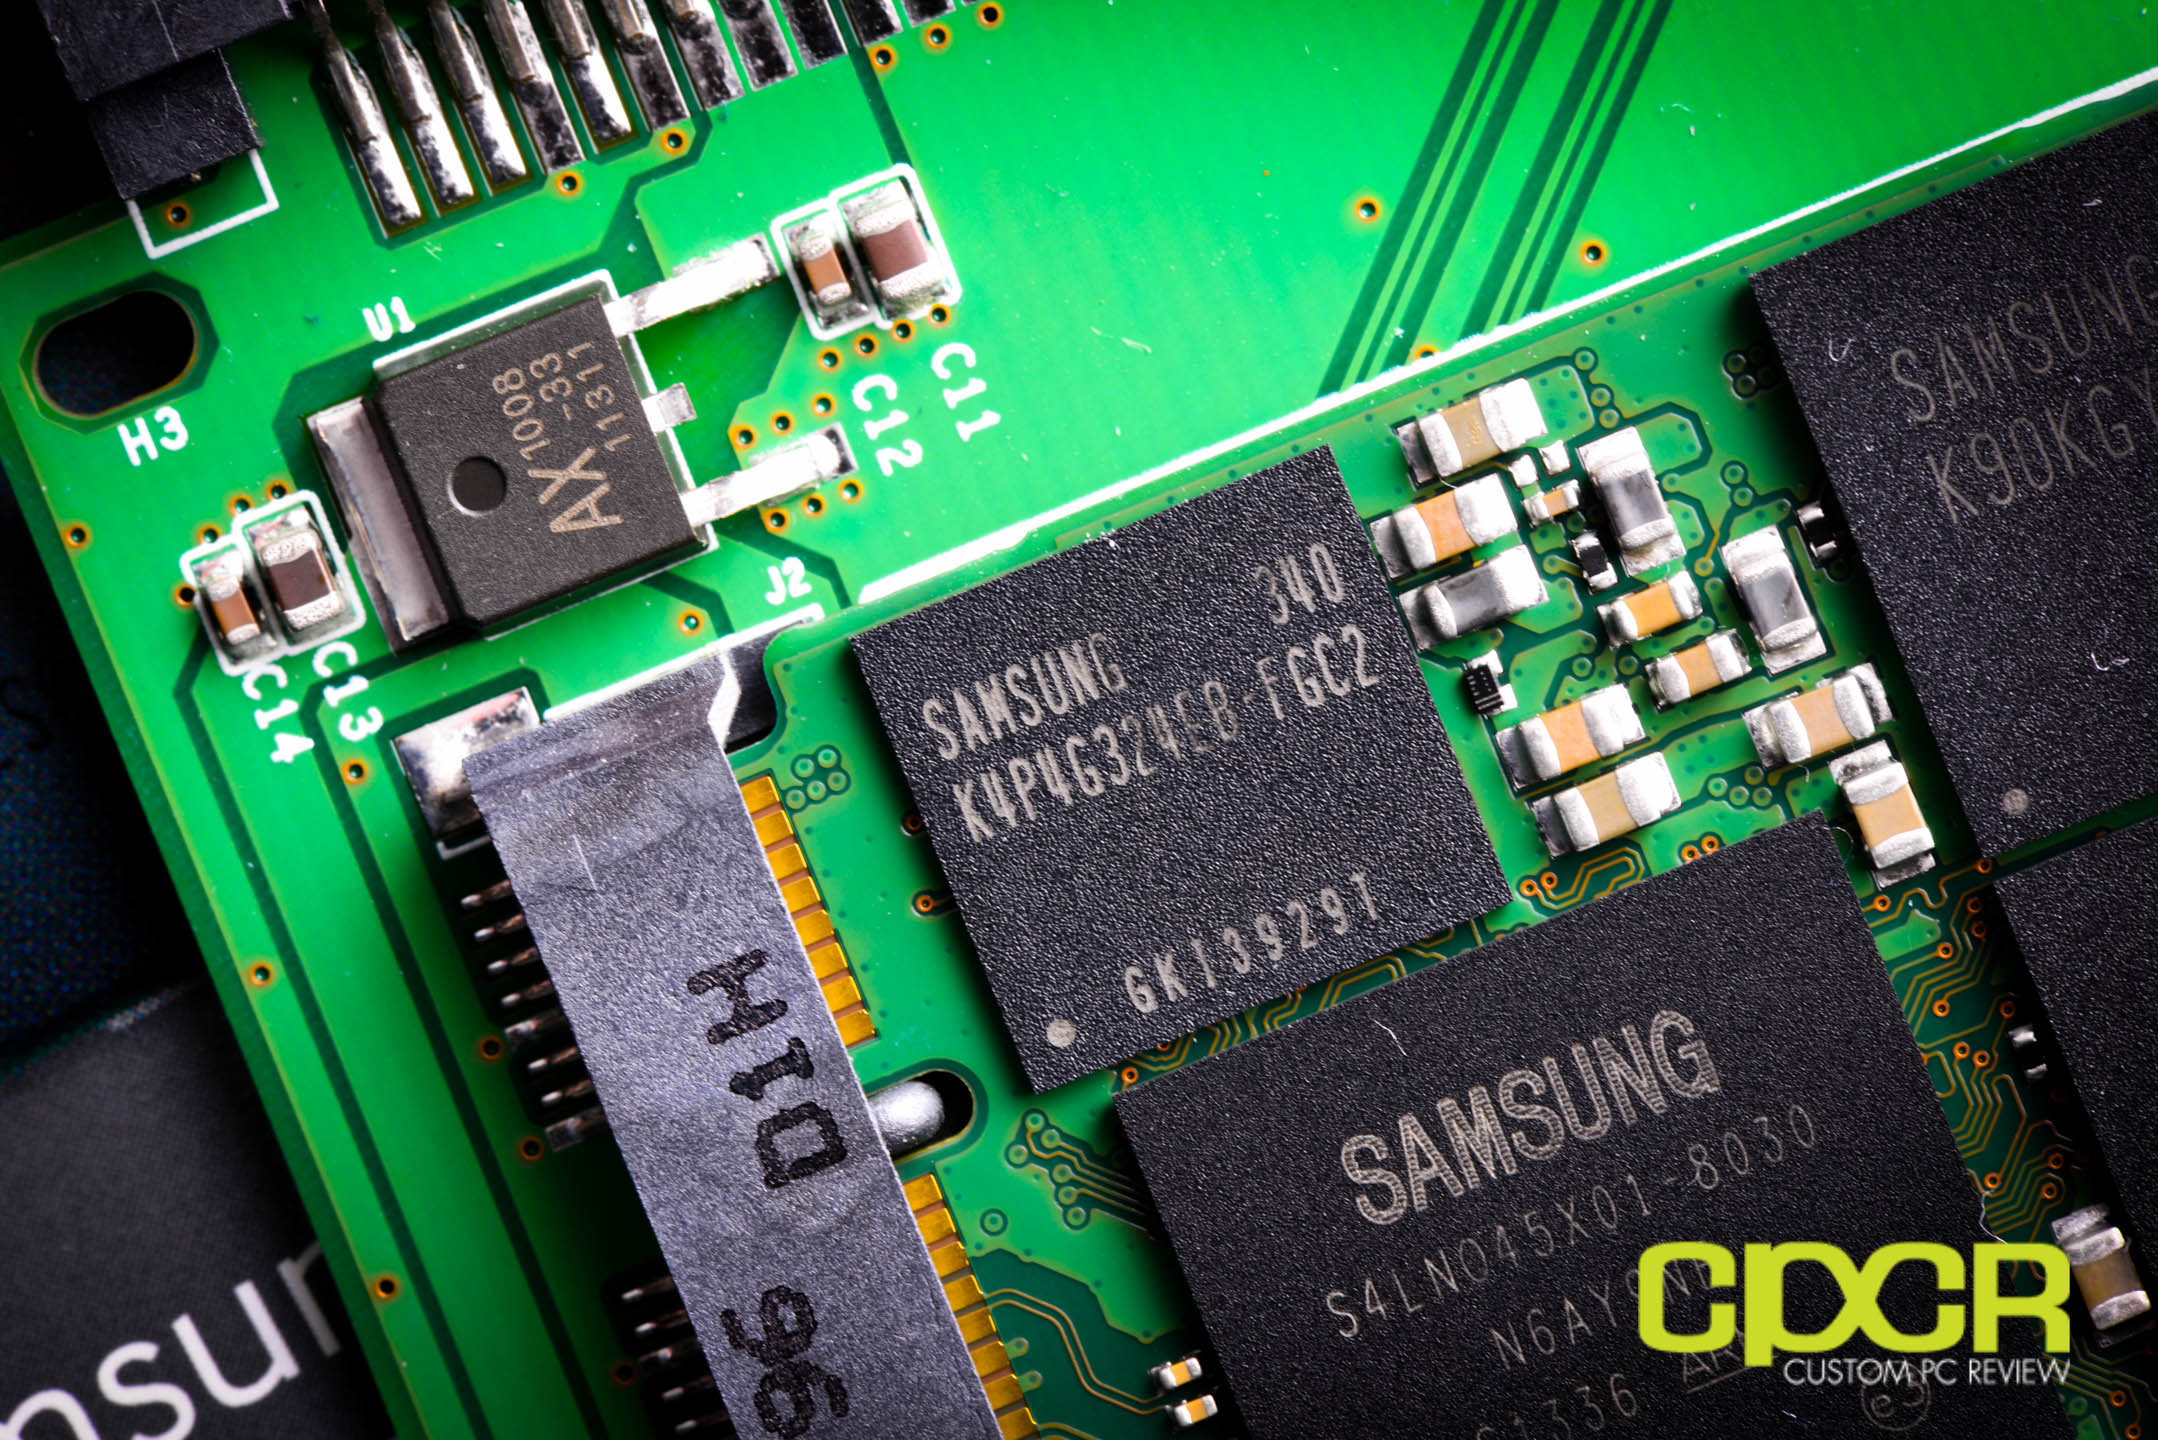
Like the SATA based Samsung 840 EVO, the mSATA edition also makes use of a 512MB LPDDR2 (Model #K4P4G324EB-FGC2) cache. The DRAM cache usually stores mapping tables, small amounts of user data, etc. although it’s not quite known what exactly Samsung does with their DRAM cache. We like to see at least about 1MB of cache for 1GB of storage space on most SSDs, so Samsung has more than enough here.
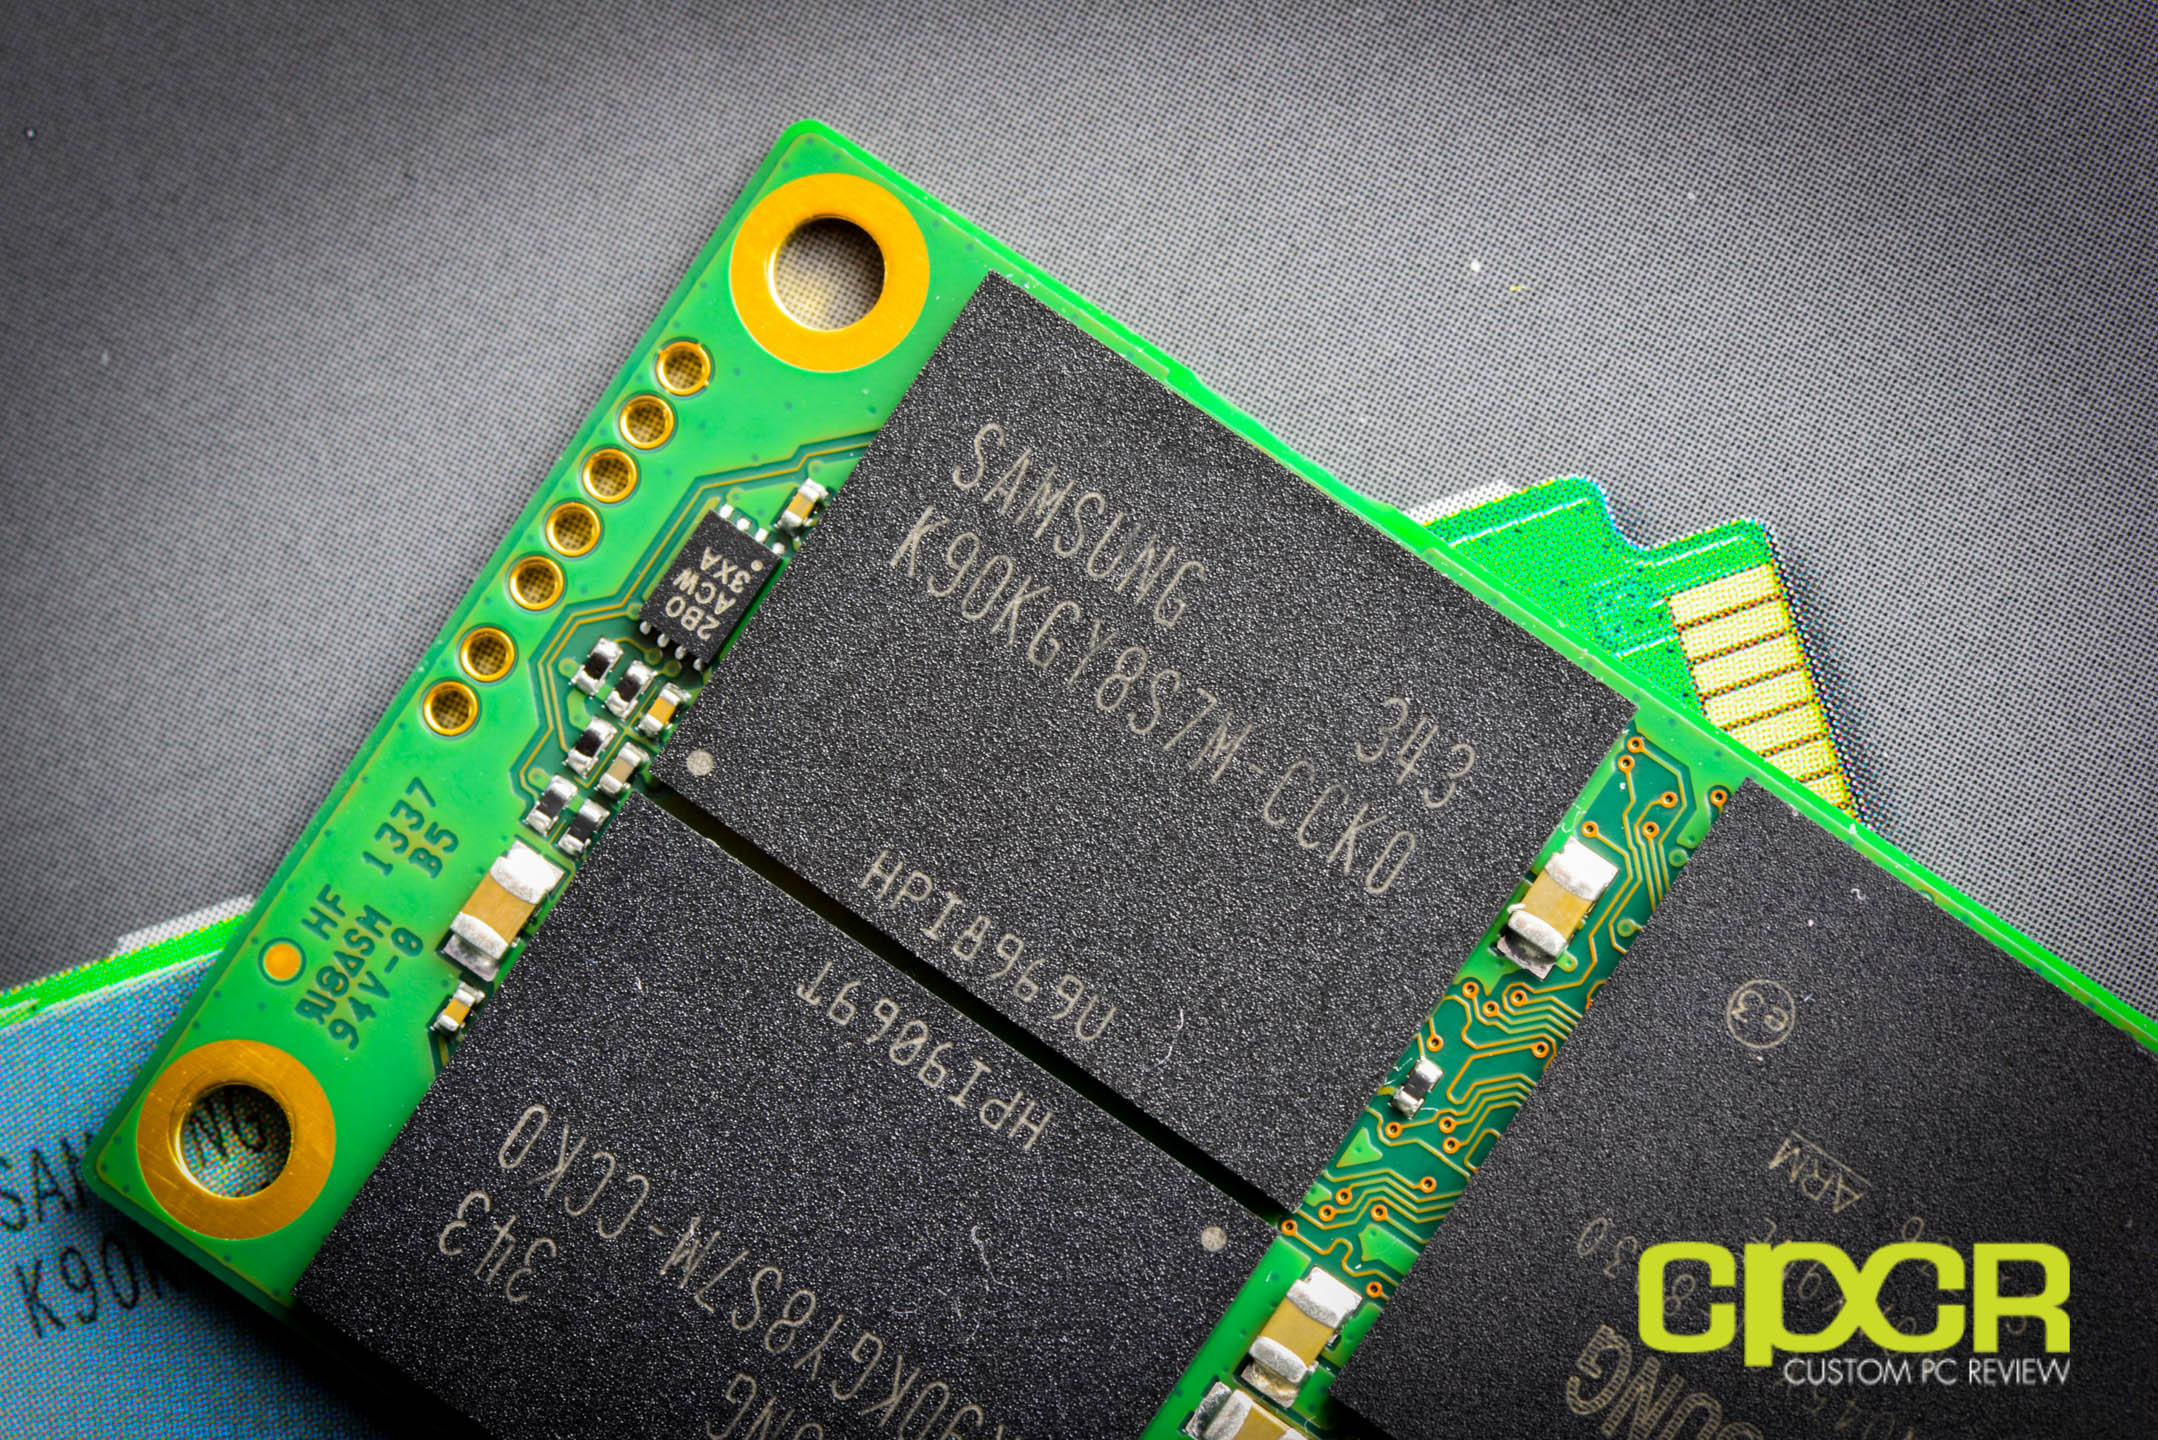
Of course, there’s also the NAND and as far as I can tell, it’s the exact same 19nm Toggle Mode 2.0 TLC (3-bit per cell) NAND (Model# K90KGY8S7M-CCK0) that we’ve seen on the SATA based 250GB Samsung 840 EVO. It’s using 128Gb NAND dies, so we’ve got eight dies per package and two packages which makes up a total of 256GB of NAND. Take out 3GB of that for the TurboWrite cache and 3GB of over-provisioning, and we’re left with a total of 250GB.
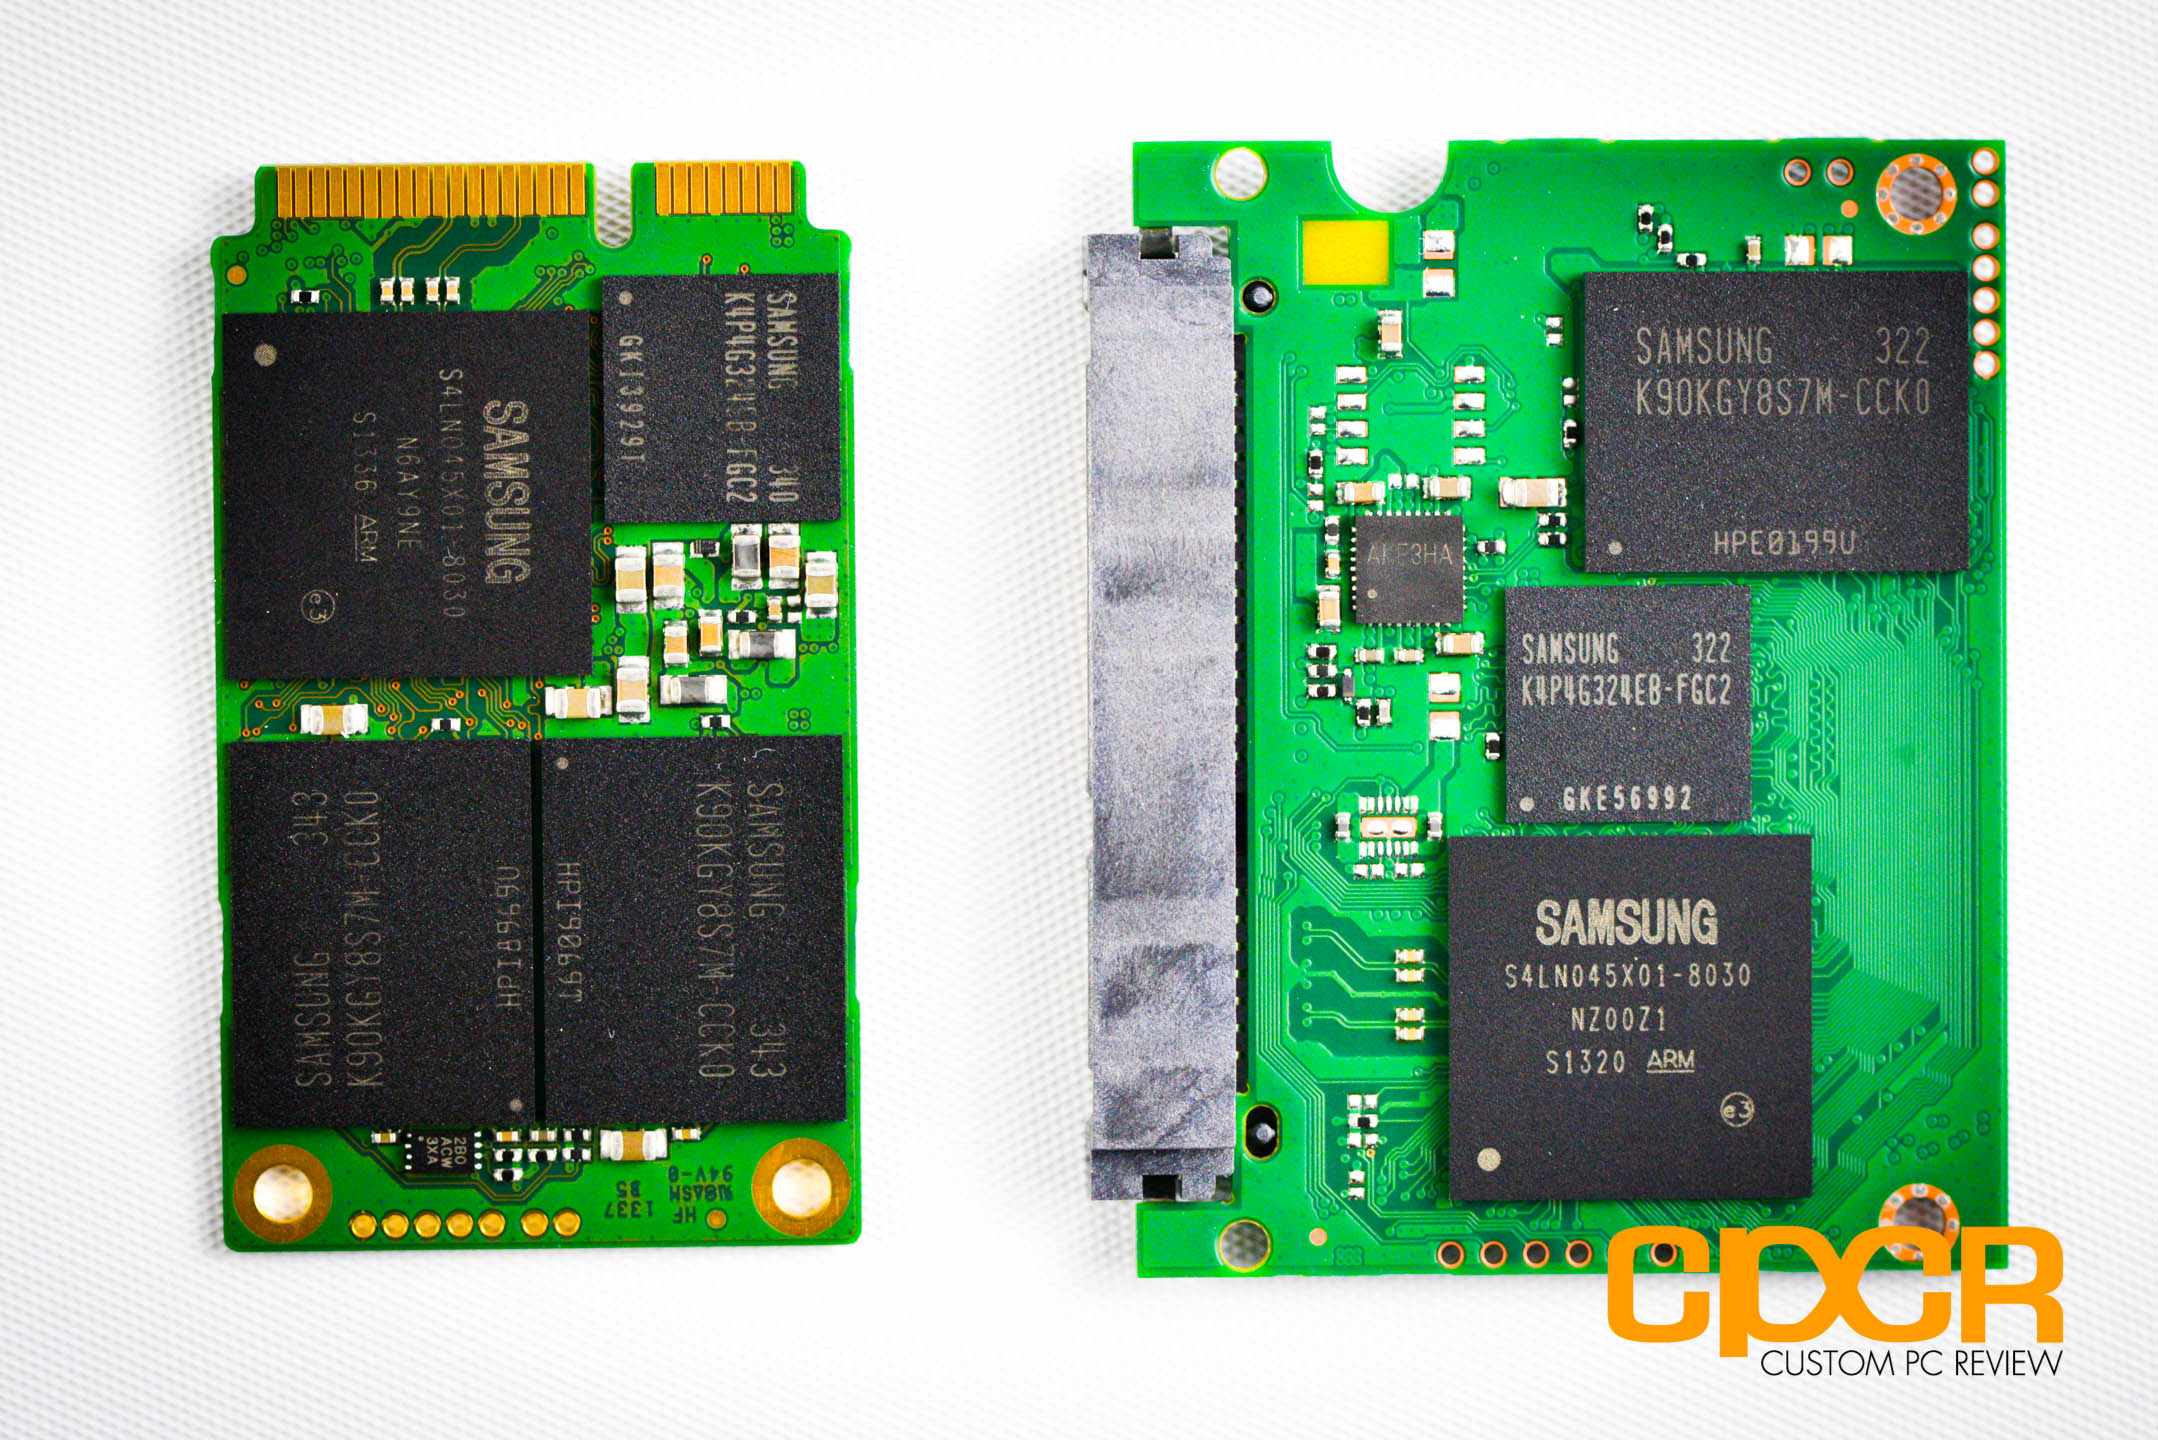
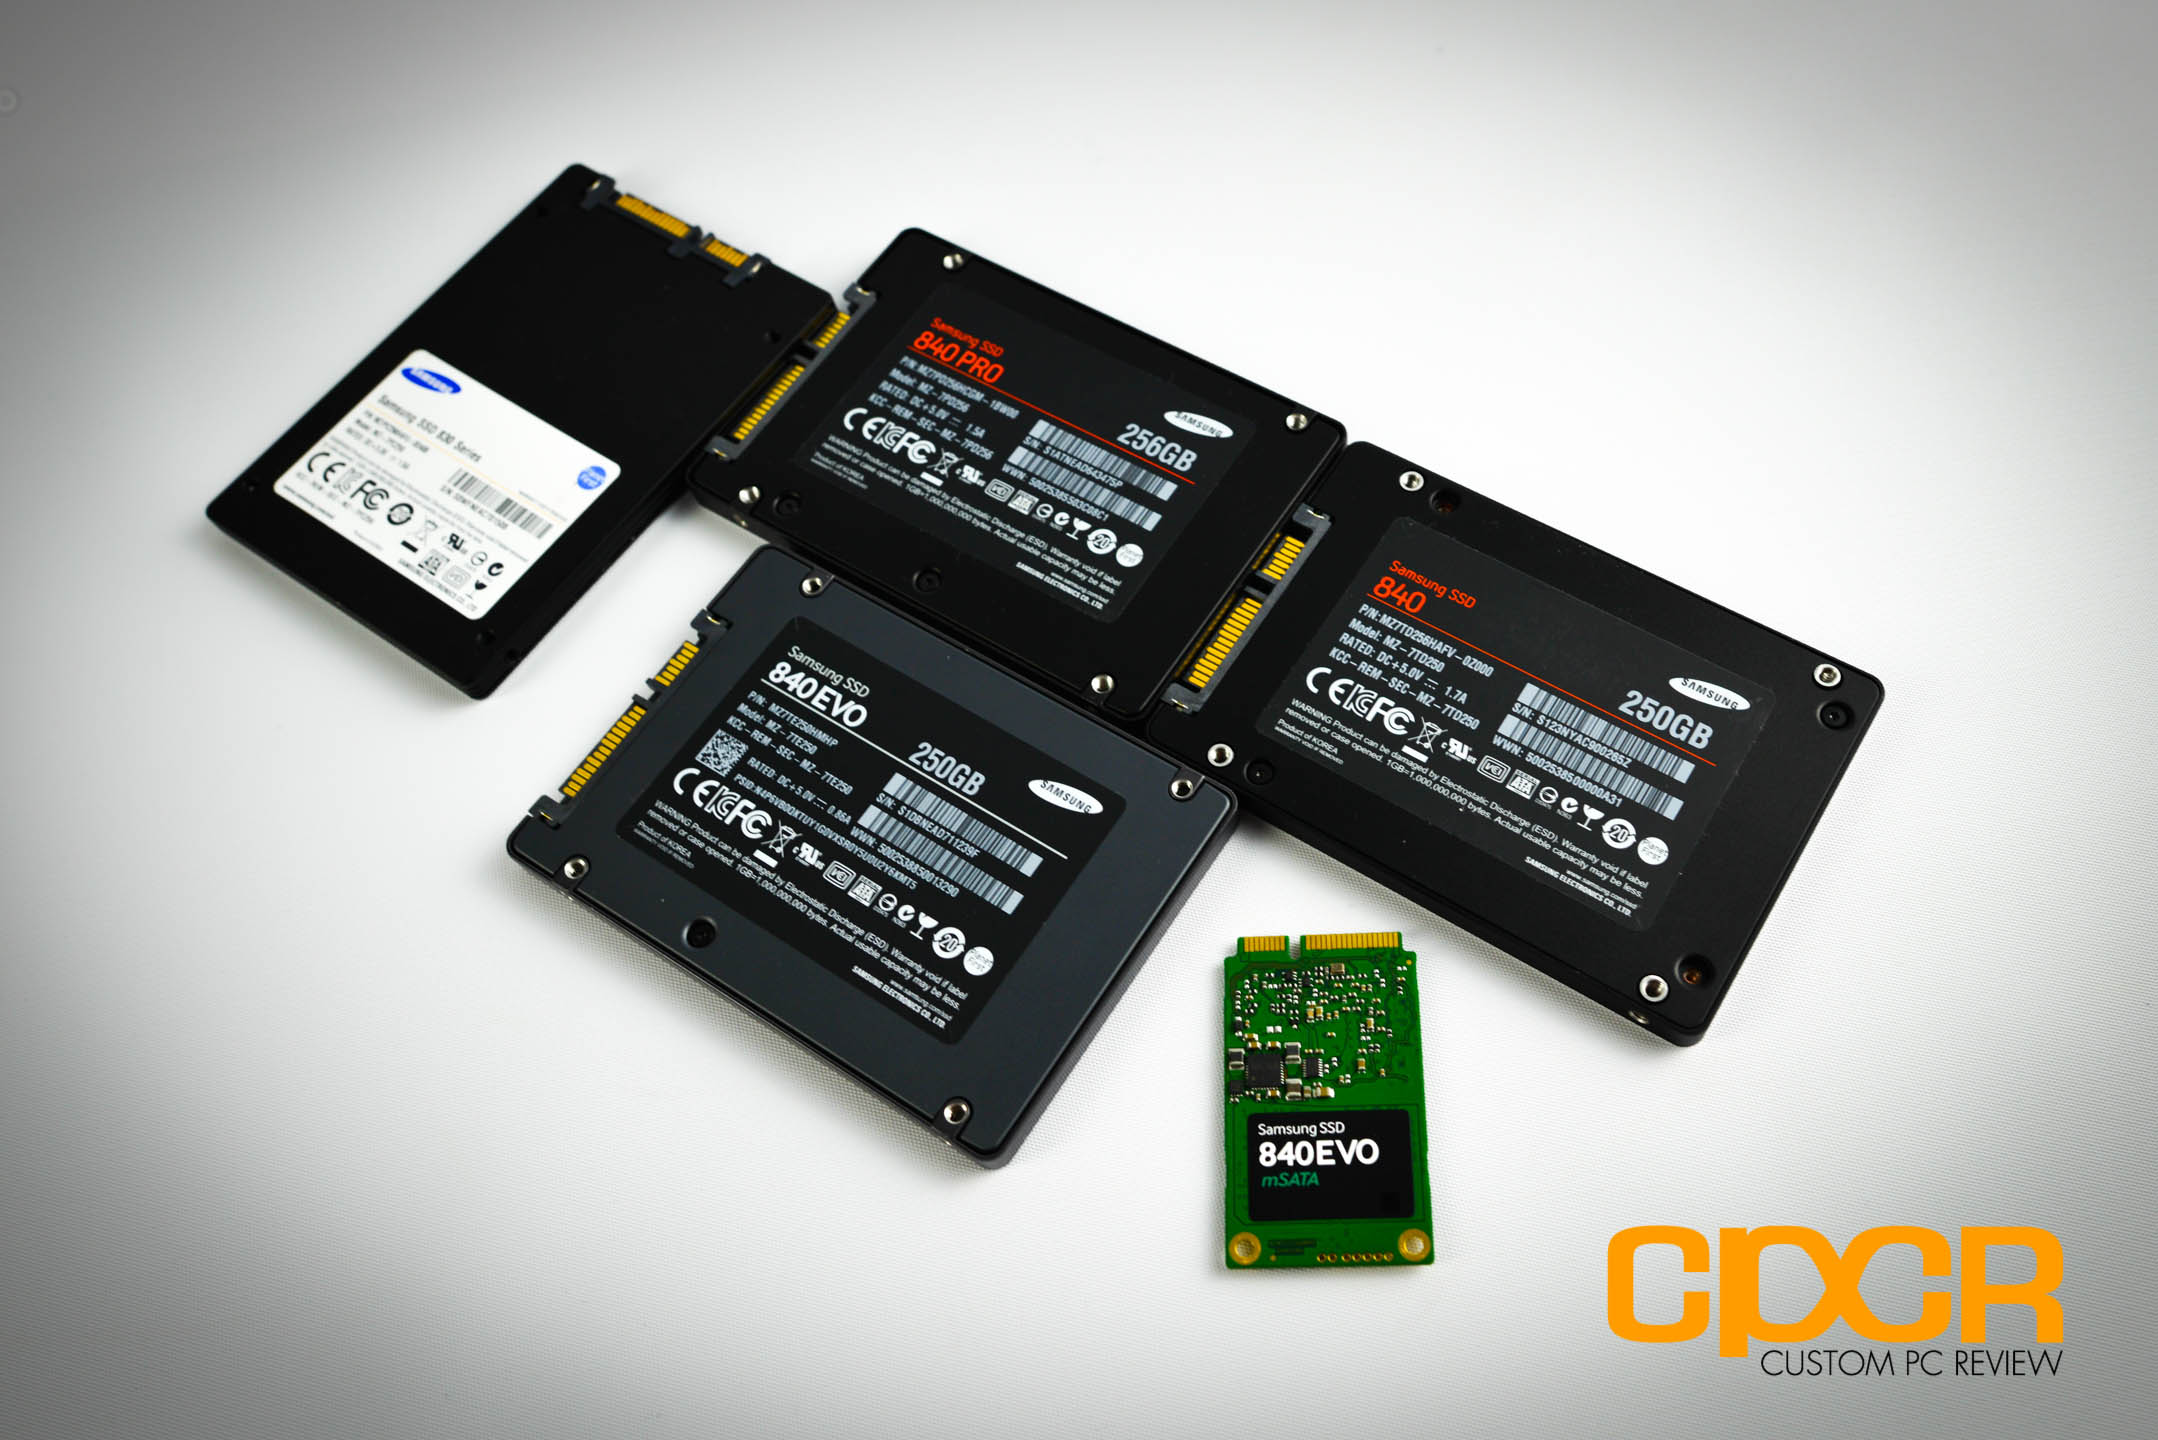
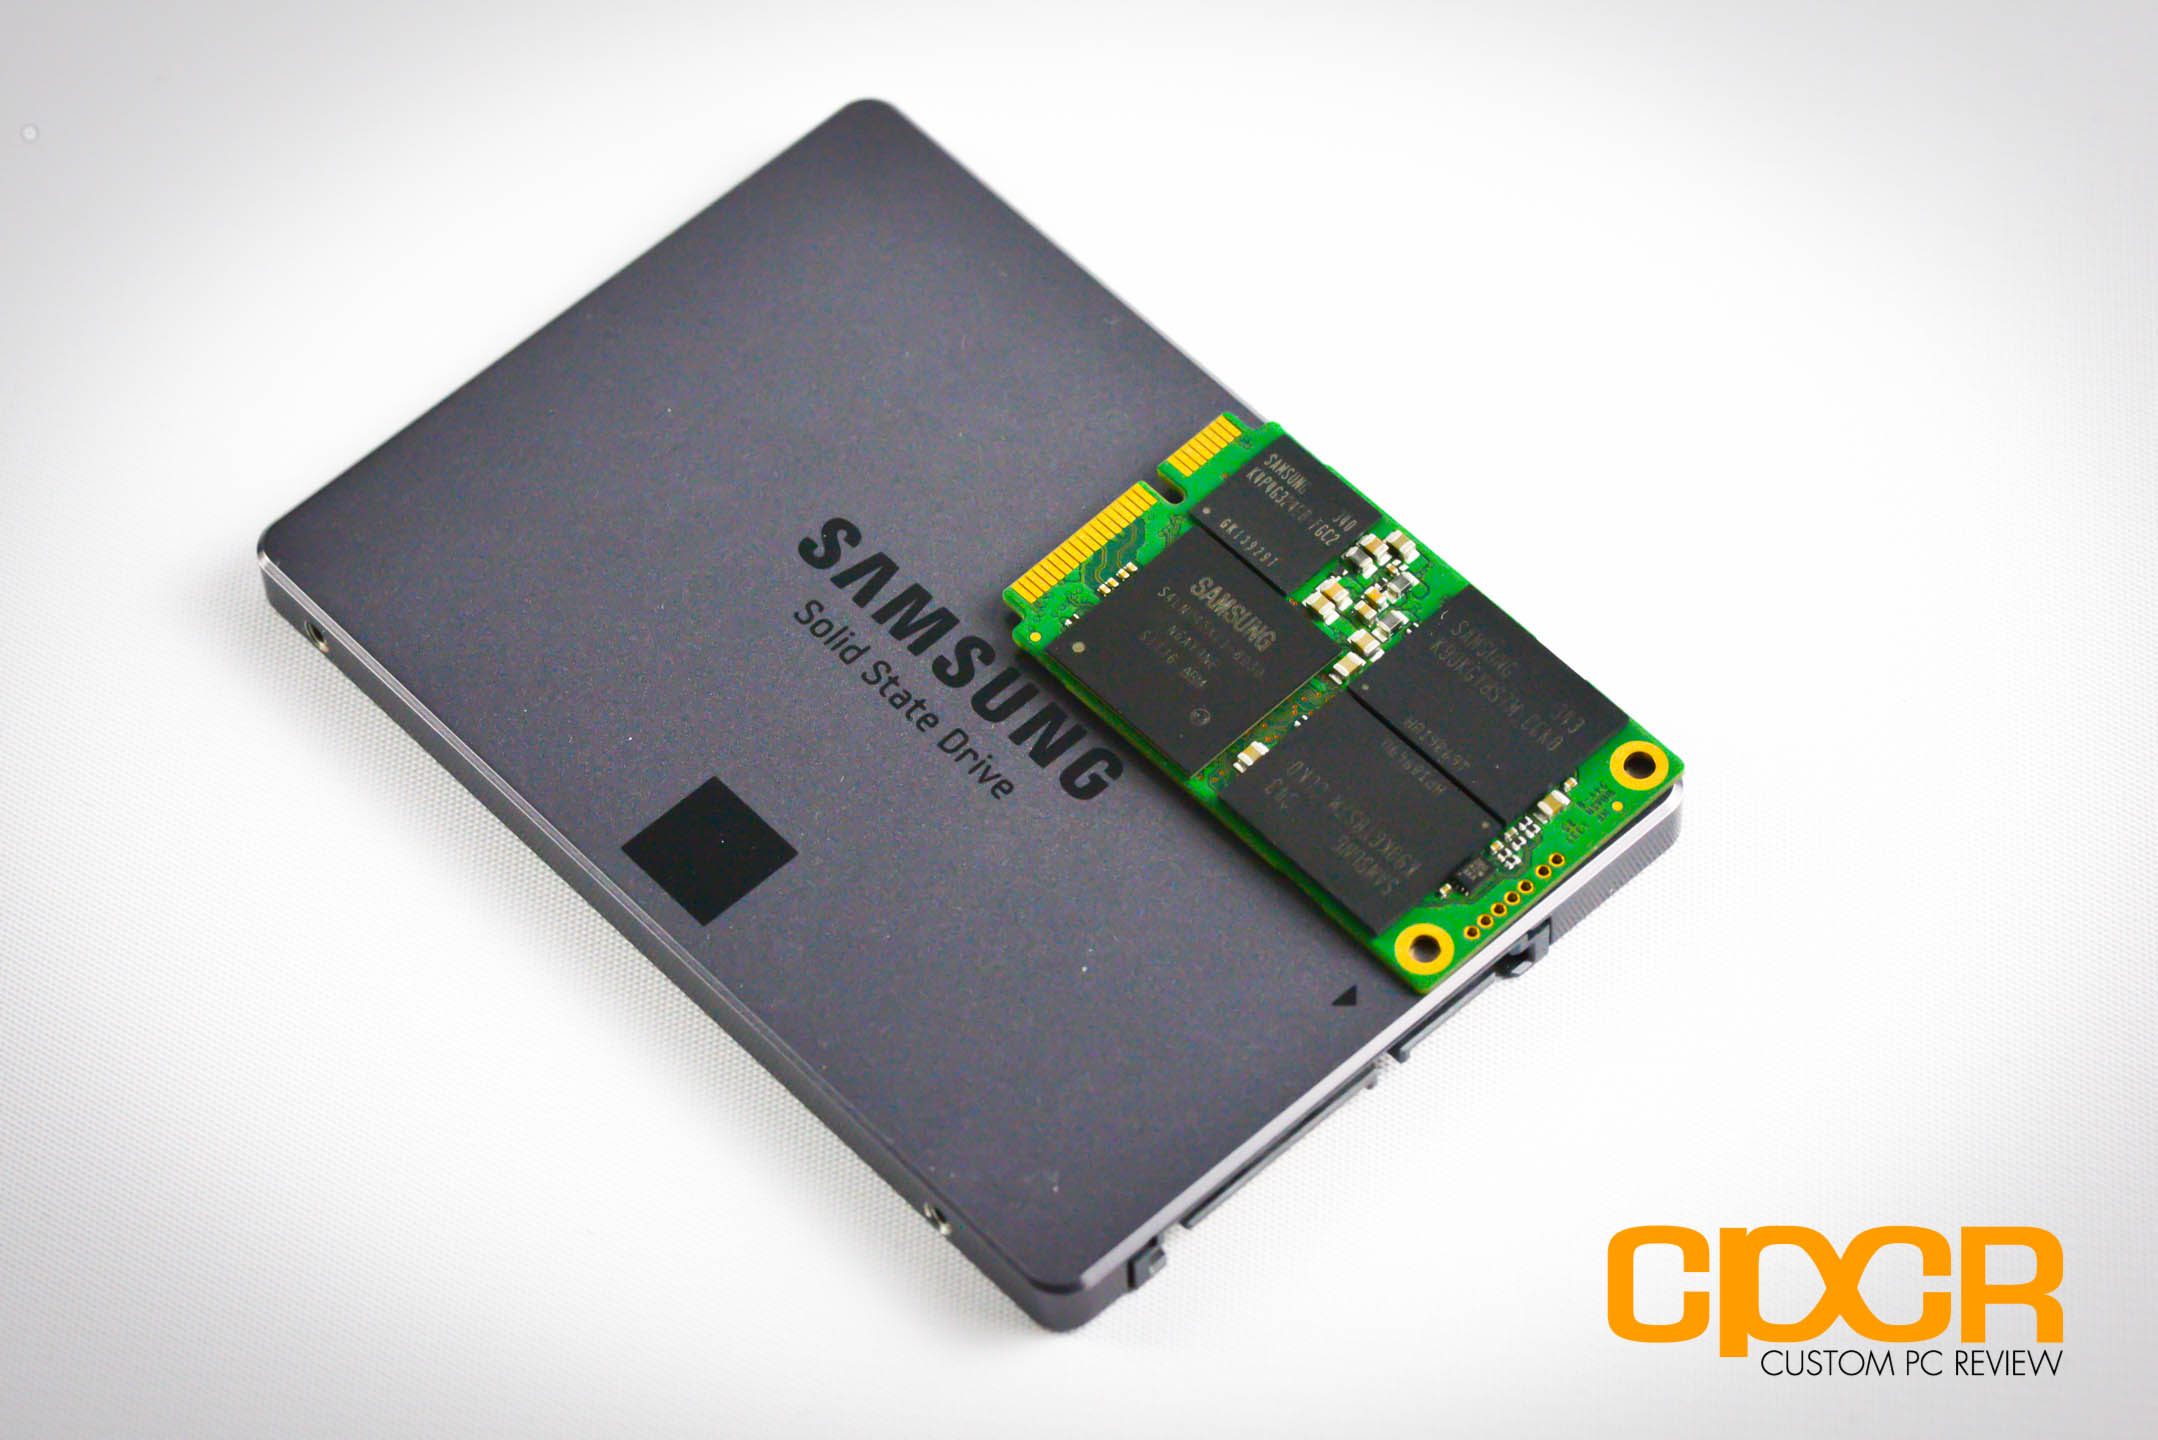
Just for comparison purposes, we’ve got the 250GB Samsung 840 EVO mSATA on the left and the 250GB Samsung 840 EVO SATA on the right. There’s also a NAND package on the back of the SATA version, but aside from the slight difference in layout and interface, the components on the two drives are carbon copies of each other.
[section label=3. Testing Setup / Drive Information]
Haswell Test Bench
As of October 5, 2013, we’ve upgraded our storage testing system to a Z87/Haswell testing platform. All SSDs used for comparison here have been updated to the latest firmware as of October 2013. Performance tests from storage reviews prior to that date should not be compared to our latest reviews.
| System | CyberPowerPC Gamer Xtreme 4200 |
|---|---|
| CPU | Intel Core i7 4770K |
| Motherboard | ASUS Z87-A |
| Memory | Kingston HyperX Genesis 16GB DDR3 2133MHz |
| Graphics | Intel HD4600 Graphics |
| Storage | OCZ Vertex 4 256GB |
| Power Supply | Corsair HX650 |
| Case | HSPC High Speed Tech Station |
| Optical Drive | ASUS OEM DVD Drive |
| Operating System | Windows 8 64 bit & CentOS 6.4 |
Special thanks to CyberPowerPC, Kingston, OCZ Technology and HSPC for sponsoring our test bench!
MyDigitalSSD 2.5″ SATA to mSATA Adapter (MDMS-MSATA-ADPT)
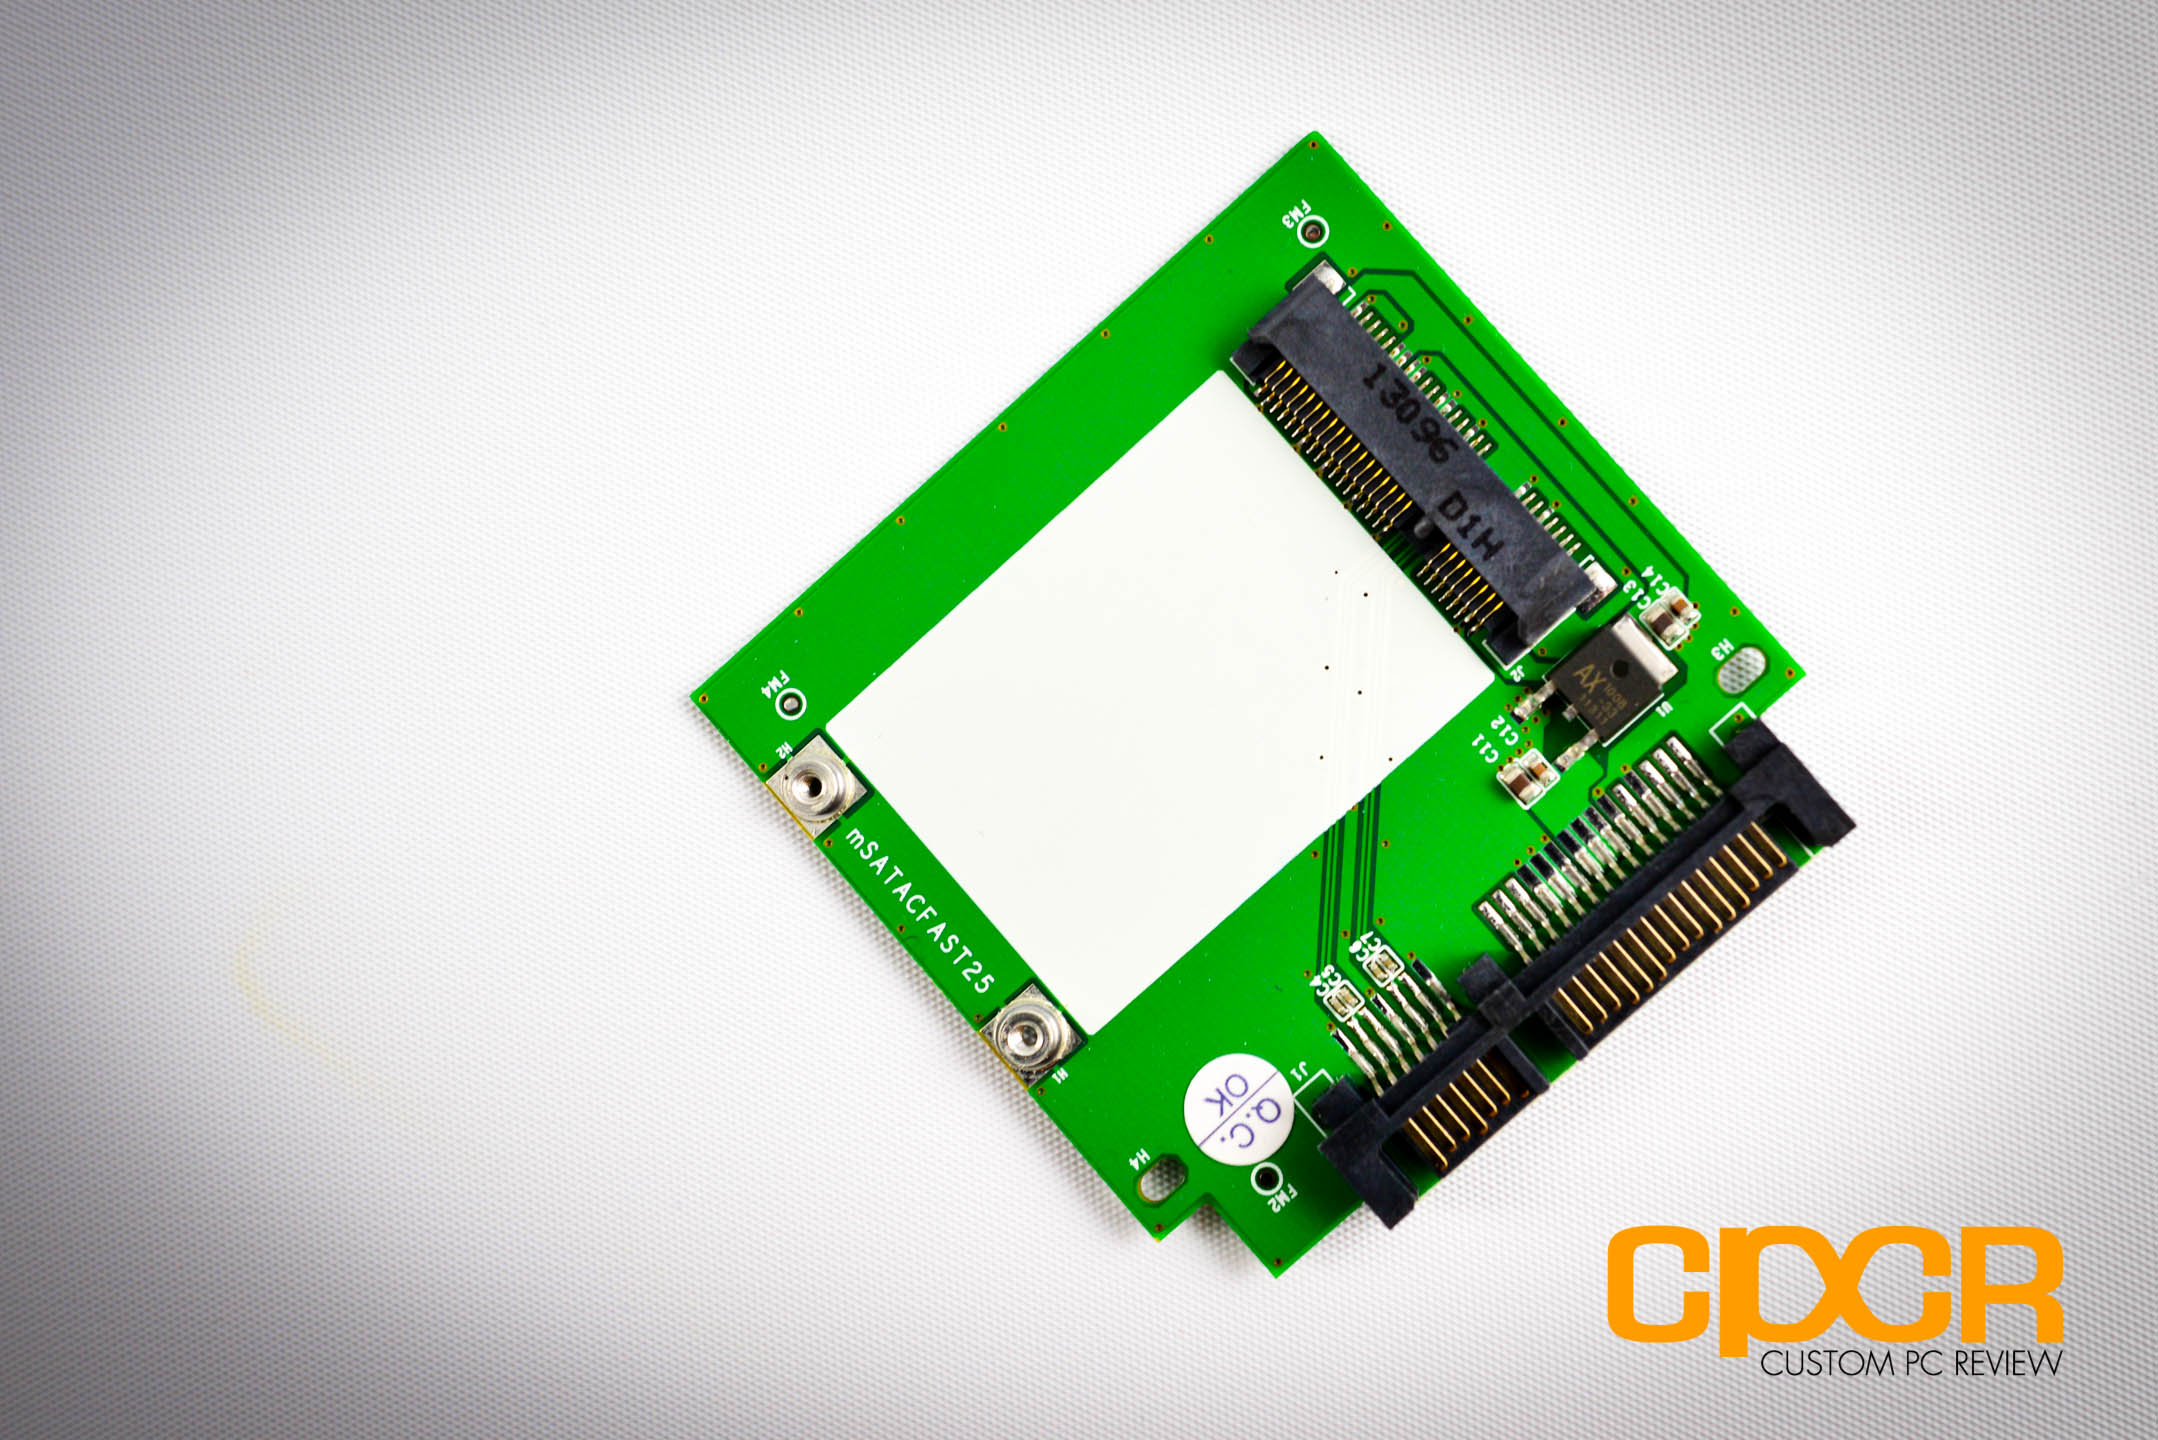
As our test system doesn’t natively support mSATA, we’ll be using a MyDigitalSSD 2.5″ SATA to mSATA adapter, which can be picked up at Amazon for ~$15. The adapter simply translates the full sized SATA connector to the mSATA connector so there isn’t any degradation in performance.
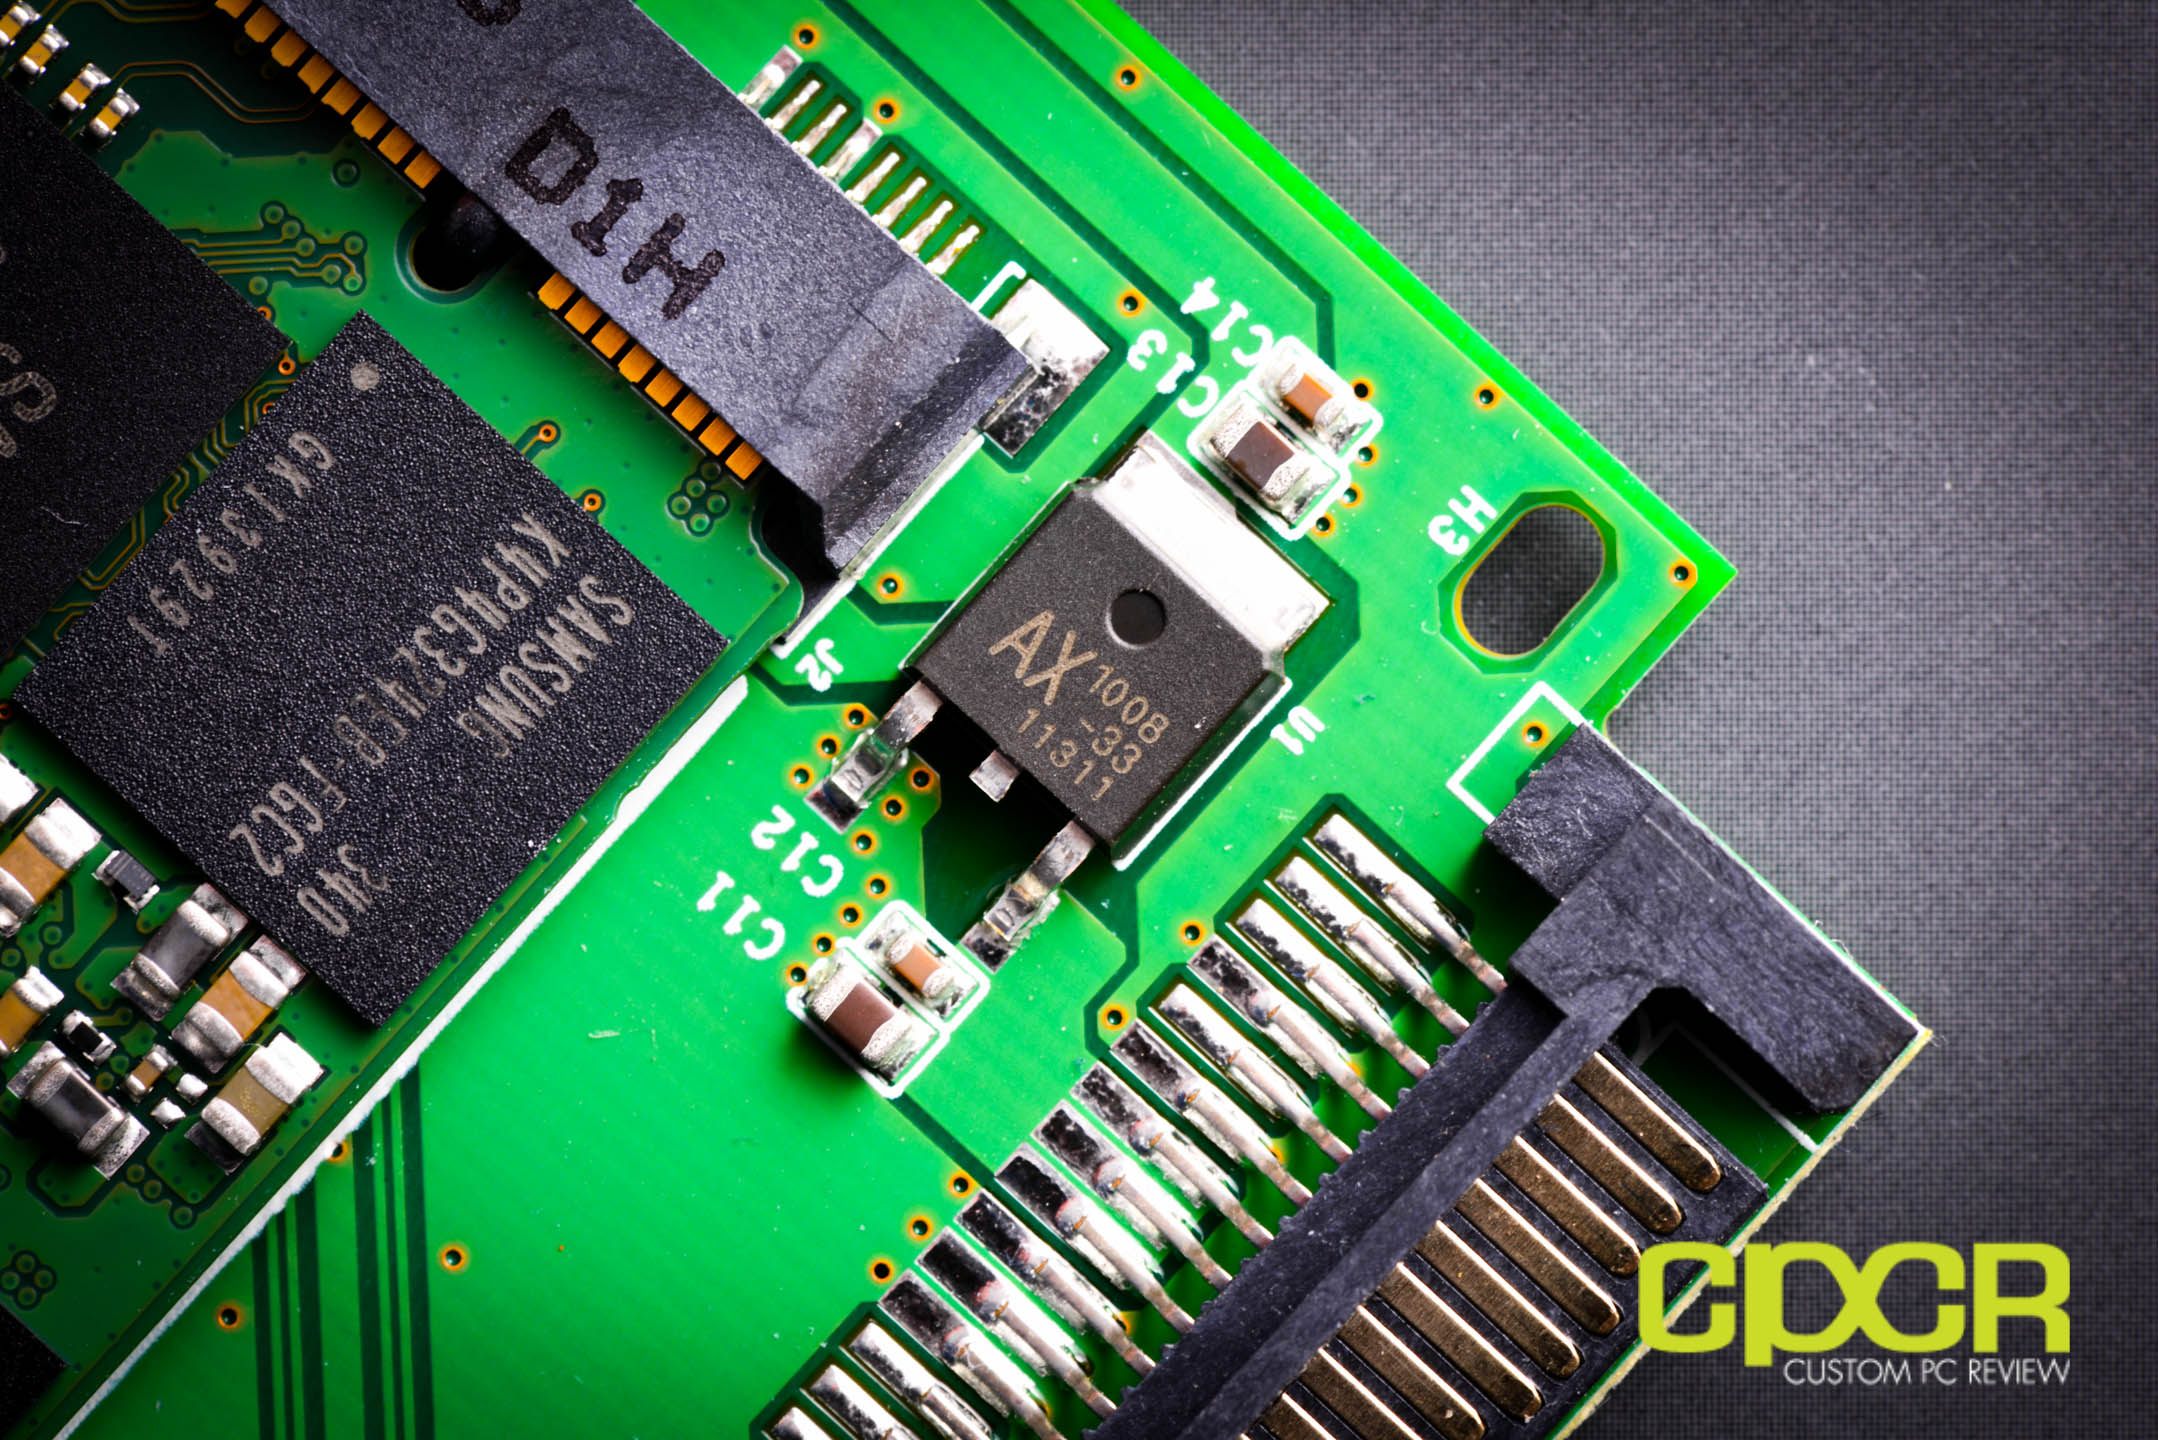
The only problem with this unit is instead of directly translating the 3.3v power from the SATA connector, it instead uses an Axelite AX1008 linear voltage regulator to convert the 5v output from the SATA connector to 3.3v. The nice thing is that it allows SATA to Molex adapters to work with the adapter since Molex connectors don’t have a 3.3v pin, but the problem with this is that the linear voltage regulator acts as a resistor, which introduces resistance to the circuit in order to drop the voltage. Because of this resistance, it requires more energy to drive the circuit, so we won’t be able to accurately measure power consumption. While this is a negligible amount of power in higher powered devices, this is a huge problem for measurements taken on mSATA drives that only draw 0.03W (30mW) at idle.
We’ve researched a number of different mSATA adapters, but we haven’t discovered any adapters that don’t include a 5v to 3.3v regulator. If any vendor reading this article is actively producing an adapter that does not use a voltage regulator, we’d love to get in touch with you.
Drive Information
Samsung 840 EVO 250GB mSATA
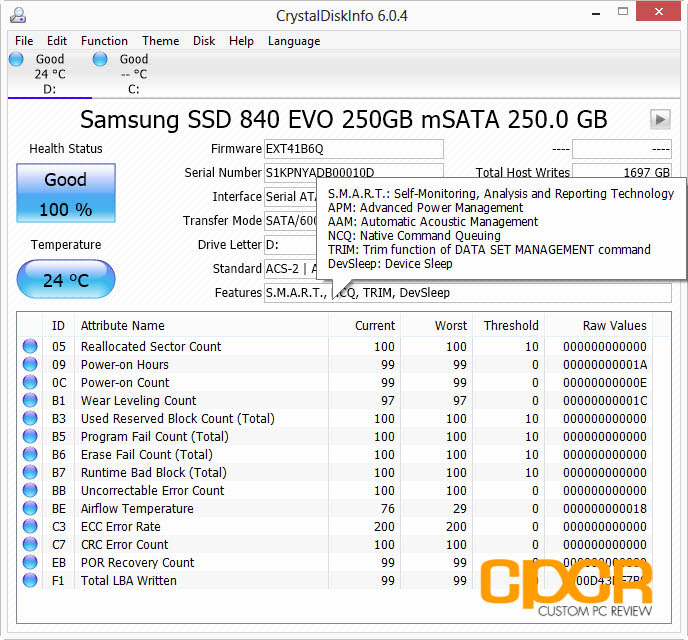
Today’s review will be on the Samsung 840 EVO 250GB mSATA running firmware EXT41B6Q. Samsung SSDs have always made use of every modern feature available and our Samsung 840 EVO mSATA is no different. Among other features, it supports S.M.A.R.T. reporting, NCQ (Native Command Queuing), TRIM, and DevSleep.
Encryption Features
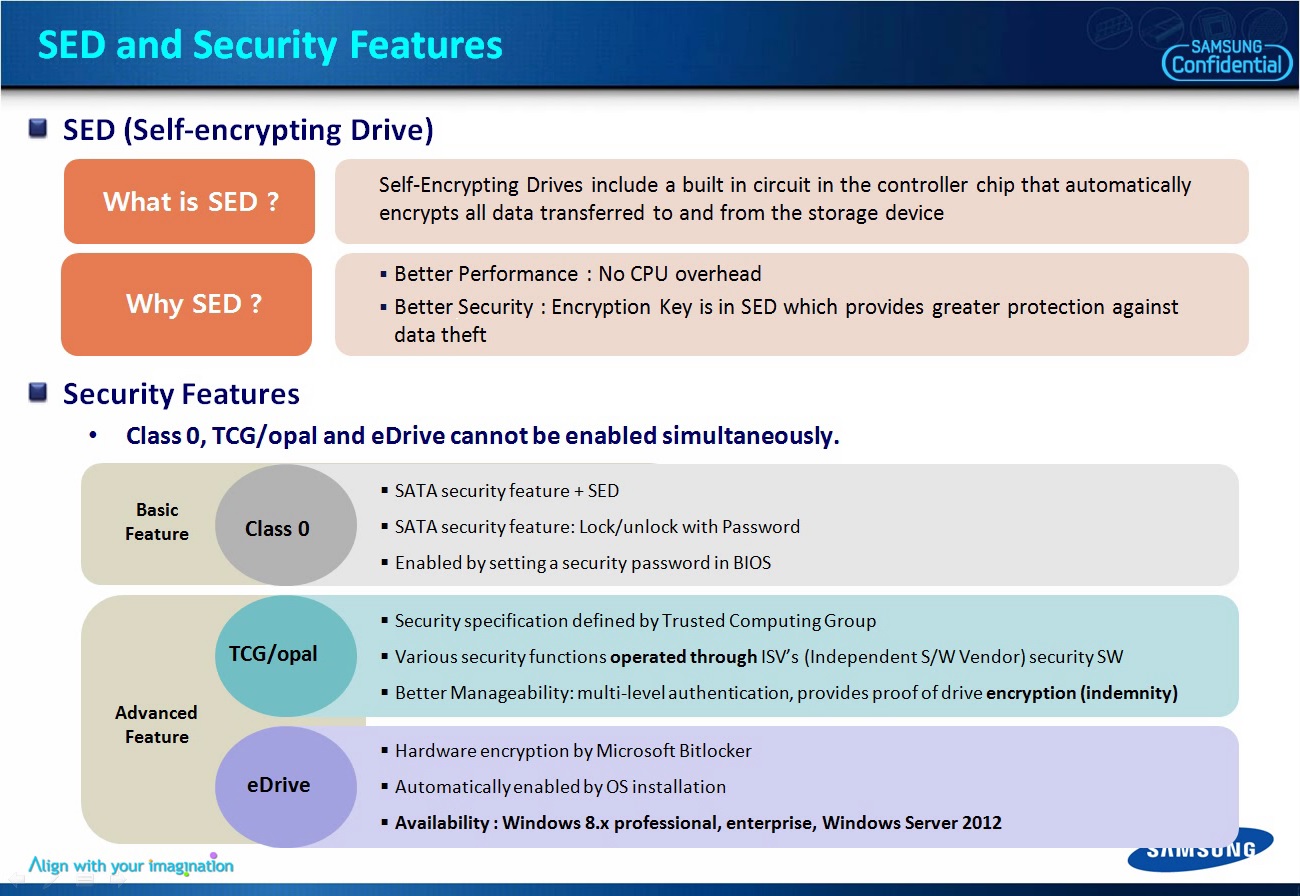
As with most modern SSDs the market, the Samsung 840 EVO mSATA supports the standard BIOS activated AES-256 bit encryption which they call “Class 0”. This is available with pretty much every Samsung SSD out on the market.
However, as recently introduced with a firmware update for the Samsung 840 EVO SATA drives, the Samsung 840 EVO mSATA will now also support TCG Opal 2.0 and IEEE-1667 encryption standards. This makes the Samsung 840 EVO family of drives compatible with both TCG Opal 2.0 based encryption management solutions as well as hardware based Microsoft eDrive.
I’m still working on testing eDrive functionality here as I haven’t been able to get it to work just yet. Getting it to work seems to require a combination of eDrive compatible hardware along with Windows 8 Professional/Enterprise or Server 2012, which I’ll be looking into. As soon as I get it working successfully, I’ll be sure to report back with more information. For now if you’re interested in eDrive, be sure to check out Microsoft’s info page here.
[section label=4. ATTO Disk Benchmark / AS SSD / Crystal Disk Mark]
Samsung 840 EVO 250GB mSATA Performance
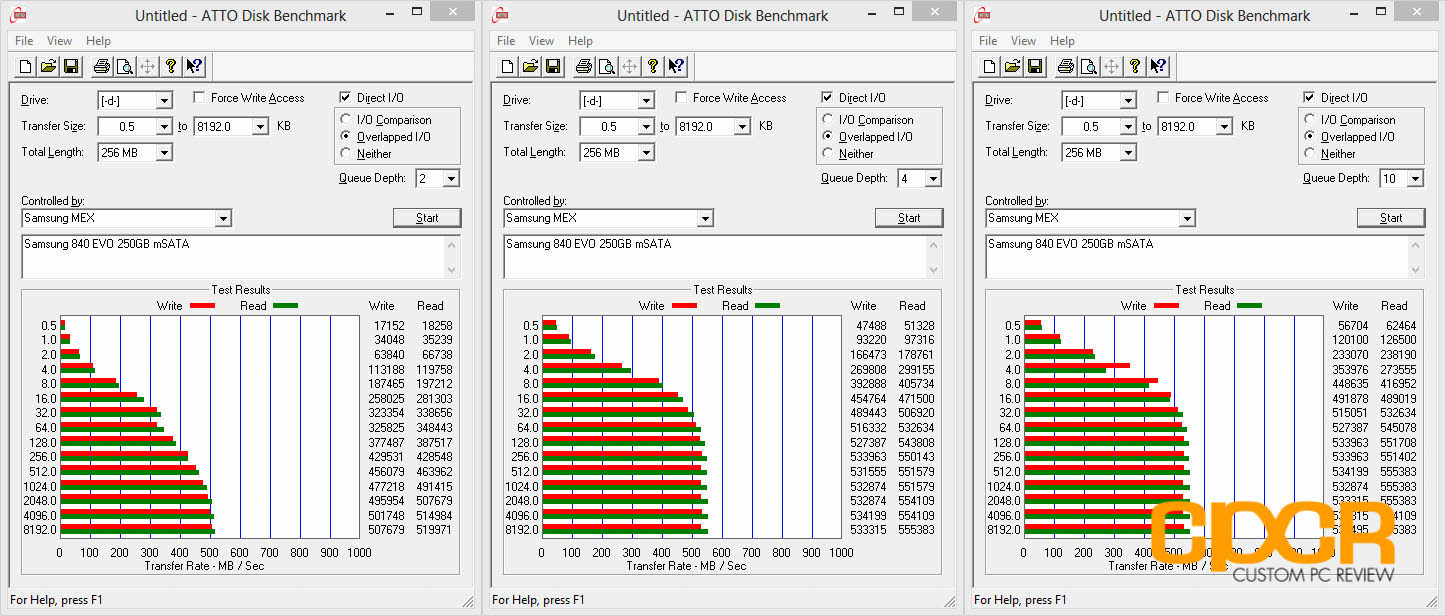
ATTO Disk Benchmark v2.46
ATTO Disk Benchmark is one of the industry’s oldest and most popular benchmarks for testing disk read/write speeds. This benchmarks allows read and write testing using predefined block sizes and gives us a good idea of read/write speeds with different sized files. Most SSD manufacturers these days prefer using this benchmark when advertising SSDs as it tests using compressible data, which tends to yield better performance.
AS SSD Benchmark
AS SSD is a very commonly used benchmark used to measure SSD performance in a number of categories. Here, tests are run using incompressible data at QD1. It also outputs a final score at the conclusion of the test based off the read and write performance of the drive.

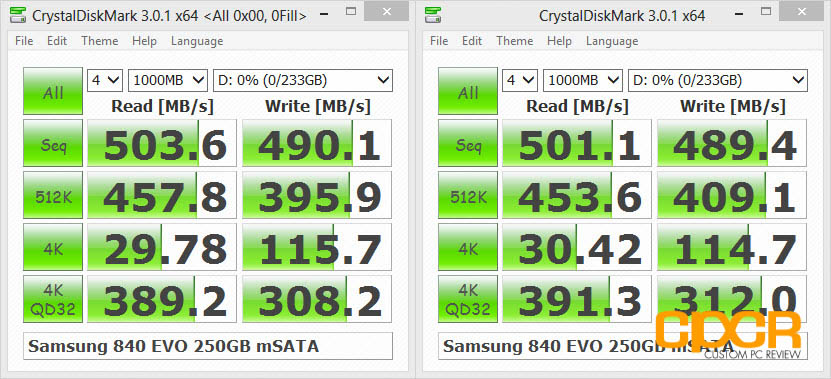
Crystal Disk Mark 3.0.1 x64
Crystal Disk Mark is another popular benchmark which allows us to measure both sequential read/write speeds as well as random read/write speeds. With this benchmark, tests can be run using both random fill (incompressible data) and 0 fill (compressible data). Realistically in typical computer usage scenarios, data being transferred will consist of a mixture of both incompressible and compressible data.
Performance Analysis
I’d say we’re off to a pretty good start. Sequential read/write performance maxes out at 522/531MB/s respectively and 4K performance was capable of hitting 30MB/s reads and 115MB/s writes. Pretty much what I was expecting since performance should be near identical to the Samsung 840 EVO 250GB SATA I reviewed not too long ago.
[section label=5. PC Mark 7 / PC Mark 8]
Samsung 840 EVO 250GB mSATA Performance
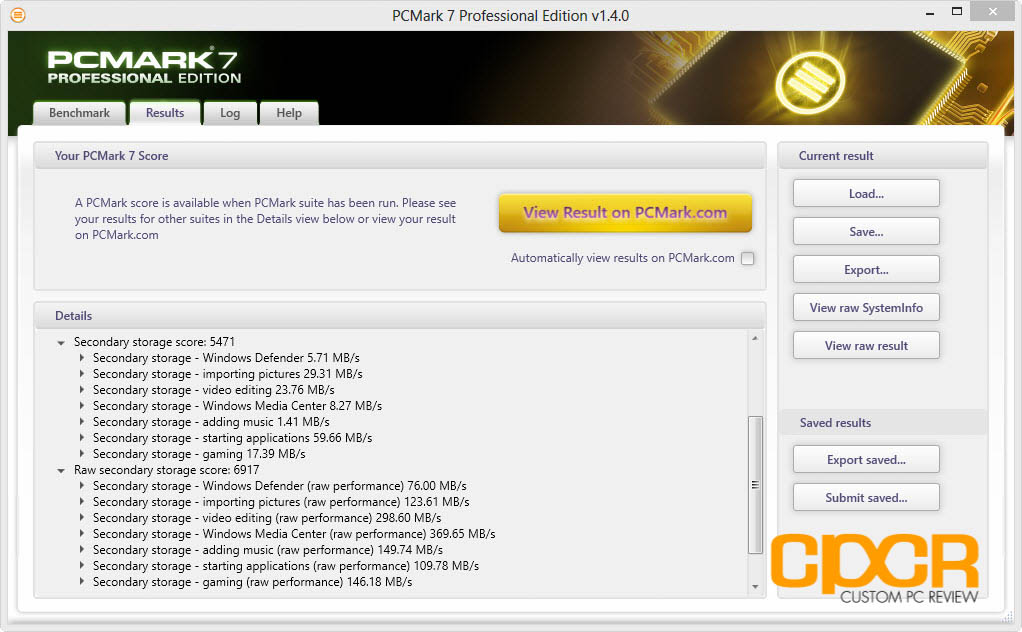
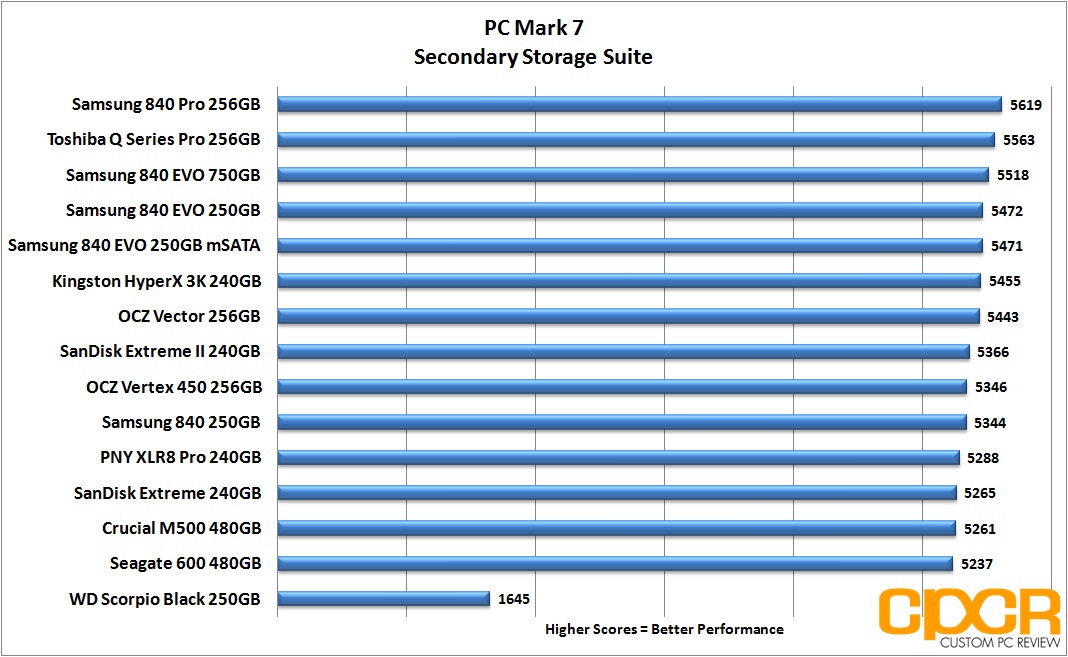
PC Mark 7
The PC Mark 7 storage test evaluates the SSD under many different real world environments such as gaming, multimedia editing, etc. This closely represents the SSD’s performance under real world situations.
PC Mark 8
The PC Mark 8 storage test is similar to storage tests found in PC Mark 7. The PC Mark 8 storage test evaluates SSDs under many real world applications such as gaming, video editing, photo editing, etc. and is well regarded among the SSD industry.
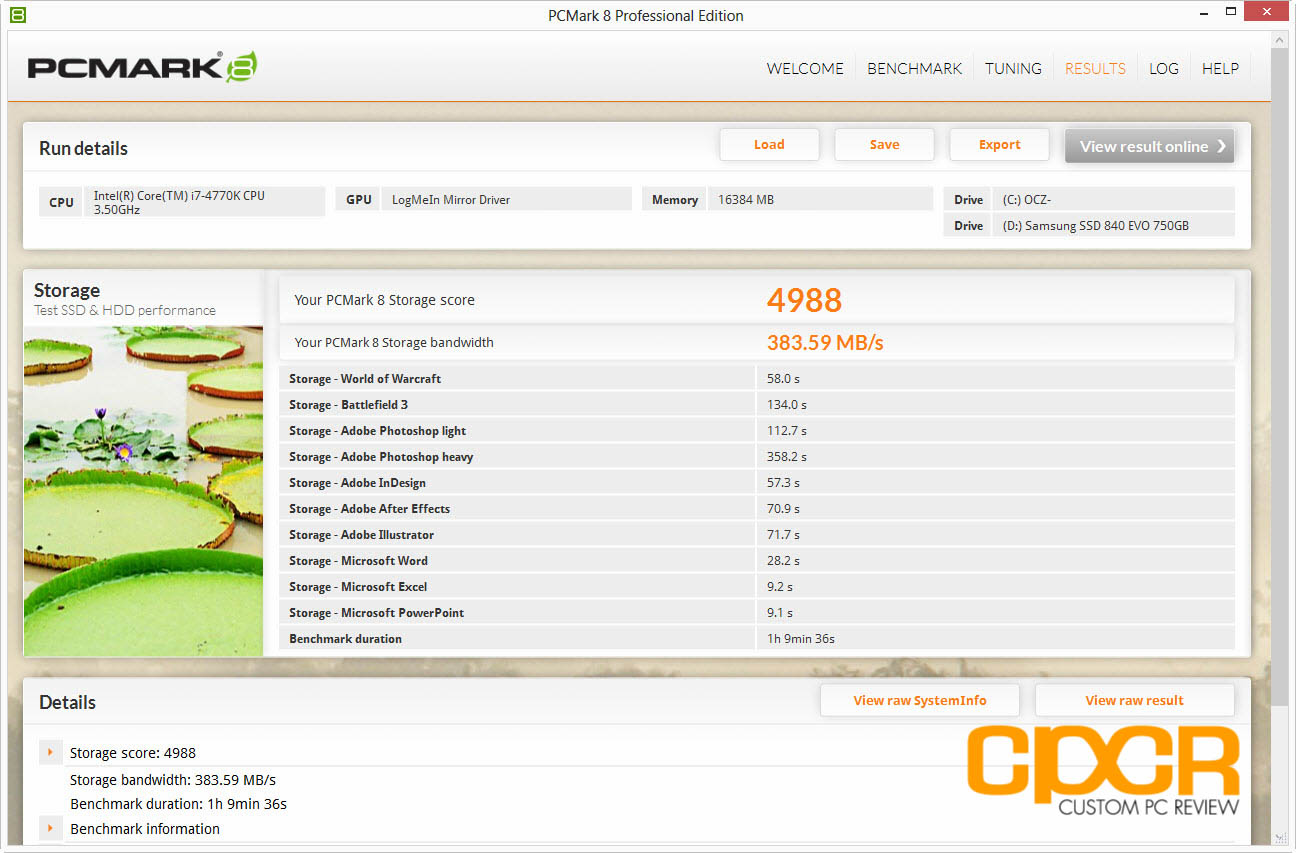
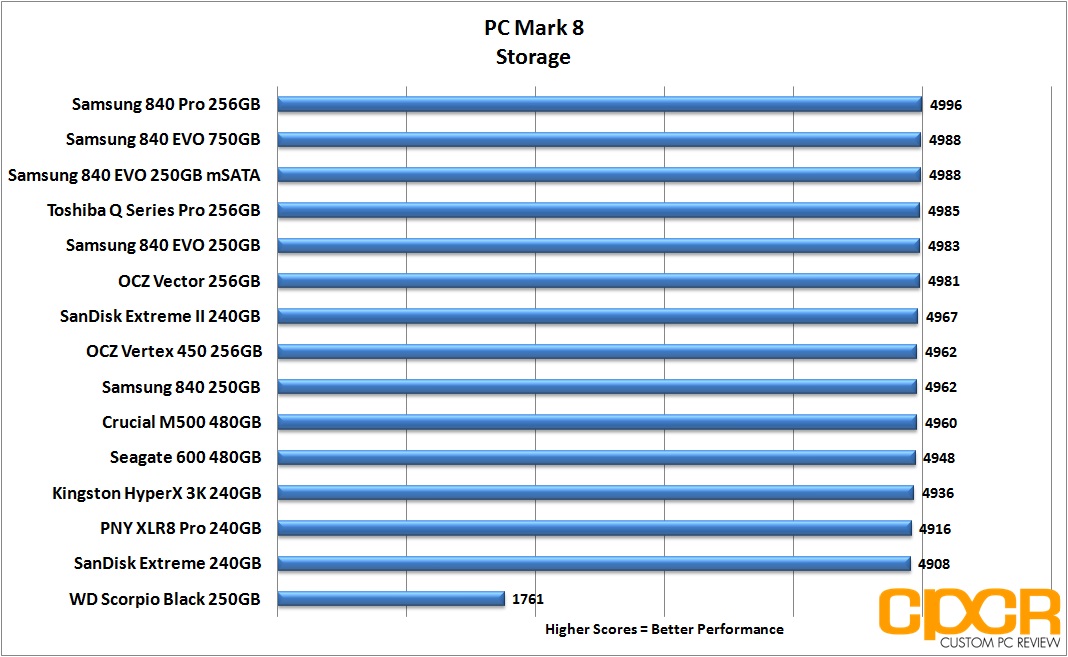
Performance Analysis
Can’t say I didn’t expect this one. The combination of superb read performance and fast, bursty write performance puts the Samsung 840 EVO 250GB mSATA right at the top of the charts. Since they carry identical hardware, scores between the mSATA Samsung 840 EVO 250GB are within points of the SATA Samsung 840 EVO 250GB.
[section label=6. FIO – FOB Testing]
Samsung 840 EVO 250GB mSATA Performance
FIO (Flexible I/O Tester)
FIO, which stands for Flexible I/O Tester, is basically what its name says – a flexible I/O tester / I/O workload generator. Whereas all the benchmarking tools we’ve used previously are fantastic, easy to use benchmarking tools that provide a good snapshot of SSD performance, they do lack a lot of versatility, especially for more complex and in-depth operations such as custom queue depths, block sizes, test run times, etc. While the testing that follows may not pertain to typical consumer usage, they do help give us a much more in-depth look at each individual product’s strengths and weaknesses when they’re pushed to the limits.
FIO – FOB (Fresh Out of the Box) Testing
When SSDs are brand new and Fresh Out of the Box, they’re generally able to perform at or outperform their advertised speeds, but unlike traditional hard drives, performance on SSDs begin to degrade over time as they become more and more used. This is because while SSDs are new, all bits on the SSD are empty, so they can instantly be programmed with data. However, once data gets programmed in, even if it’s deleted in the filesystem the actual data will still stay programmed on the NAND itself unless some sort of garbage collection routine comes in to wipe the data. Unfortunately, in order to write new data onto “dirty” NAND, the NAND needs to go first through an erase cycle to erase the old data before a program cycle can happen to program new data, which as you may imagine takes more time than just a simple program cycle. As this only happens when writing new data onto the SSD, you’ll generally see less performance degradation on reads and more performance degradation on writes.
For our FOB testing, we run a secure erase on the SSD then run each test sans any preconditioning. This will provide us with the highest level of performance the SSD is capable of and is likely never to be seen ever again once the SSD goes into a used state.
Our testing will include 4K read testing, 4K write testing, and 4K 70/30 read/write mix testing at queue depths of 1,2,4,8,16,32,64,128,256. The reason we’ve also included 4K 70/30 read/write mix testing is simply because most real world workloads will always fall somewhere between 0% write and 100% write rather than one or the other. Since client usage is much more read heavy, we’ll be using the 70/30 read/write mix.
For general client usage, performance will fall somewhere between queue depths of 1-4 whereas servers and other enterprise applications will easily see queue depths of 32 or greater.
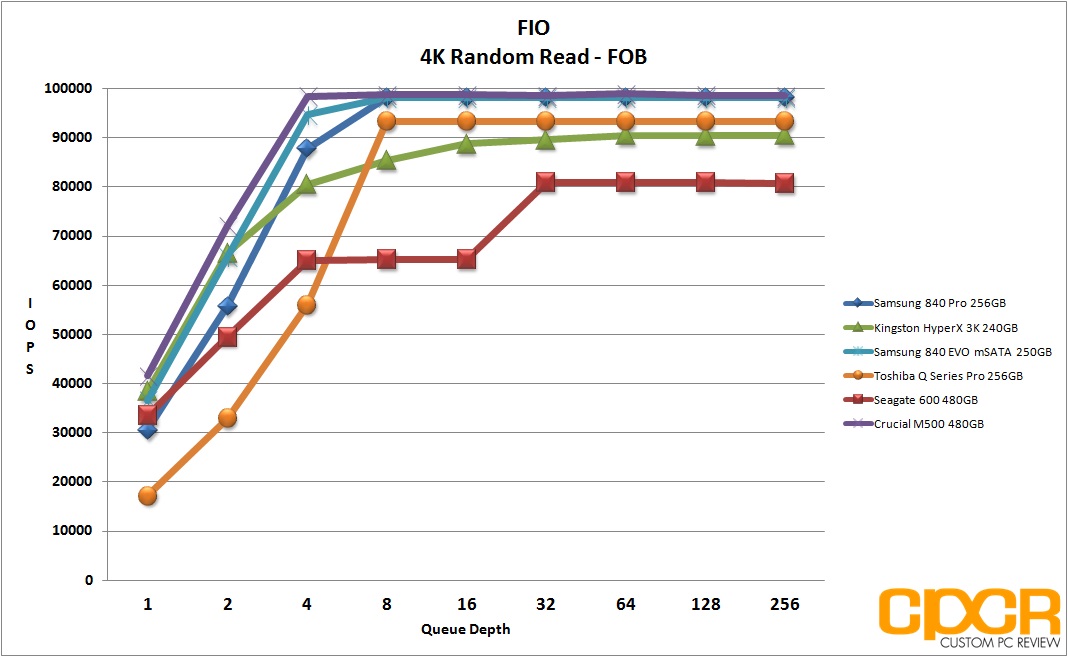
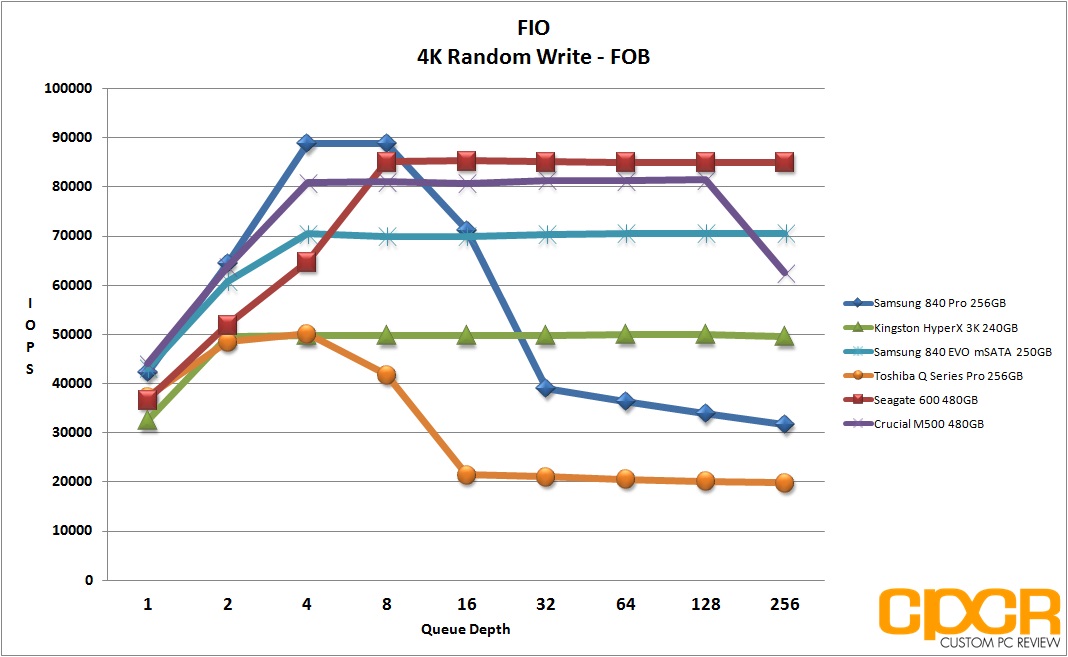
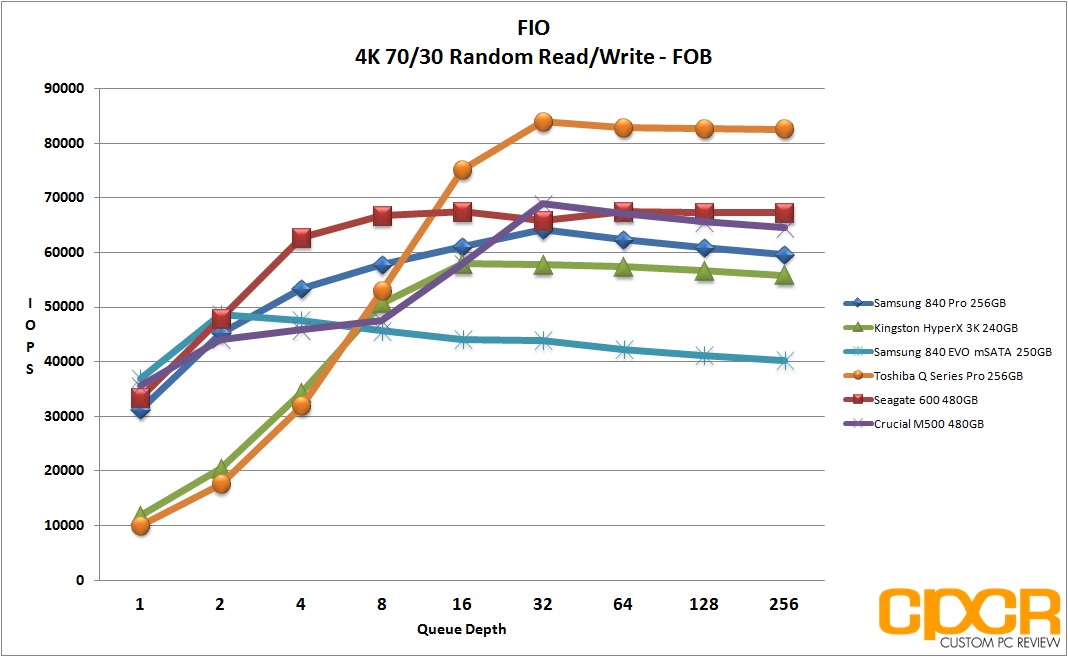
Performance Analysis
Fresh out of the box, the Samsung 840 EVO is heavily geared towards random read performance and that’s pretty much what we’re seeing here. Random 4K read performance at the higher queue depths are capable of to 98,000 IOPS and random 4K writes are capable of up to around 71,000 IOPS. Since Samsung rates the 840 EVO at 97,000 and 71,000 4K random read and write IOPS respectively, it looks like we’re doing pretty good. Let’s move on.
[section label=7. FIO – Steady State Testing]
Samsung 840 EVO 250GB Performance
FIO – Steady State Testing
After prolonged use of an SSD, they will generally reach “steady state”. The FOB state is the “best case scenario” for SSD performance while “steady state” is going to be your worst. Here, we ran the exact same set of benchmarks we just completed in the FOB state; except this time around, we’ll be preconditioning the drive by filling 100% of the drive’s LBAs with two sequential passes of 128k data, hammering the drive with two full passes of random 4K data for six hours, then conducting our actual testing.
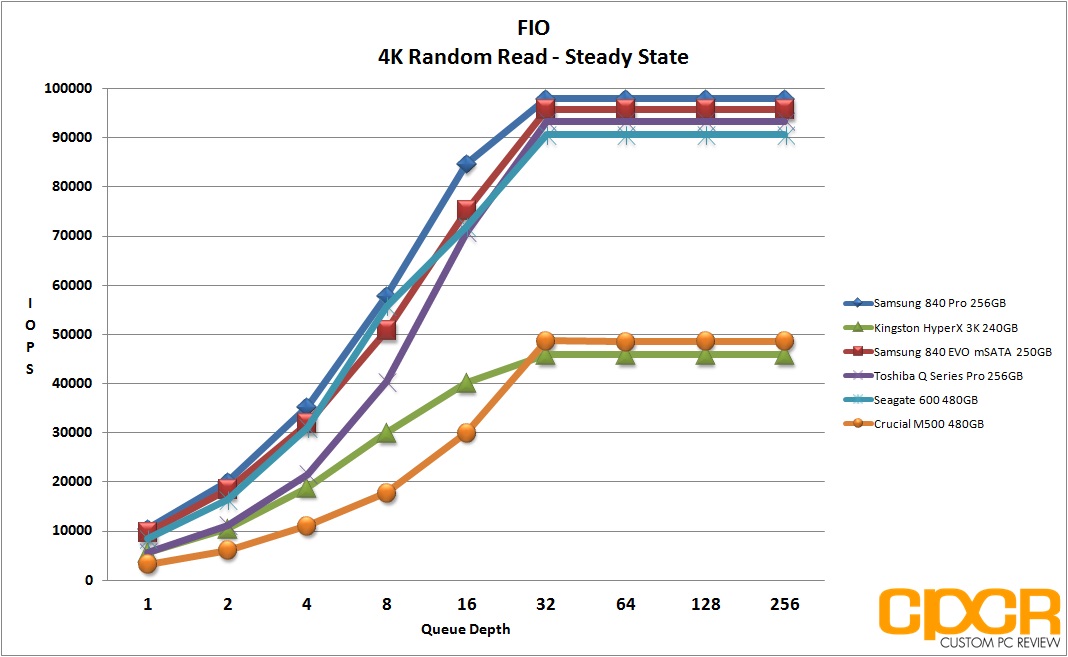
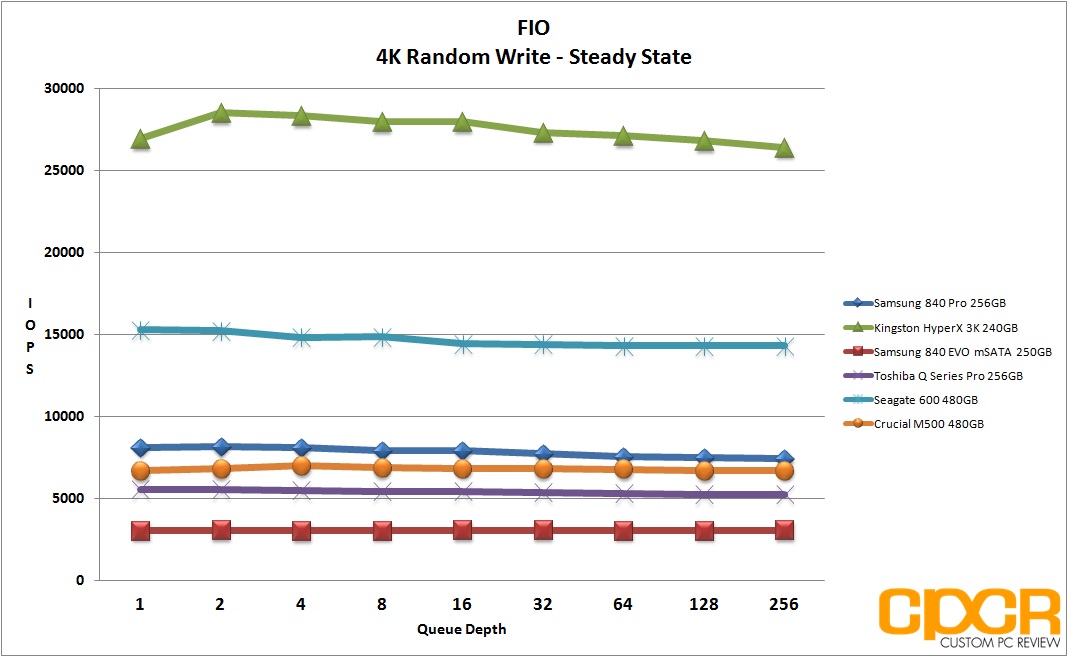
Performance Analysis
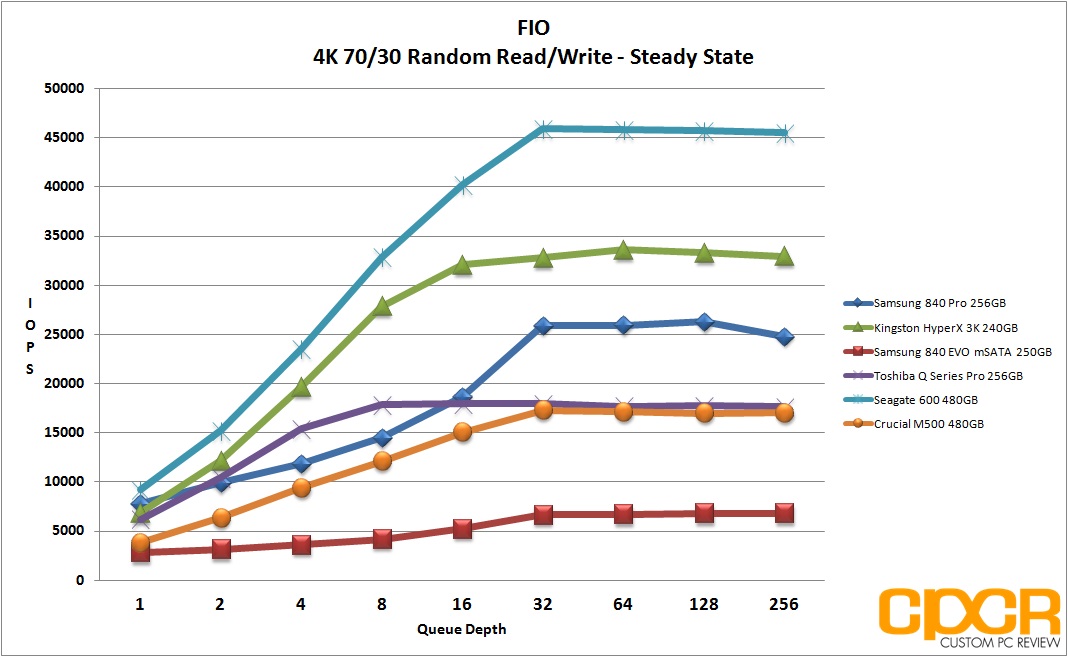
Because steady state pushes the limits of the controller and NAND, it’s very easy to see the inherent shortcomings in the NAND. Samsung’s 128Gb TLC is very, very highly optimized for read performance and even in steady state, it’s capable of driving well over 90,000 4K random IOPS at its highest point. No problems there.
Writes on the other hand don’t fare nearly as well. With the TurboWrite cache expended, the Samsung 840 EVO 250GB drops down to its baseline level of performance which is only capable of around 3,000 4K random write IOPS, a little less than half of the performance of Samsung 840 Pro 256GB. Of course, in a typical client situation, it’s very unlikely that a Samsung 840 EVO would ever see this type of load on the drive, but it’s always nice to get an in depth look at how the controller behaves as well as the NAND’s performance characteristics.
[section label=”8. FIO – 4K Random Write Consistency”]
Samsung 840 EVO 250GB mSATA Performance
FIO 4K Random Write Consistency Testing
Another one of the benefits of testing with FIO is the flexibility of running consistency tests, which is one of the most important metrics when considering SSDs going forward. Looking at the results of our benchmarks such as ATTO Disk Benchmark and Crystal Disk Benchmark, we can see that practically every top tier SSD is capable of saturating SATA 6Gb/s in the FOB state. However, what really differentiates these SSDs is their ability to hold a certain level of performance even after extended periods of use.
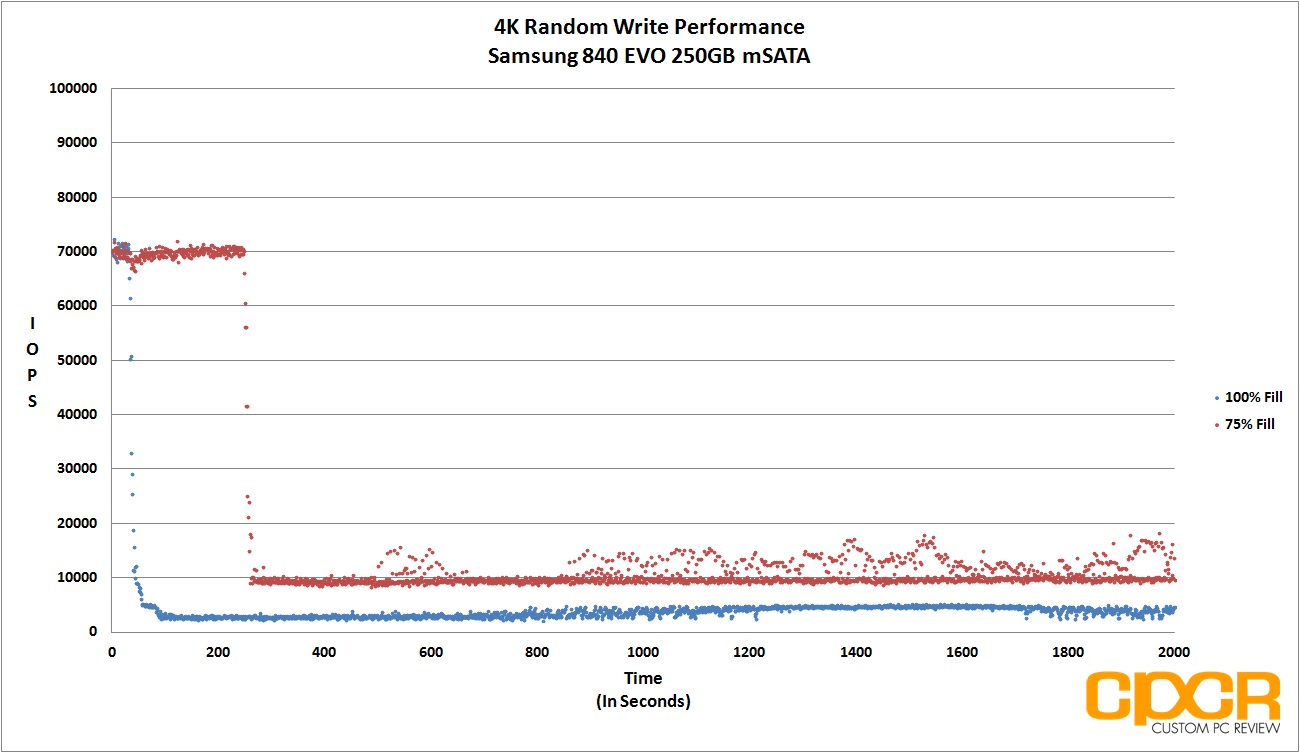
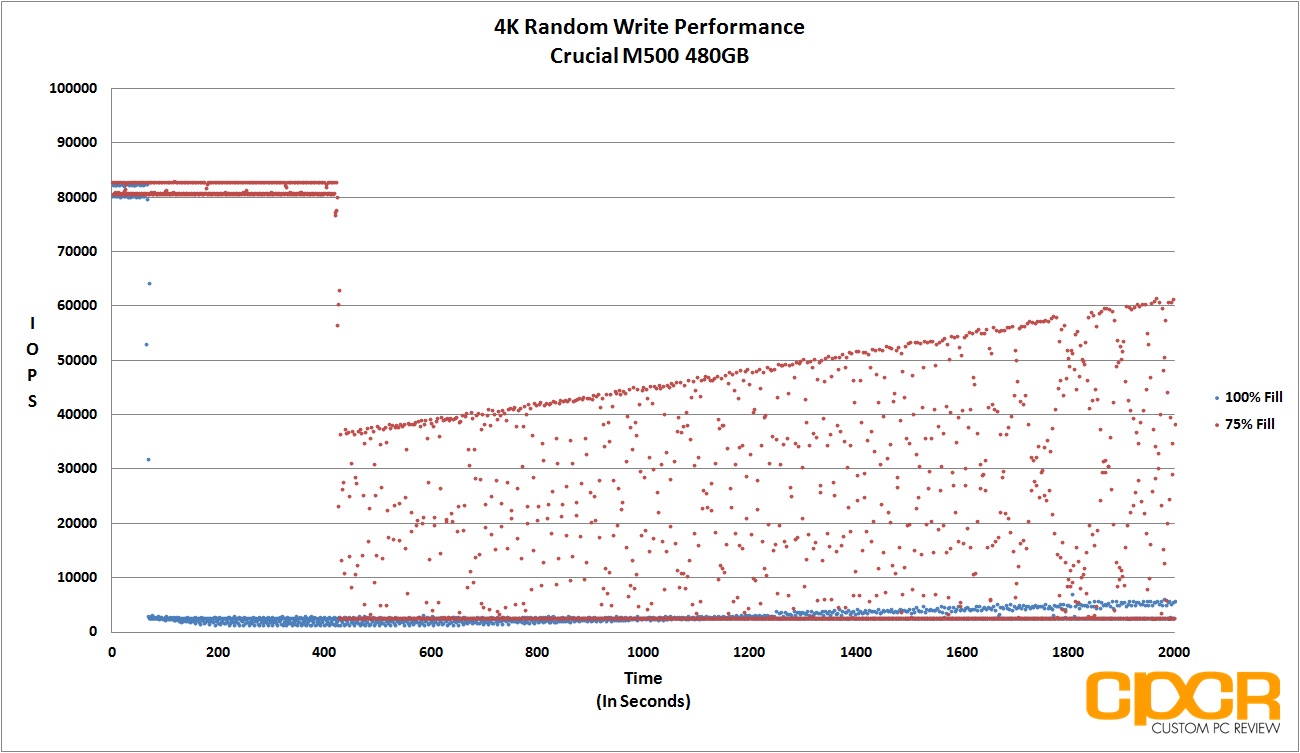
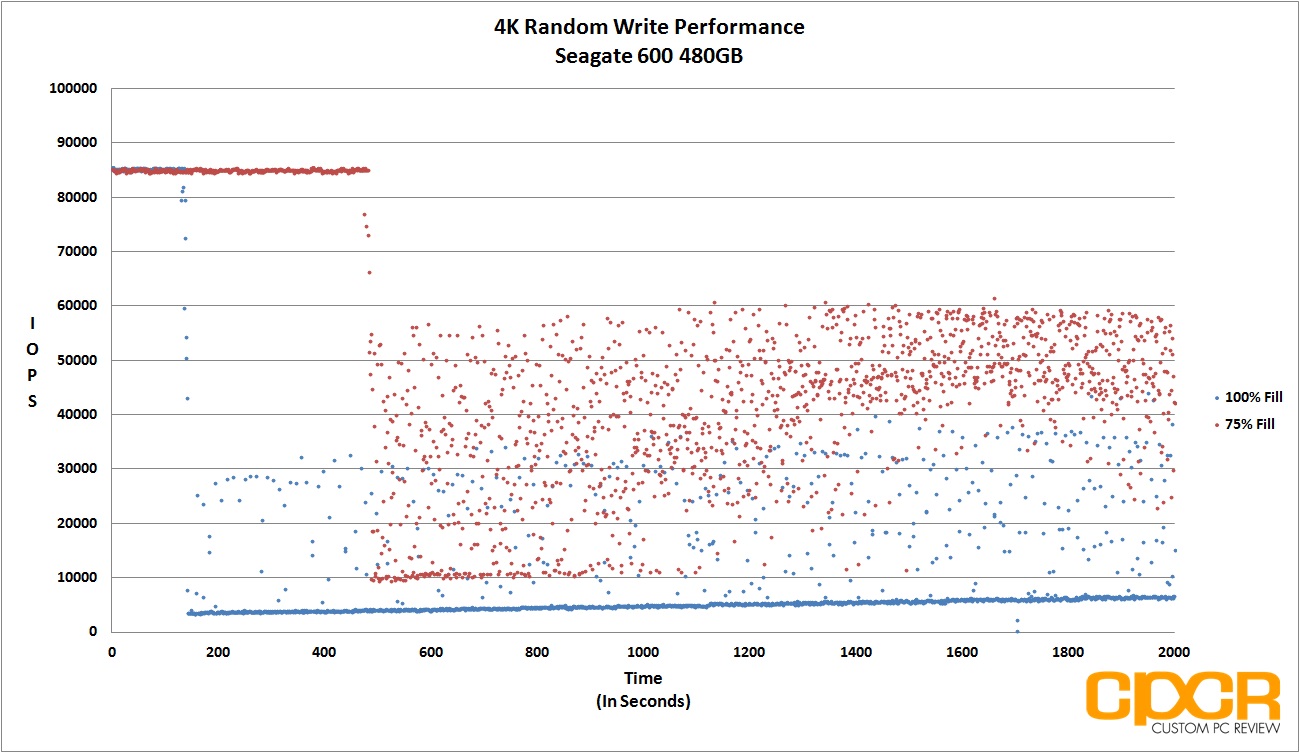
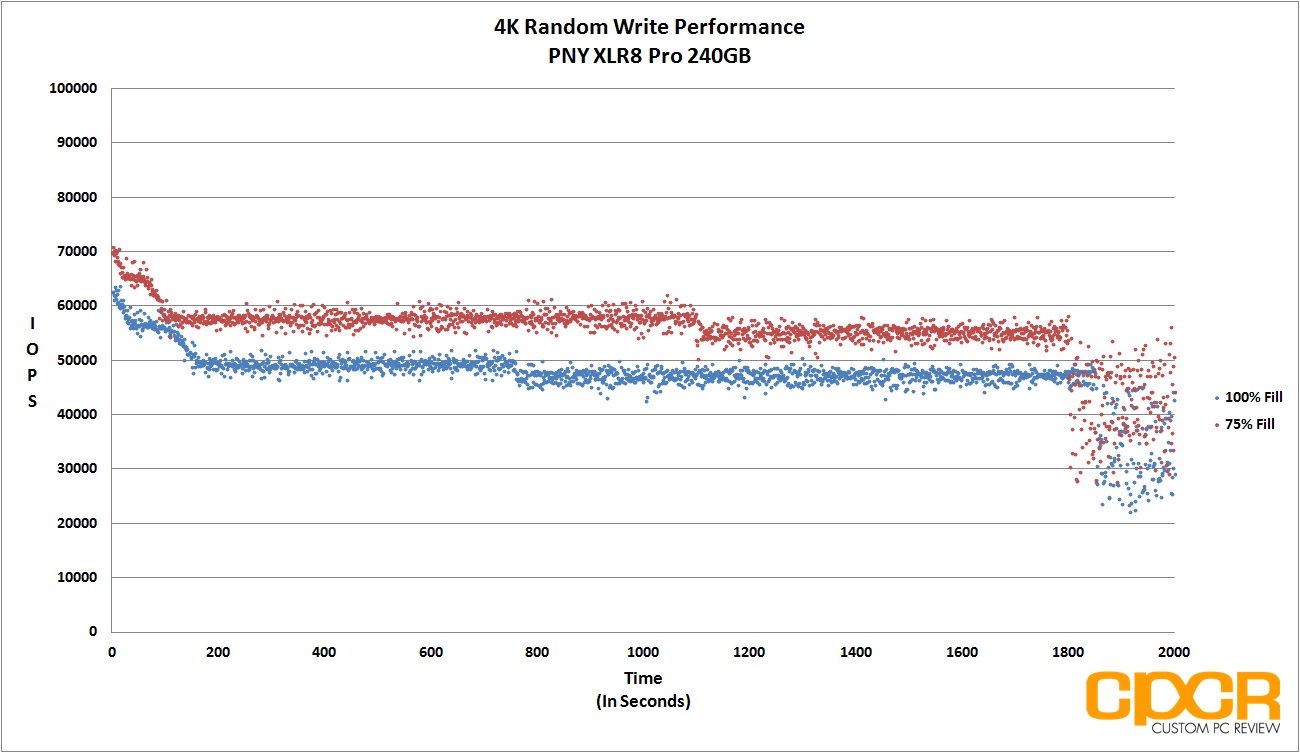
For our consistency testing, we used a fairly standard method, which includes both filling up 75% of capacity (consumer use) as well as 100% capacity(enterprise use) twice with sequential 128k data followed by the actual test itself, which is simply running 4K random writes at a queue depth of 32. By recording the IOPS every second for 2,000 seconds, we’re able to get a good look at what kind of performance can be expected when the drive is relatively new, when it’s heading towards steady state, and when it’s actually in steady state.
[tabgroup]
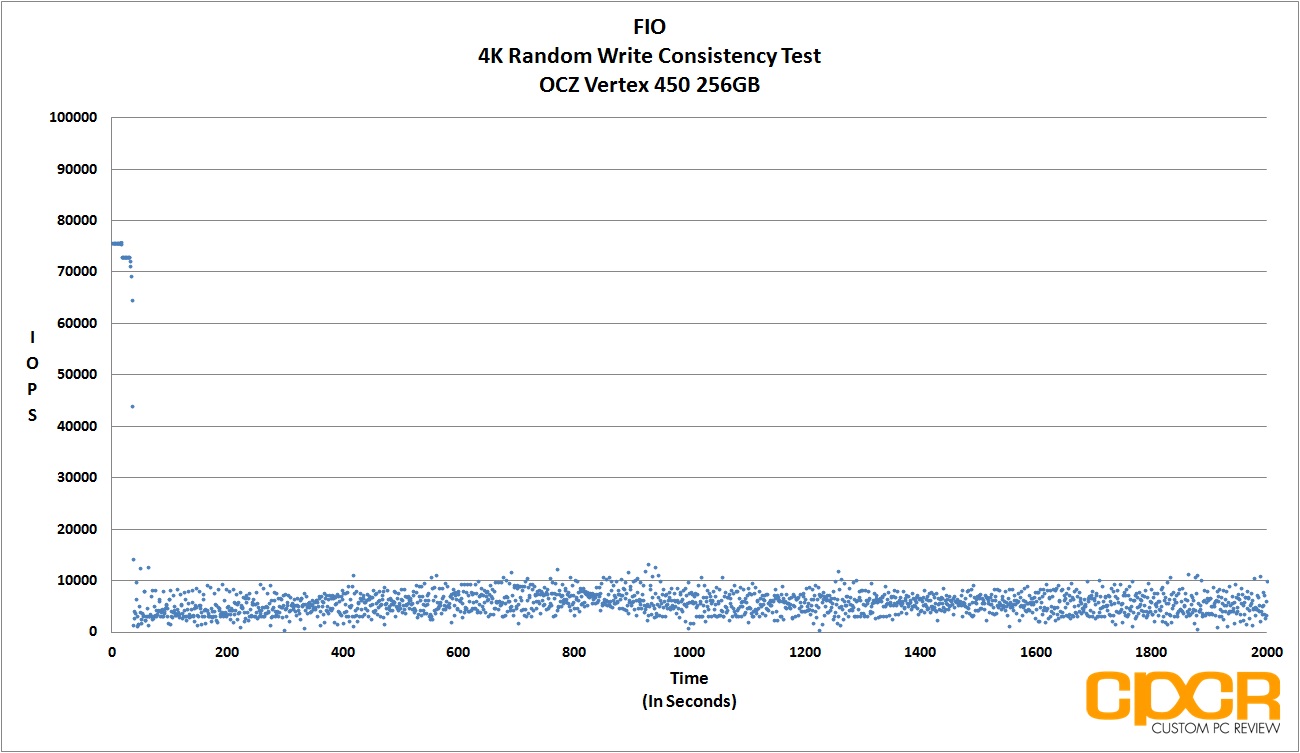
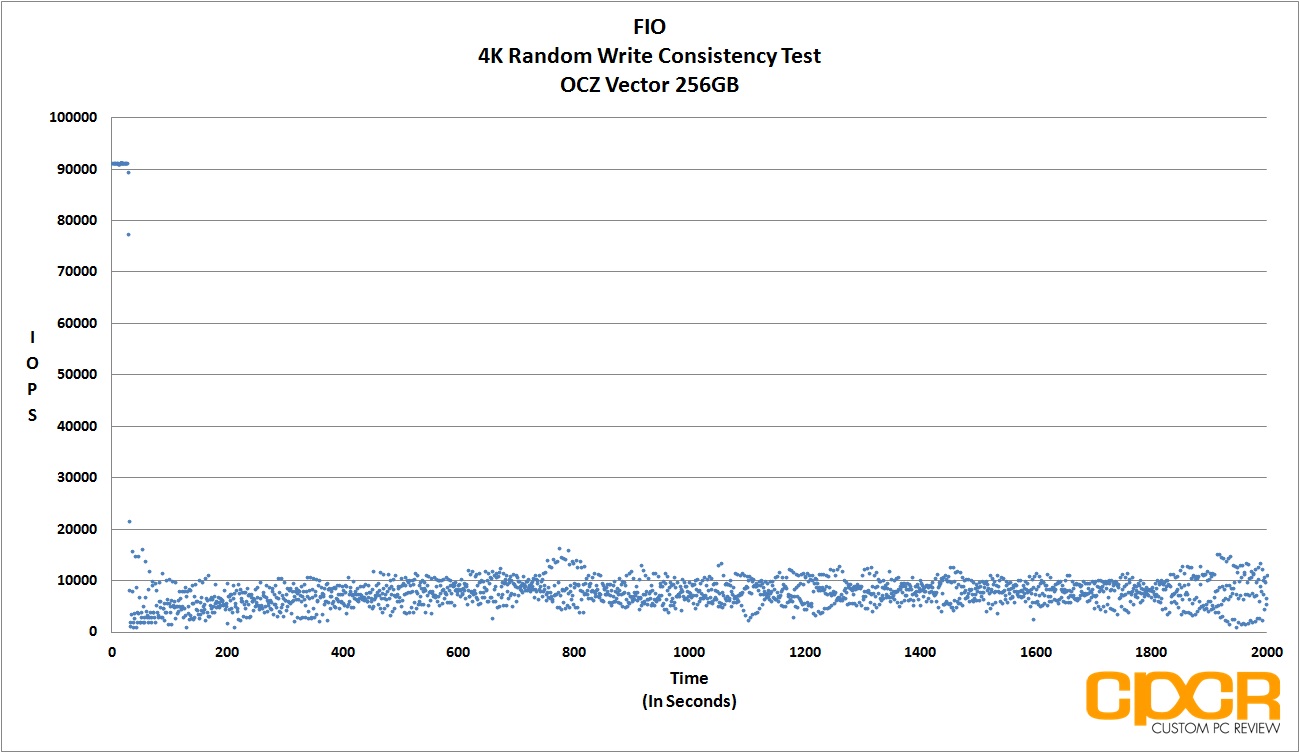
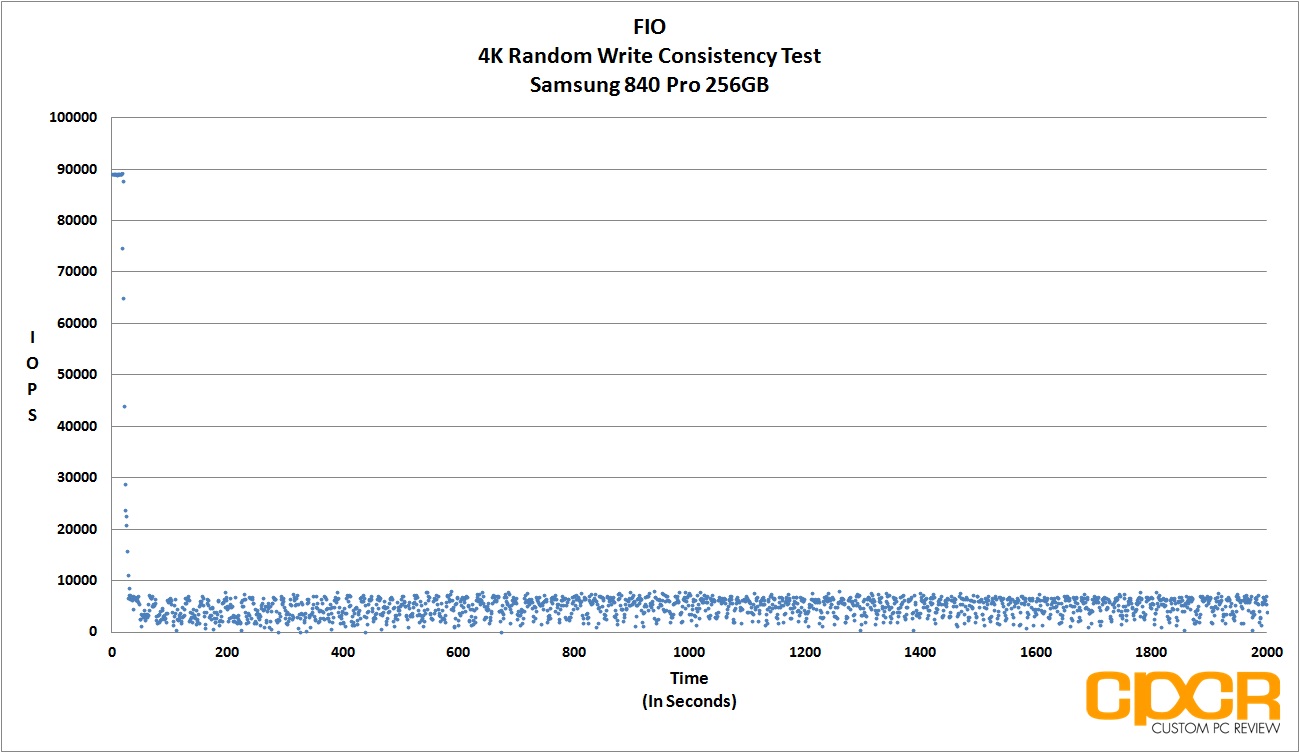
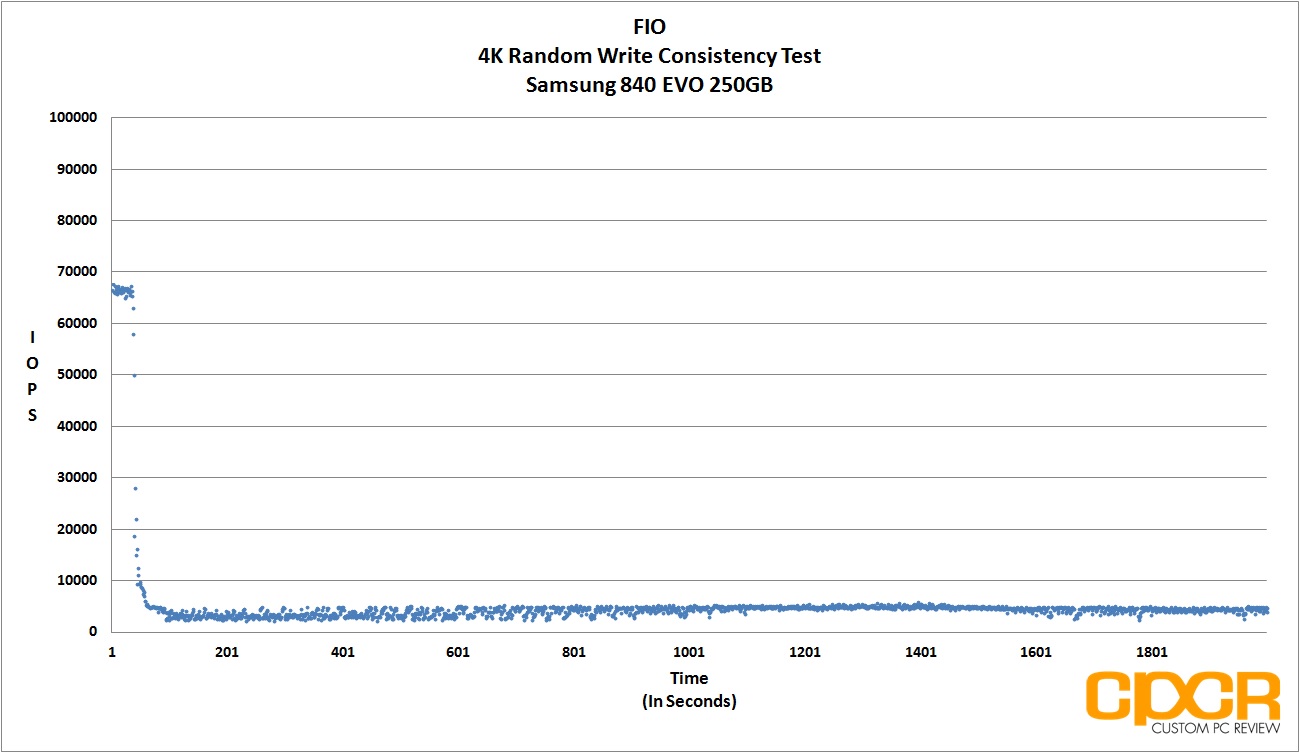
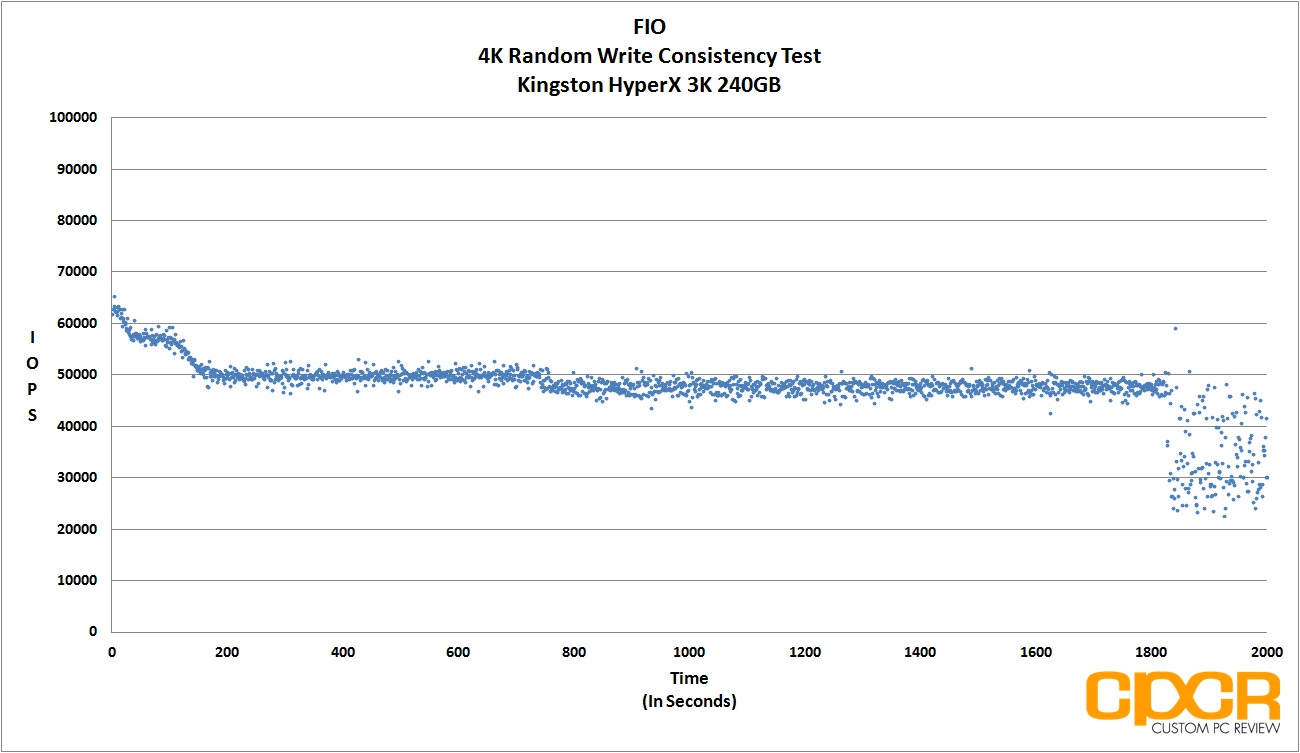
Performance Analysis
Samsung drives haven’t always had the best performance consistency around, but it’s actually not too bad on the Samsung 840 EVO mSATA. In our testing with 100% user addressable space used up, after the initial drop in performance after TurboWrite, the Samsung 840 EVO mSATA keeps a fairly consistent performance profile, which it manages to improve in time.
Performance here in steady state isn’t all that impressive, but I do like how Samsung has improved consistency going to the Samsung 840 EVO mSATA/SATA from the Samsung 840 Pro. This more than likely has to do with a slightly tweaked firmware and Samsung’s implementation of the newer, faster and more powerful Samsung MEX controller on the Samsung 840 EVO. It probably helps that the Samsung 840 EVO has that 6GB TurboWrite/over-provisioning space as well for good measure.
What’s better though is the Samsung 840 EVO’s performance consistency when only 75% of user addressable space is used. Not only is performance more consistent, but it’s also decently high. I’d definitely recommend those using Samsung 840 EVOs to keep at least 25% of the drive’s capacity free if at all possible.
[section label=”9. FIO – 4K Random Write Latency”]
Samsung 840 EVO 250GB mSATA Performance
FIO 4K Random Write Latency Testing
Another metric that’s becoming increasingly important in SSDs is its ability to keep latency low despite being subjected to a heavy workload. Even if a SSD were capable of ultra high and ultra consistent IOPS performance, if latency were high, users would still feel that the drive is slow. Ideally, SATA SSDs should always be capable of latencies under 50ms, even during heavy workloads.
For latency testing, we’ll be using the exact same testing parameters as IOPS consistency testing, except instead of recording IOPS every second, we’ll be recording latency.
[tabgroup]
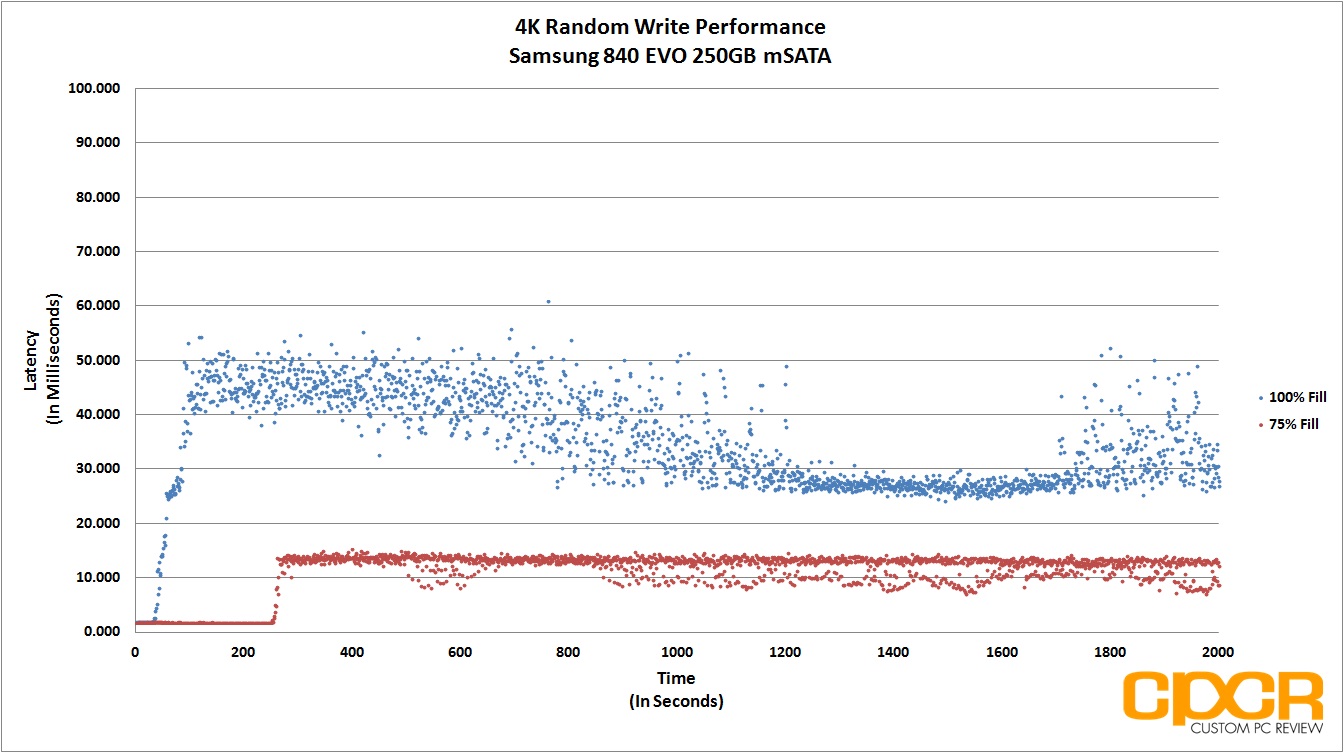

Performance Analysis
Latency consistency on the Samsung 840 EVO 250GB mSATA is acceptable although at 100% fill, it’s not all that great. Samsung does manage to keep latencies under the 50ms mark for the most part which is fine for a consumer oriented SSD.
Reducing the amount of user addressable space taken up, the 840 EVO mSATA actually does very, very well to keep latency low. Latencies are kept under 13ms at all times, which should mean a very consistent, very high quality user experience even after extensive use.
Looking at these performance figures, I feel like Samsung should’ve probably taken another 10GB or so on the 250GB edition and set it aside for over-provisioning. Although it might not be totally needed to help improve TLC durability, over-provisioning seems to be a very effective means of improving sustained performance on the Samsung 840 EVO.
[section label=10. RAPID Mode]
Samsung 840 EVO 250GB mSATA Performance
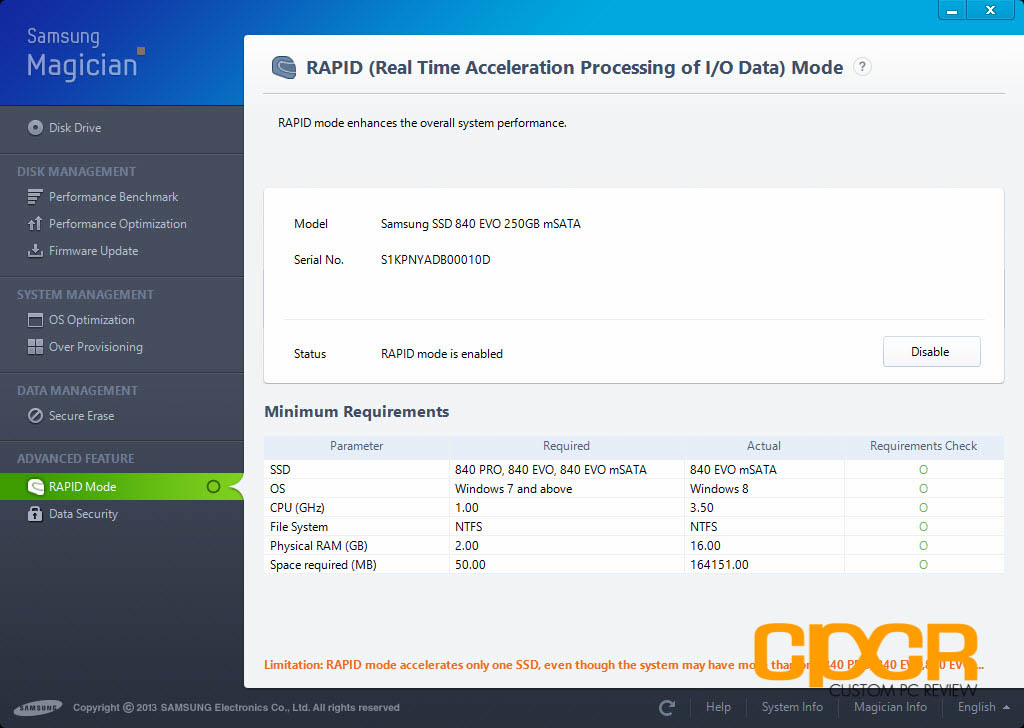
RAPID Mode
RAPID mode stands for Real-time Accelerated Processing of I/O Data mode, which is a feature that was unveiled to us when Samsung introduced the 840 EVO earlier this year. RAPID mode allows leveraging of the host system’s extra CPU/memory resources as a cache in order to help increase SSD performance. For more information about RAPID mode, we’ve covered it a lot more in depth in our original review of the Samsung 840 EVO.
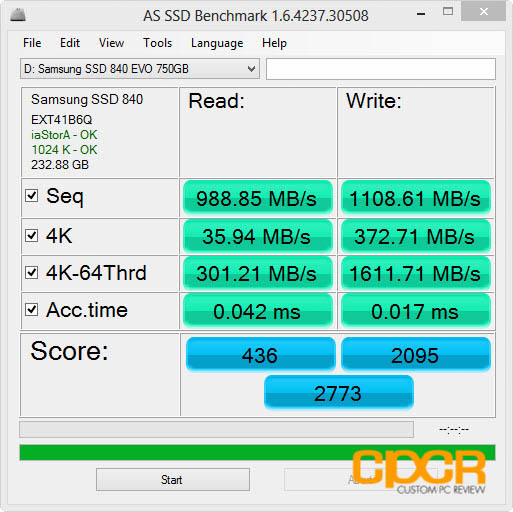
AS SSD
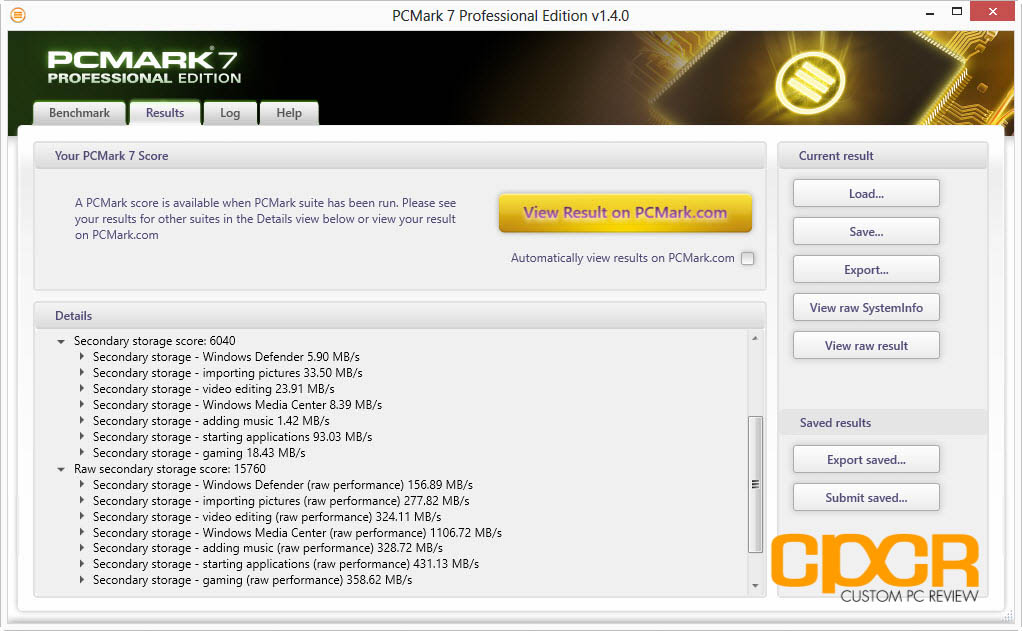
PC Mark 7
Performance Analysis
Yup. It’s still working like I remember it. 1,108.61 MB/s sequential writes and 988.85 MB/s sequential reads in AS SSD and 6040 points in PC Mark 7, a whopping 569 points higher than performance with RAPID mode off. Just absolutely stunning.
[section label=11. Power Consumption]
Samsung 840 EVO 250GB Power Consumption
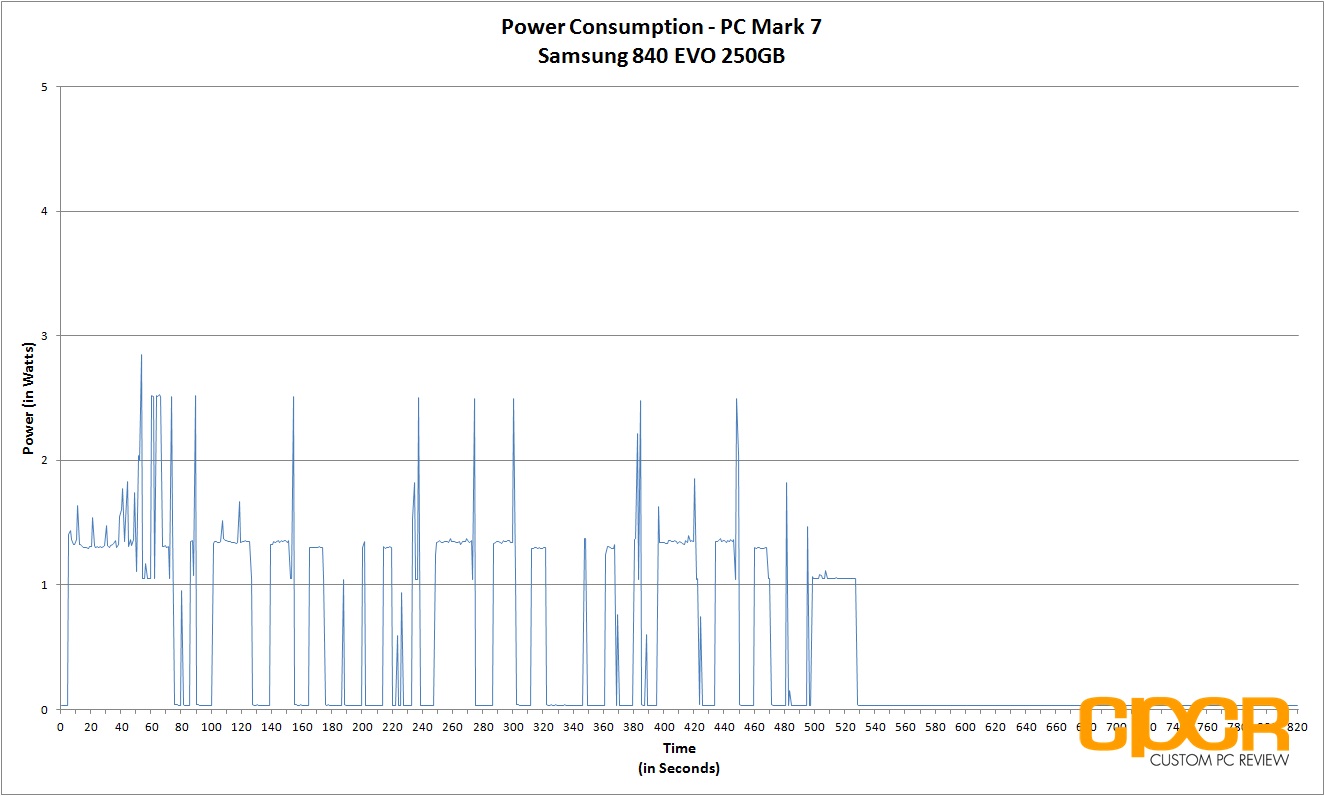
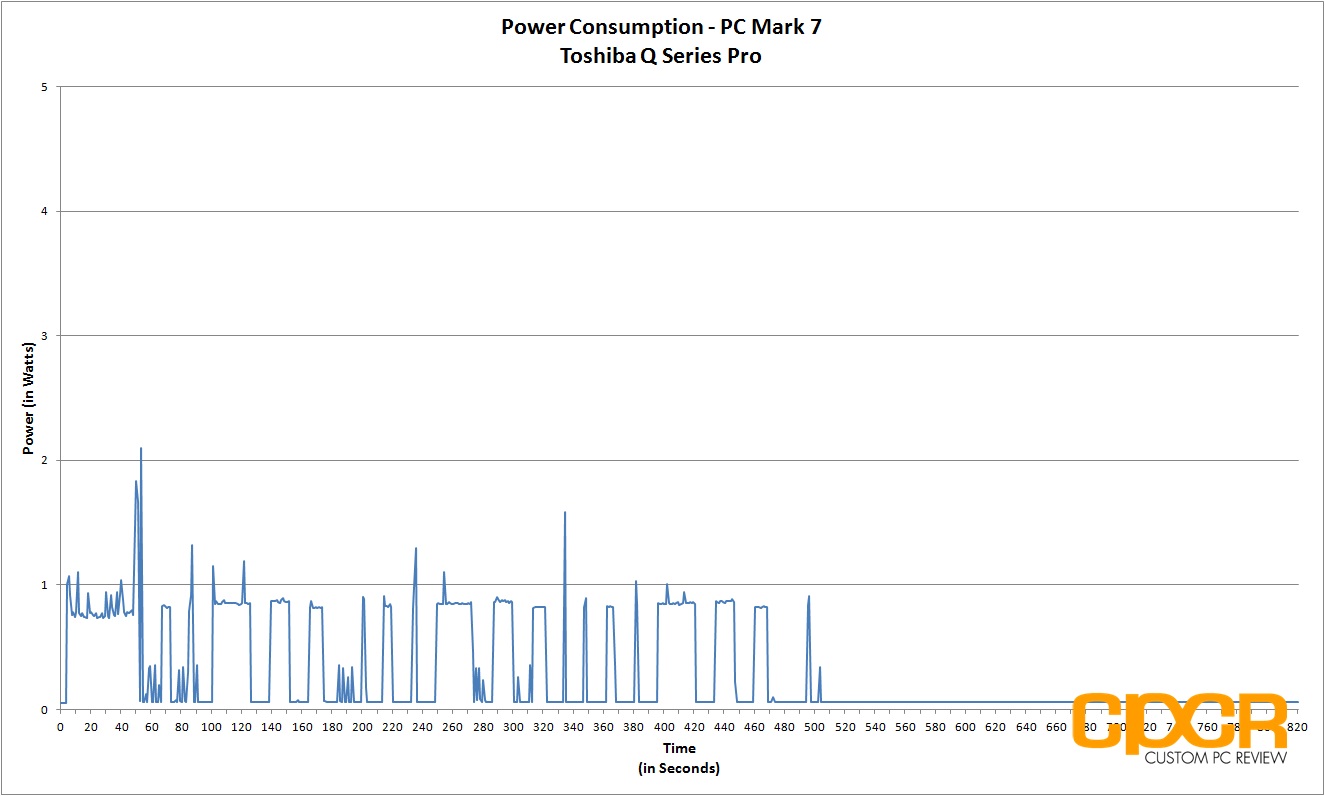
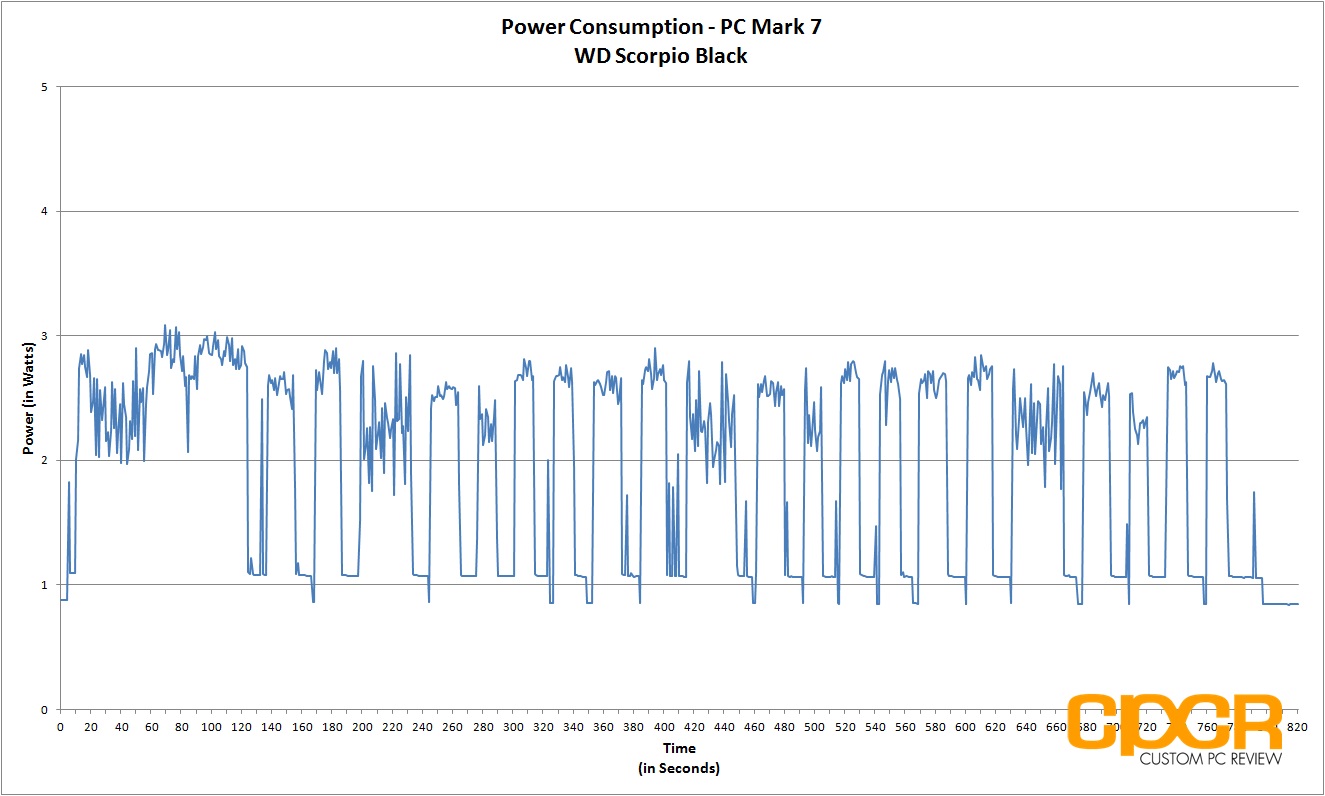
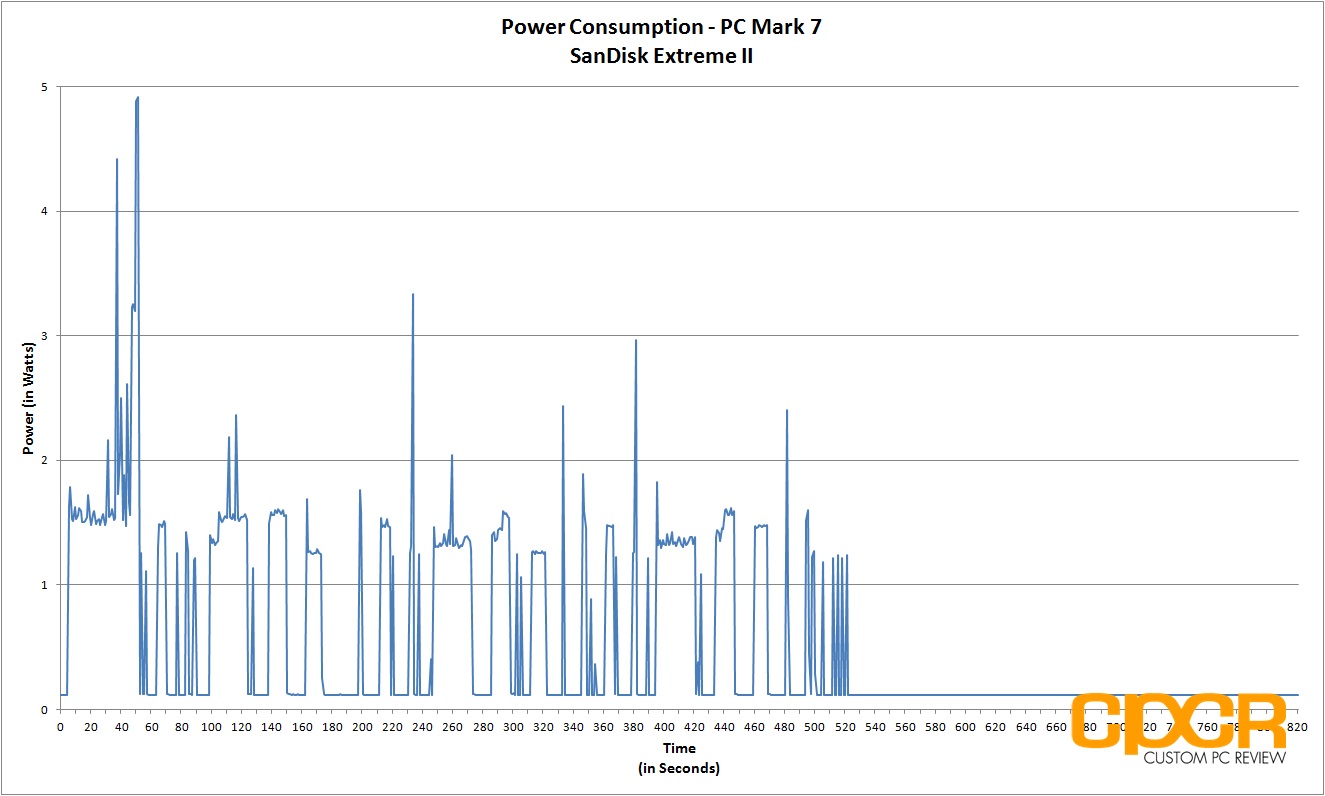
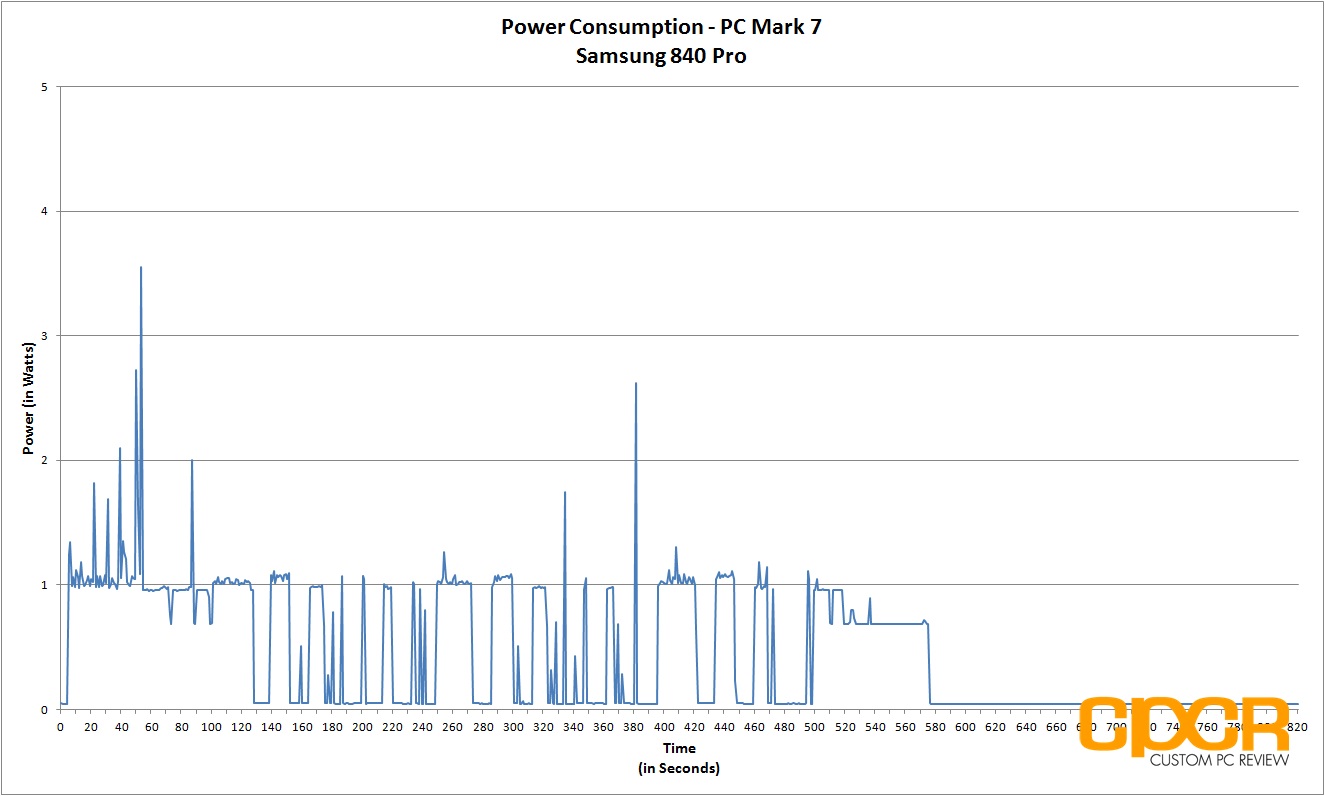
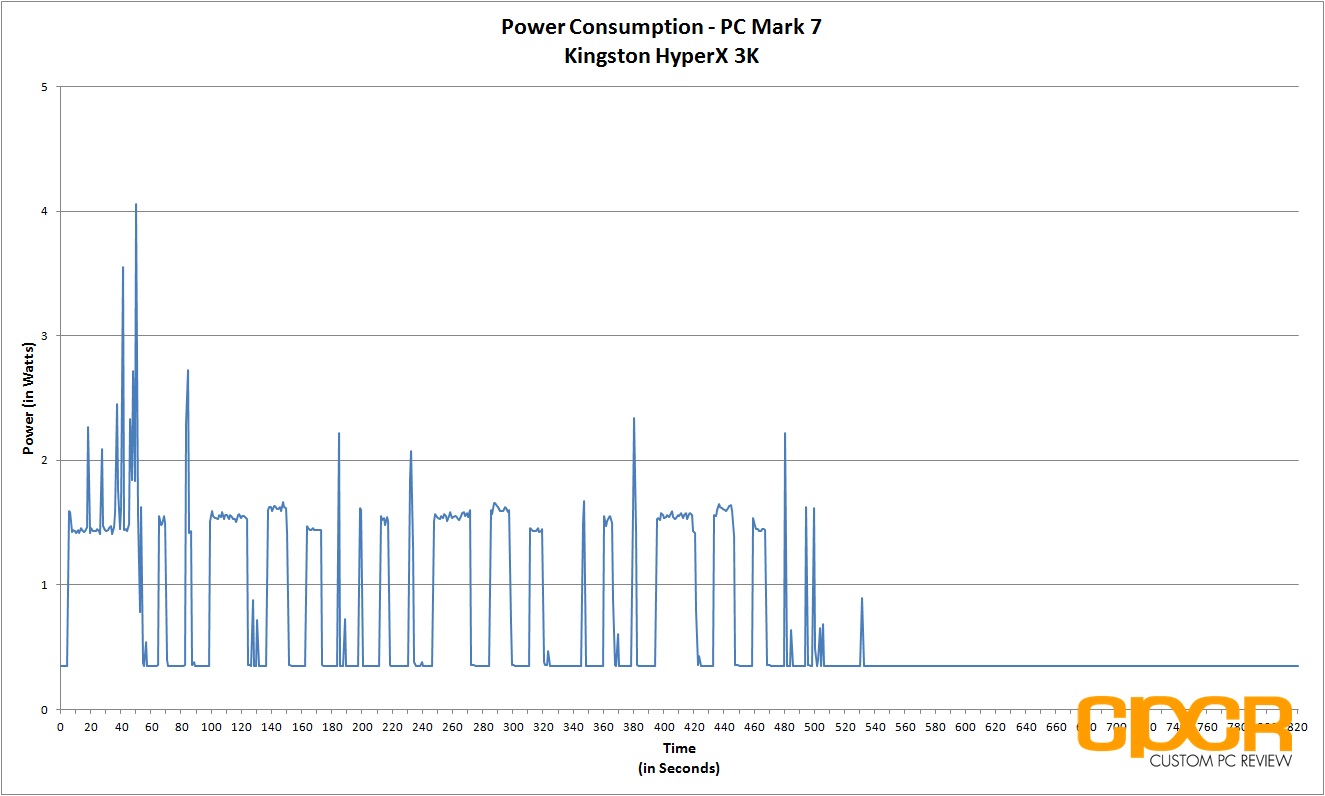
Previously, our power consumption analysis only tested for idle and maximum load power consumption, but we felt that this was a bad way to accurately measure power consumption. The reason for this is because SSDs tend to be bursty while in operation and will spike in power usage, but only for very short periods of time. As such, many of our SSDs appeared to have even higher power consumption than traditional hard drives, which is untrue.
In order to improve our reading of power consumption, our solution was to run a test closer to the real-world and record a trace on the power consumption during testing. Since PC Mark 7 has been recognized by the industry as a fantastic real-world benchmark, we’ll be running our power consumption test while running the benchmark.
All tests below are measured by tapping our calibrated B&K Precision 5491B Bench Multimeter tapped directly into the 5v line running from the power supply to the drive. All testing here is conducted with “HIPM (Host Initiated Power Management)/DIPM (Device Initiated Power Management)” enabled and “AHCI Link Power Management – Adaptive” set to 0 milliseconds for maximum power efficiency.
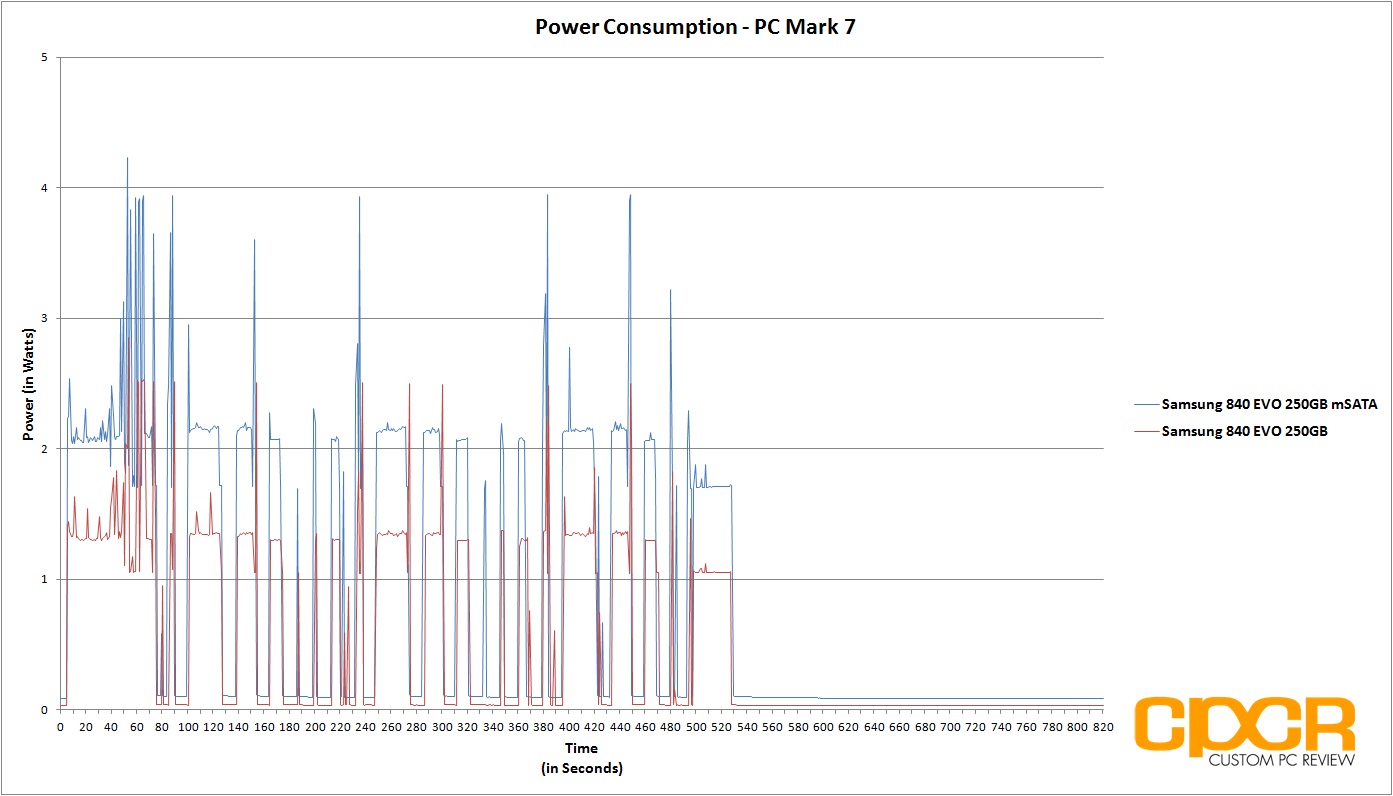
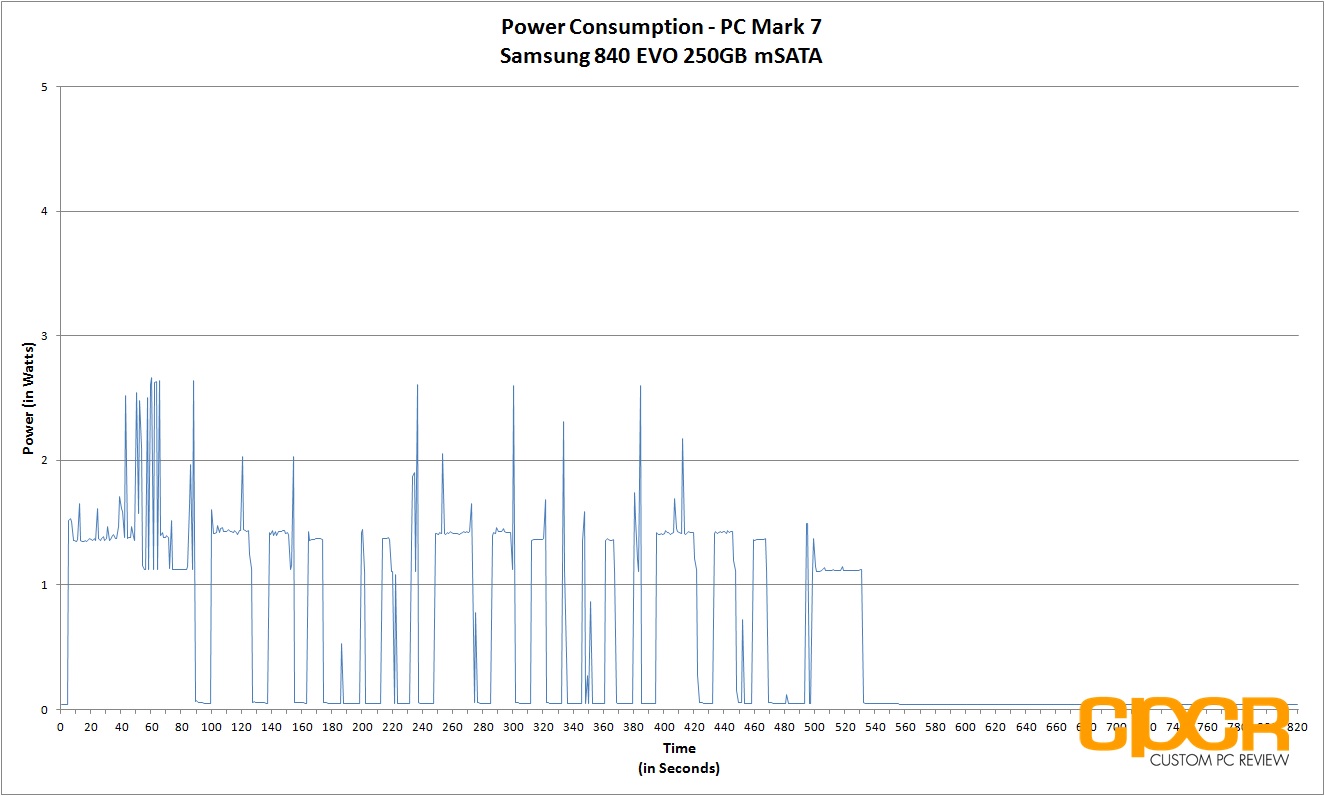
In order to test the Samsung 840 EVO mSATA 250GB SSD, we have to use an adapter to make it compatible with our test system. Unfortunately, as we’ve explained in our testing setup section, it throws off power consumption readings as the adapter utilizes a 5v to 3.3v line voltage regulator to supply power to the SSD. As a line voltage regulator acts like a resistor to reduce voltage, it introduces resistance, which requires more power for the circuit.
That said, we were lucky enough to have a Samsung 840 EVO 250GB SATA drive on hand, which we’ll be referring to for our power consumption testing. Above we ran the PC Mark 7 benchmark on both the mSATA 840 EVO and the SATA based 840 EVO. As far as I can tell, there’s absolutely no difference in the way the way the two SSDs draw power, so the Samsung 840 EVO mSATA and the Samsung 840 EVO SATA should draw identical amounts of power. For our purposes here, we’ll be referring to the power consumption figures for the SATA Samsung 840 EVO until we can acquire equipment to accurately measure the power consumption on a mSATA SSD.
[tabgroup]
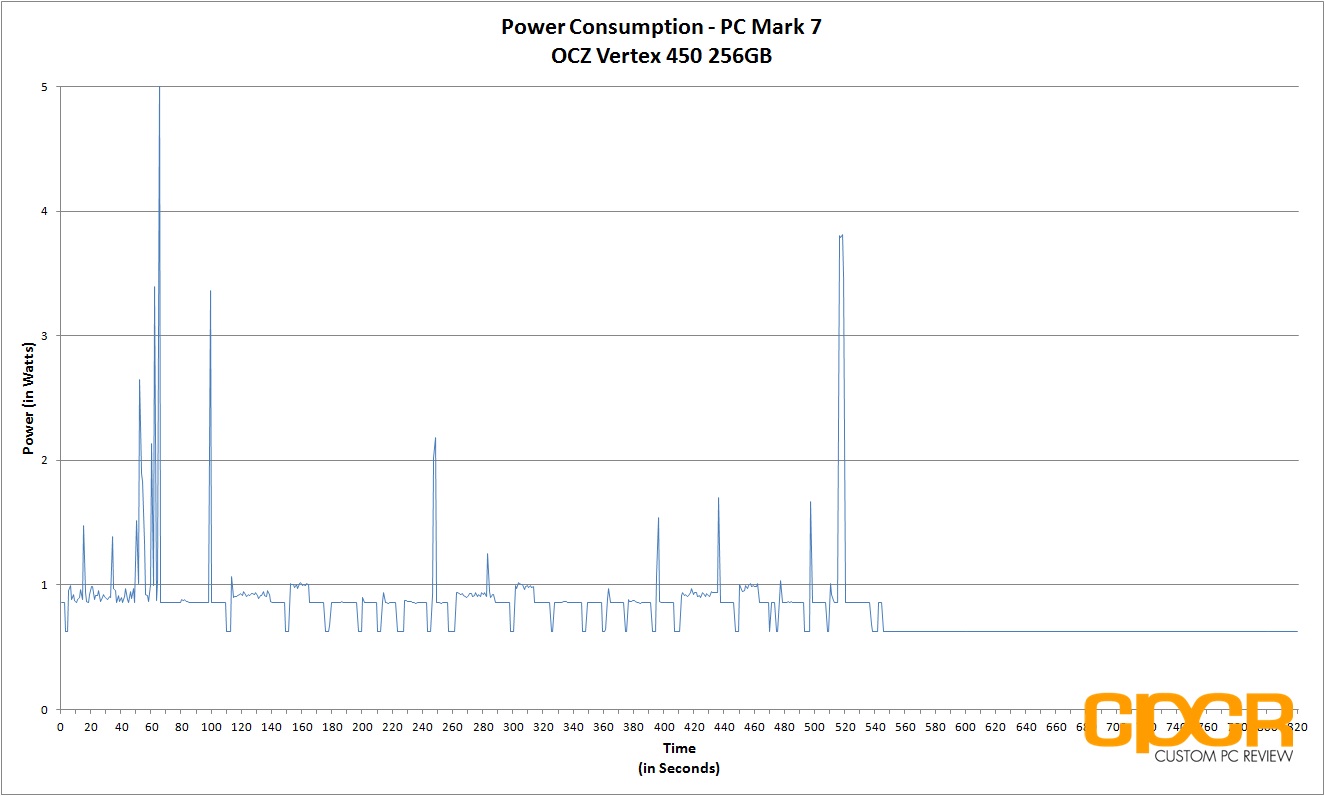

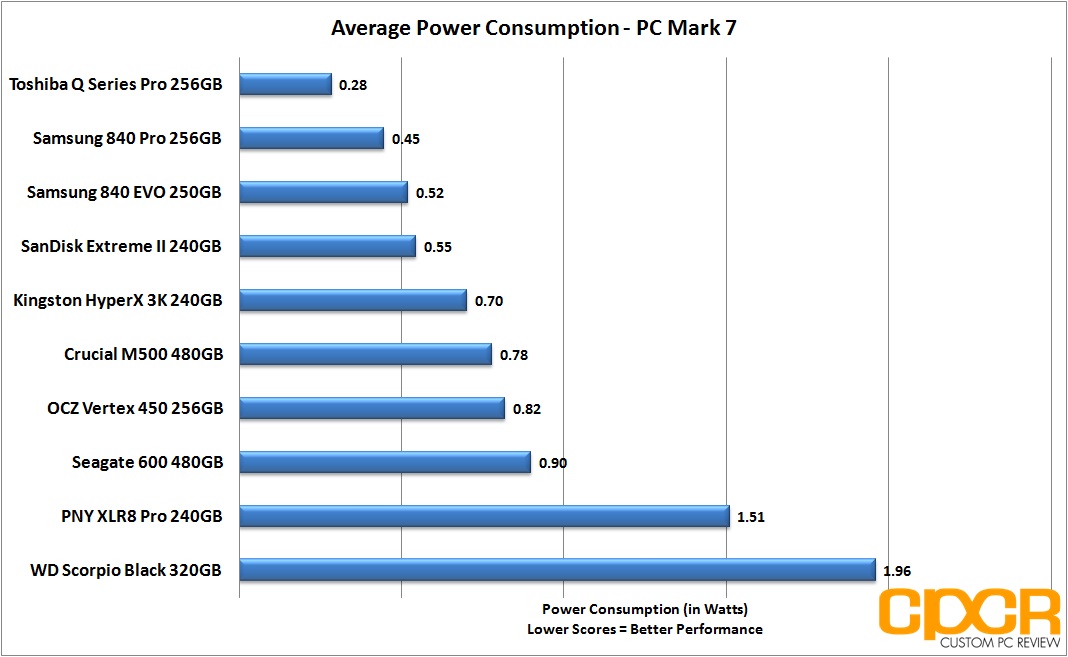
Performance Analysis
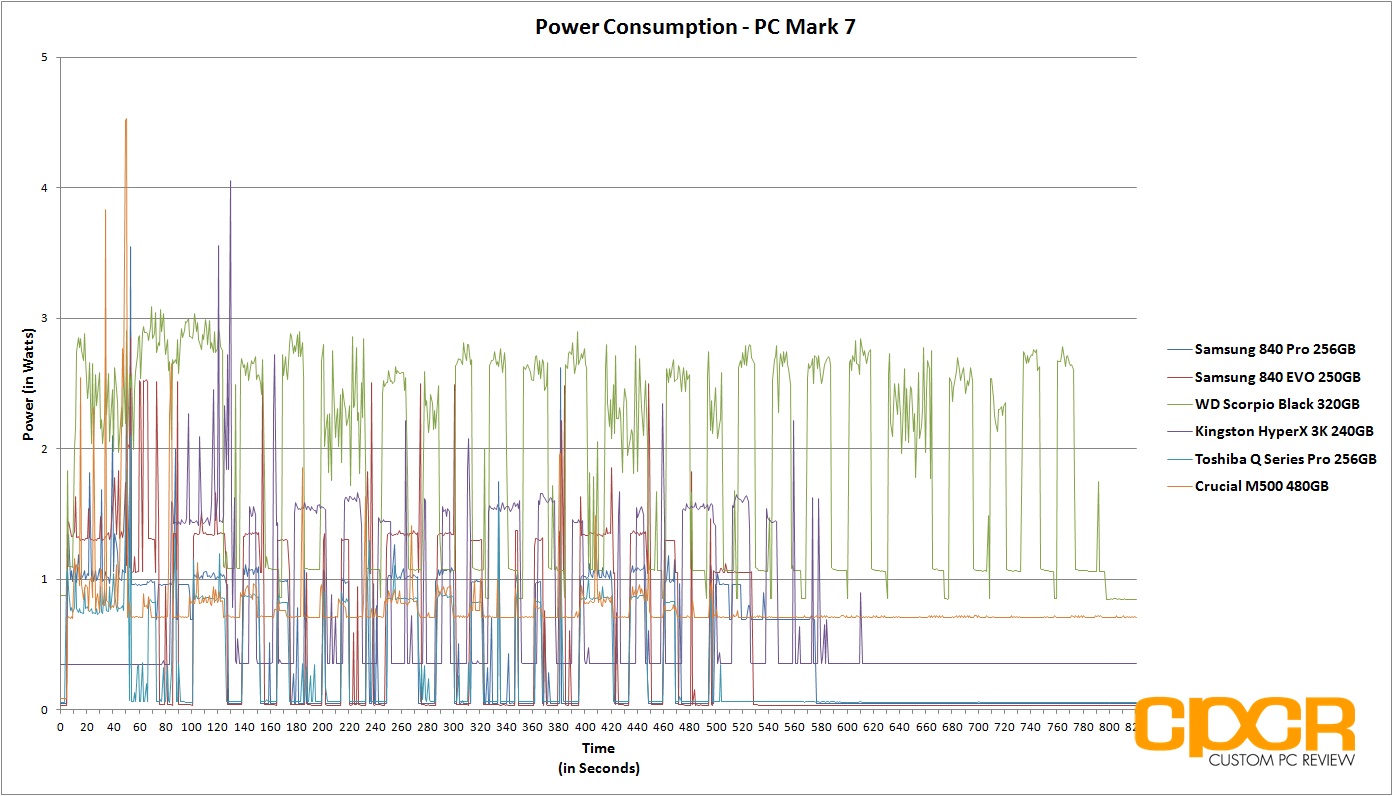
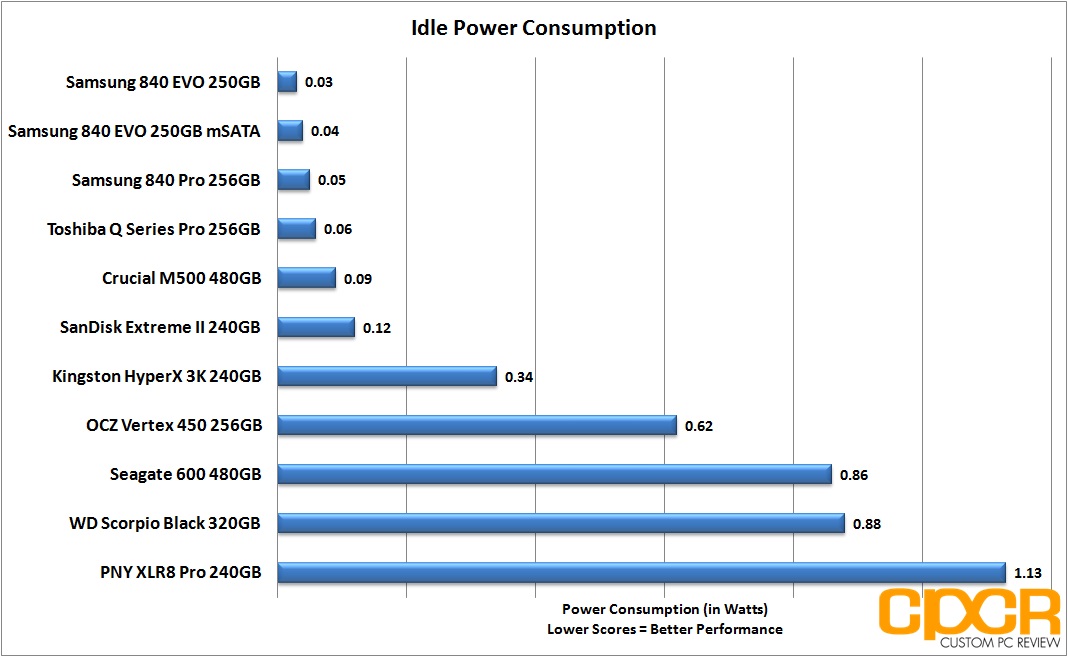
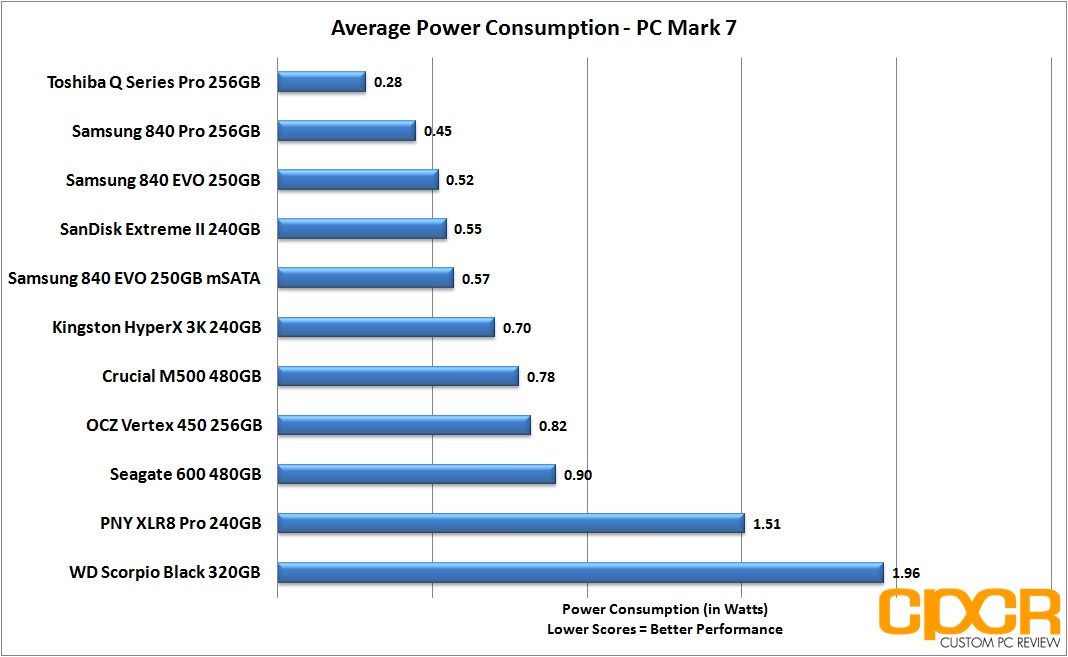
Samsung SSDs have always been leaders in power efficiency and the Samsung 840 EVO is no different. It has one of the lowest idle power draws we’ve seen to date, measuring in at only 0.03w (30mW). Under load, the Samsung 840 EVO is again one of the most efficient SSDs we’ve ever tested drawing only 0.52w on average. It’s slightly higher than the Samsung 840 Pro, which is likely attributed to the 33% higher clocked controller.
The Samsung 840 EVO mSATA, like most of the newest drives on the market, supports DevSleep, which is a power saving feature that’s been introduced with the SATA 3.1 standard. With DevSleep compatible hardware, idle power consumption can be dropped down to a mere 0.01W (10mW) or less. We’re still actively working with a number of different vendors for a DevSleep testing solution.
**Update 1/31/14**
Because our previous testing was conducted with a mSATA adapter that used a 5v to 3.3v voltage regulator, the regulator introduced some resistance into the circuit skewing our power consumption test results. For that reason, we instead relied on the power consumption testing results of the Samsung 840 EVO 250GB SATA drive which for the most part is identical to the Samsung 840 EVO 250GB mSATA.
After contacting various vendors for a SATA adapter that would directly run 3.3v SATA power to 3.3v mSATA power, we found Micro SATA Cables, who helped provide us with an adapter that was resistor free to get the most accurate power consumption testing results possible. Those interested in specialty cables, adapters, or custom designs can check out the Micro SATA Cables website or their eBay store.
Performance Analysis
In our updated power consumption charts, the Samsung 840 EVO 250GB mSATA is still among the best in both idle and active power draw. We measured results that are marginally higher than the Samsung 840 EVO 250GB though, which may possibly be attributed to the fact that I’m using an adapter, which could introduce slight amounts of resistance. That said, idle power draw was about 0.0368w which still puts it under the Samsung 840 Pro and in the same ballpark as the Samsung 840 EVO. As for average power consumption, the Samsung 840 EVO mSATA 250GB averaged slightly more power consumption averaging in at around 0.57w. It’s still among the best, sitting at the top half of our comparison charts.
[section label=12. Conclusion]
Samsung 840 EVO 240GB Conclusions
 Alright, well that’s about 4 days worth of testing on literally the exact same drive I tested about five months ago. Yay! At least I’m now running a far more comprehensive testing suite, so I guess it’s still a win…
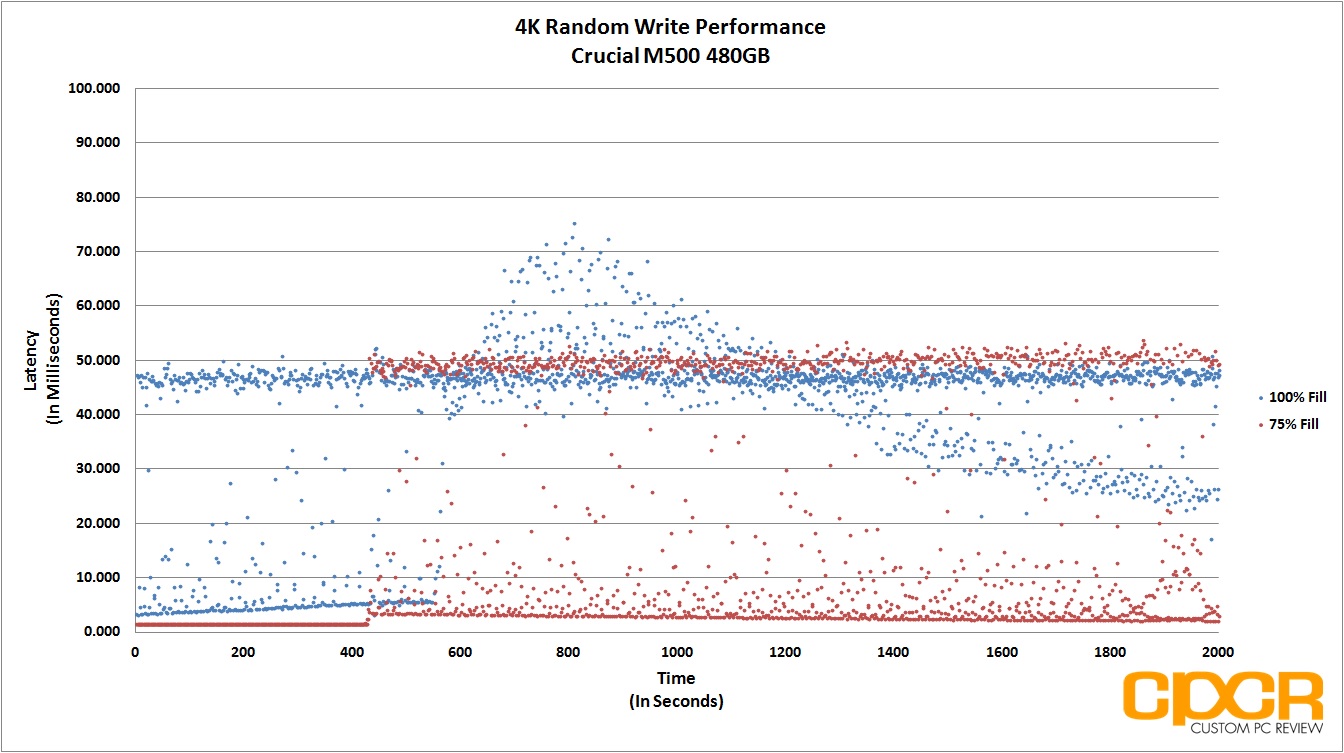
I probably don’t have to say this, but overall performance on the Samsung 840 EVO 250GB mSATA was very, very good and that’s not even counting the beautiful things that happen when RAPID mode is enabled. The implementation of the TurboWrite cache and the optimizations towards read performance on the Samsung 840 EVO is very effective in mitigating the effects of using slower, more error prone 19nm 128Gb TLC NAND. Whereas competing products such as Crucial’s M500 take the hit in write performance when moving to finer fabrication processes and higher density NAND, Samsung on the other hand is still able to achieve very high sequential and 4K write performance. Sure it’s not sustainable performance, but let’s be honest here – typical consumer use is more akin to a 100 yard dash rather than a marathon.
Power efficiency is pretty much the best we’ve seen on any SSD to date, which is great news for a mSATA based SSD. Since these things are more than likely going into notebooks, tablets, and other portables, the less power the SSD draws, the longer the battery life of any portable device will be. In typical use scenarios, SSDs are likely to sit in idle far more than under load so having the best idle power efficiency we’ve ever tested to date is a very, very good thing.
| Manufacturer | Samsung | Samsung | Samsung | Samsung |
|---|---|---|---|---|
| Model | 840 EVO | 840 EVO | 840 EVO | 840 EVO |
| Form Factor | mSATA | mSATA | mSATA | mSATA |
| Capacity | 120 GB | 250 GB | 500 GB | 1000 GB / 1 TB |
| MSRP | $149.99 | $259.99 | $489.99 | $859.99 |
| Price/GB | $1.25 | $1.04 | $0.98 | $0.86 |
| Check Price | Click Here | Click Here | Click Here | Click Here |
MSRP on the Samsung 840 EVO 250GB mSATA is $260, which comes out to be around $1.04/GB. That said, those are MSRP prices and street pricing should be far different when it becomes available at your favorite retailers come first week of January. With the Samsung 840 EVO 250GB SATA SSD currently going for $159.99 ($0.64/GB) and the mSATA version of that being literally a smaller version of that without the casing, I’d expect to see these things going for ~$0.60-$0.70/GB sooner than later.
So here’s the deal. The Samsung 840 EVO mSATA is essentially an updated version of the Samsung 840 EVO I reviewed back in July. Back then, I regarded the Samsung 840 EVO as the best consumer SSD on the market from a features, price, reliability and performance standpoint, and as far as I know, that story hasn’t changed. In fact, with firmware updates in the past couple months further improving performance on the 840 EVO, and the inclusion of additional security features such as TCG Opal 2.0/ IEEE1667, the Samsung 840 EVO in both SATA and mSATA form factors are my top picks for a consumer SSD today. The new 840 EVO mSATA edition simply addresses a segment of the market that has traditionally lacked high capacity, high performance options in the past, and I wouldn’t be surprised at all if the Samsung 840 EVO mSATA becomes the best selling mSATA SSD on the market come January. If you’re in the market for a new mSATA SSD, I’d definitely wait a couple weeks until the Samsung 840 EVO mSATA starts making its way into the channel. If the price is right, there’s absolutely no reason not to pick one up. Highly recommended!

Sample provided by: Samsung
Available in January 2014
[section label=13. Addendum]
MLC (2-bit MLC) vs TLC (3-bit MLC)
As a response to one of our reader’s comments regarding how much is actually lost from the transition from the Samsung 840 Pro which uses 2-bit MLC to the Samsung 840 EVO which uses 3-bit MLC (AKA TLC), we ran a comparison between the two drives comparison large file transfers.
The comparison below is a trace of both the Samsung 840 Pro 256GB and the Samsung 840 EVO 250GB mSATA’s performance when subjected to 128K random writes with the drive at 75% capacity.
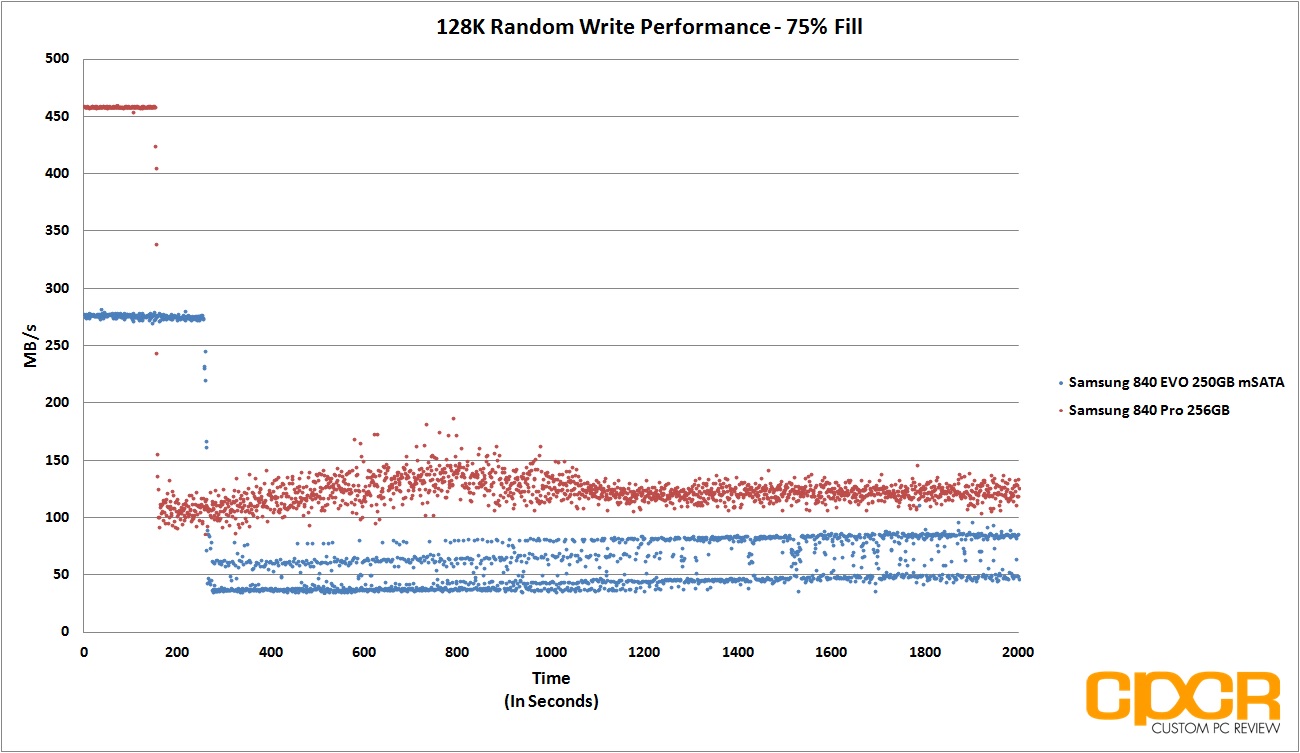
Performance Analysis
Aside from the Samsung 840 EVO sitting at ~475MB/s for about six seconds due to TurboWrite, performance drops down to ~275MB/s where it sits there until all user addressable LBAs get filled where it ultimately drops down to about 30MB/s – 80MB/s. On the other hand, the Samsung 840 Pro with its faster MLC NAND is capable of performing at ~470MB/s before all user LBAs get filled and performance ultimately drops to around 100MB/s – 150MB/s.
While this does expose the ultimate limitations of slower TLC NAND and could be an issue for those that constantly need to write large files, I’m not convinced that worst case scenario is something that will be reached in typical client use cases.

Still, this review lacks stressing out how much is lost after transition to TLC, sometimes writes on EVO after 3TB Host Writes and in used state are only 80MB/s. That is not what people expect from SSD. If you need SSD, look at 840 PRO or other device with MLC NAND.
The reason I don’t stress this is because the Samsung 840 EVO is a consumer grade drive and for most users (even enthusiasts such as myself) it’s rare to need to put 3TB of writes in without any breaks to allow the TurboWrite cache to flush itself. Sure I do it when I install a game or something, but I don’t really spend all day downloading and installing stuff. For those moments, I can just wait for it to install at 275MB/s. No big deal.
That said, you’re right. There is a huge loss in write performance and latency moving from MLC to TLC, but you’re looking at the difference between like ~470 MB/s to about ~250 MB/s (assuming you’re talking about large file transfers here, 128K or above). Sure I’ve seen the 840 EVO drop as low as 80MB/s or 30MB/s, but that requires you to fill up all LBAs, fill up TurboWrite AND not give TurboWrite or TRIM a chance to restore performance. Unless you’re benchmarking like I am, running a server, or doing some sort of enterprise work, I simply don’t see that happening in any typical client use scenario. If that’s the case, even the Samsung 840 Pro isn’t recommended. A enterprise SSD is what you want instead.
For client use, I think the only real case I’ve come across for a Samsung 840 Pro over a EVO is for those doing real-time video recording of one or multiple uncompressed video streams. Recording as in somebody had a couple capture cards to record gaming footage from a couple other computers. In that case, yeah the ~470MB/s from the 840 Pro is much better than the ~275 MB/s off the 840 EVO after TurboWrite. However, after TurboWrite you still get ~275MB/s-270MB/s (from my testing although Samsung rates ~250MB/s) so as long as footage is compressed, I don’t see much of an issue from a performance standpoint. That said, for those doing any sort of video, photo or 3D work I recommend the 840 Pro anyway just because its longer warranty and endurance.
what we really want is pcie drivers or m2 with MLC maybe an EVO5 PRO in 2014?
Yup. I agree. I think it’s just time for motherboard vendors to start implementing SATA Express/M.2 into their designs. I believe NVMe drivers are already available in both Linux and Windows 8.1, so the “infrastructure” is already there.
For sure I wouldn’t be surprised to see a Samsung 850 Pro/EVO come in M.2 or SATA Express come July next year. They already have a M.2 XP941 that’s shipping in some OEM solutions. They just don’t want to ship to end users since there’s no widespread way for us to use it yet.