[section label=1. Introduction]
Phison’s S10 Ignites Asynchronous MLC NAND
 Although once dominant as the go to pre-packaged SSD controller solution for most tier 2 and tier 3 SSD manufacturers, SandForce’s aging SF-2281 controller has been rapidly losing marketshare as of late thanks to newer pre-packaged controller offerings from Phison and Silicon Motion.
Last year we reviewed the Angelbird SSD wrk which was an excellent SSD that featured Silicon Motion’s SM2246EN controller, and at the same time Phison had been shipping their new high performance S10 controller in the very well received Corsair Neutron XT.
Although we didn’t get to test the Corsair Neutron XT at the time, we did recently receive a review unit of the Patriot Ignite, which as luck would have it, utilizes Phison’s new controller.
Patriot Ignite Specifications
| Manufacturer | Patriot | Patriot |
|---|---|---|
| Model | Ignite | Ignite |
| Model Number | PI480GS25SSDR | PI960GS25SSDR |
| Form Factor | 2.5″ 7mm | 2.5″ 7mm |
| Capacity | 480GB | 960GB |
| Controller | Phison S10 | Phison S10 |
| NAND | IMFT 16nm Asynchronous MLC | IMFT 16nm Asynchronous MLC |
| DRAM Cache | 512MB DDR3 | 1024MB DDR3 |
| Sequential Reads | 560 MB/s | 560 MB/s |
| Sequential Writes | 545 MB/s | 545 MB/s |
| 4K Random Read | 80,000 | 80,000 |
| 4K Random Write | 75,000 | 75,000 |
| Interface | SATA 6Gb/s | SATA 6Gb/s |
| Warranty | 3 Years | 3 Years |
The Patriot Ignite SSD is Patriot’s latest SSD designed for the entry/mid range. Patriot markets it as a slightly higher end product than their Torch SSD, but it’s a lower end product than their Blaze and Pyro SSDs. The Patriot Ignite is probably the first consumer SATA SSD I’ve seen on the market that will only be available in capacities of 480GB and 960GB, but that makes sense considering costs have gone down considerably since even last year. Rated performance is quite good as both the 480GB and 960GB Ignite is rated up to 560MB/s sequential reads and 545MB/s sequential writes. 4K random read and write performance is decent as well with 4K random read performance up to 80,000 IOPS and 4K random write performance up to 75,000 IOPS.
Internally, the Patriot Ignite will be using Phison’s latest S10 controller which debuted for the first time late last year. It’ll also be using IMFT’s new 16nm MLC, but rather than the higher performance synchronous MLC NAND we’re more familiar with, the Ignite packs slightly slower, but less expensive asynchronous MLC NAND. Since this is the first time we’ll be testing a SSD with both the Phison S10 and IMFT’s 16nm Asynchronous MLC, we’re quite excited to see what the Ignite can do.
Without further ado, let’s go ahead and take a closer look!
[section label=2. A Closer Look]
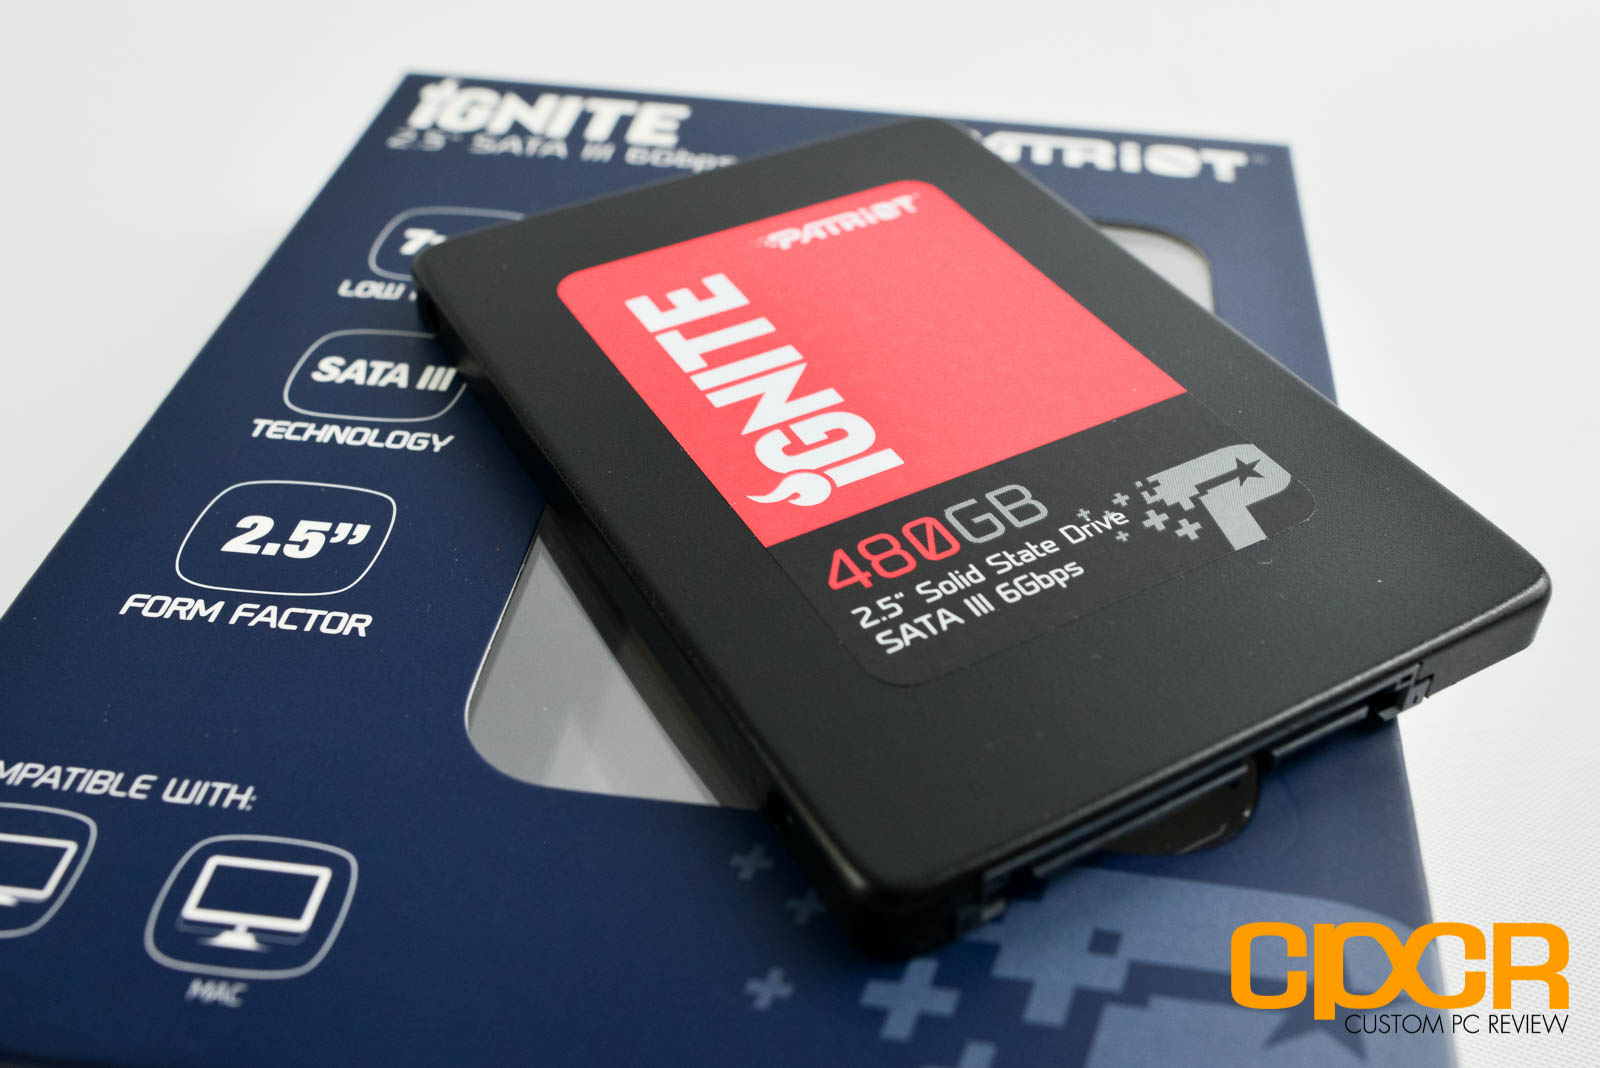
A Closer Look at the Patriot Ignite 480GB
Here’s a look at the packaging for the Patriot Ignite 480GB.
Included in the packaging we get some documentation and the Patriot Ignite SSD itself.
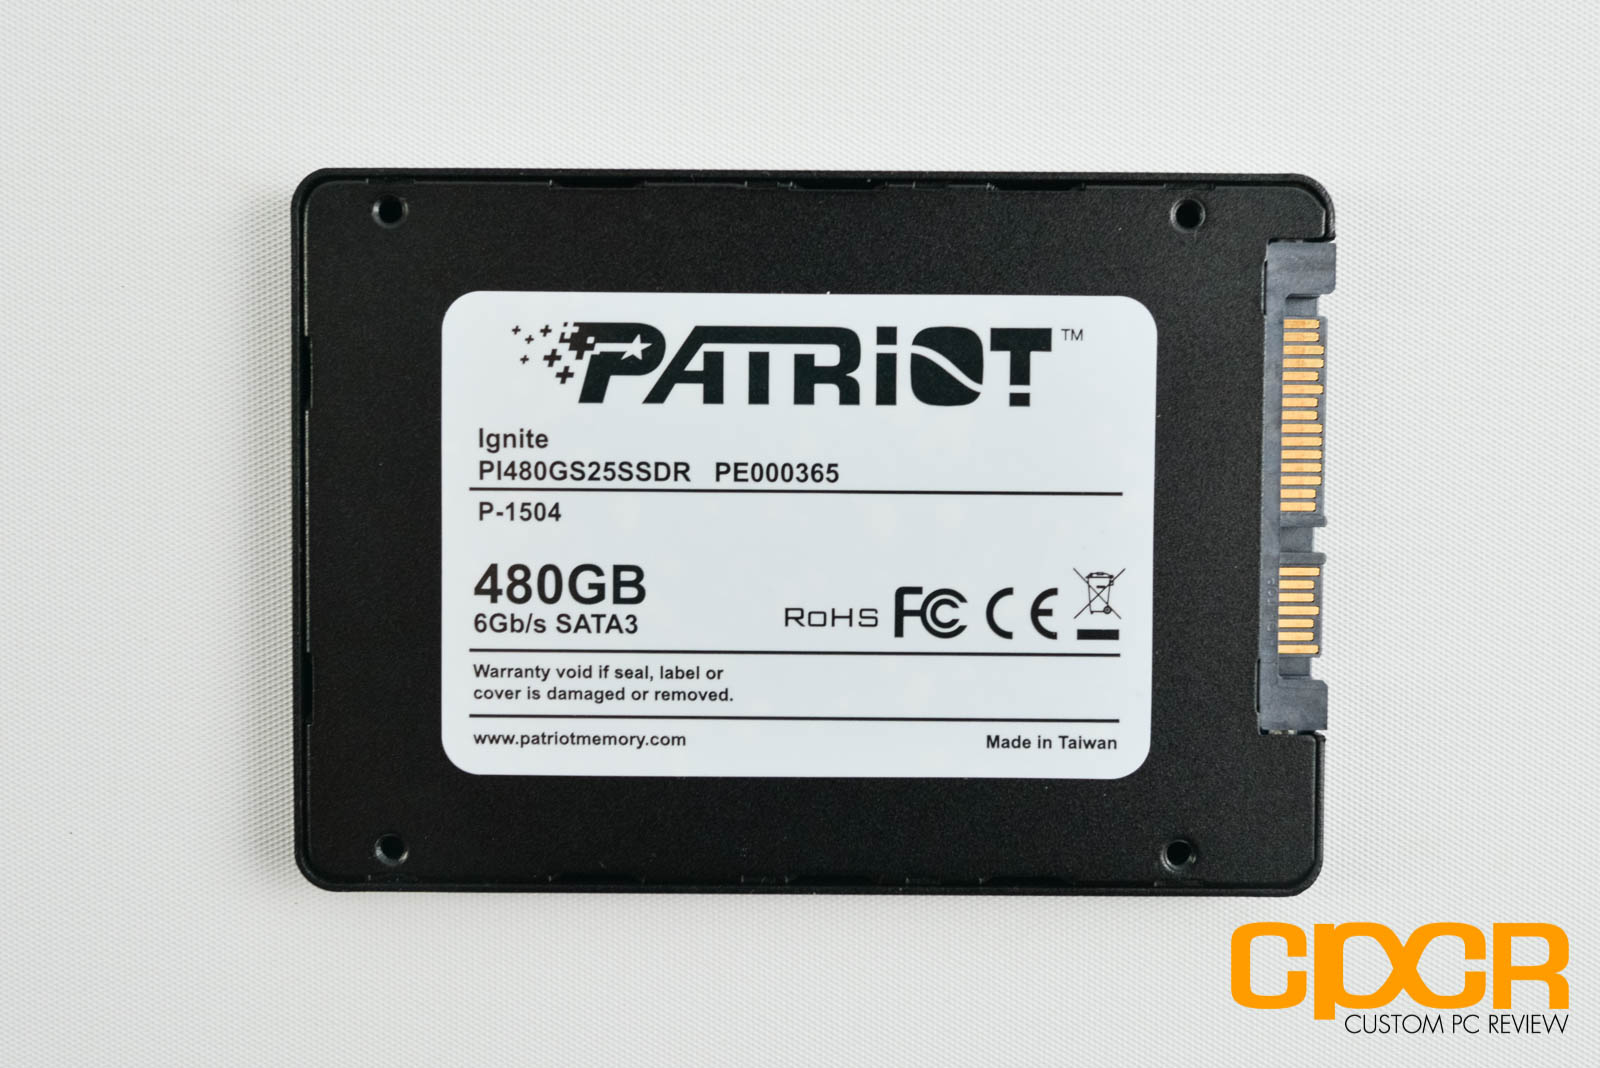
Here’s a closer look at the Patriot Ignite SSD.
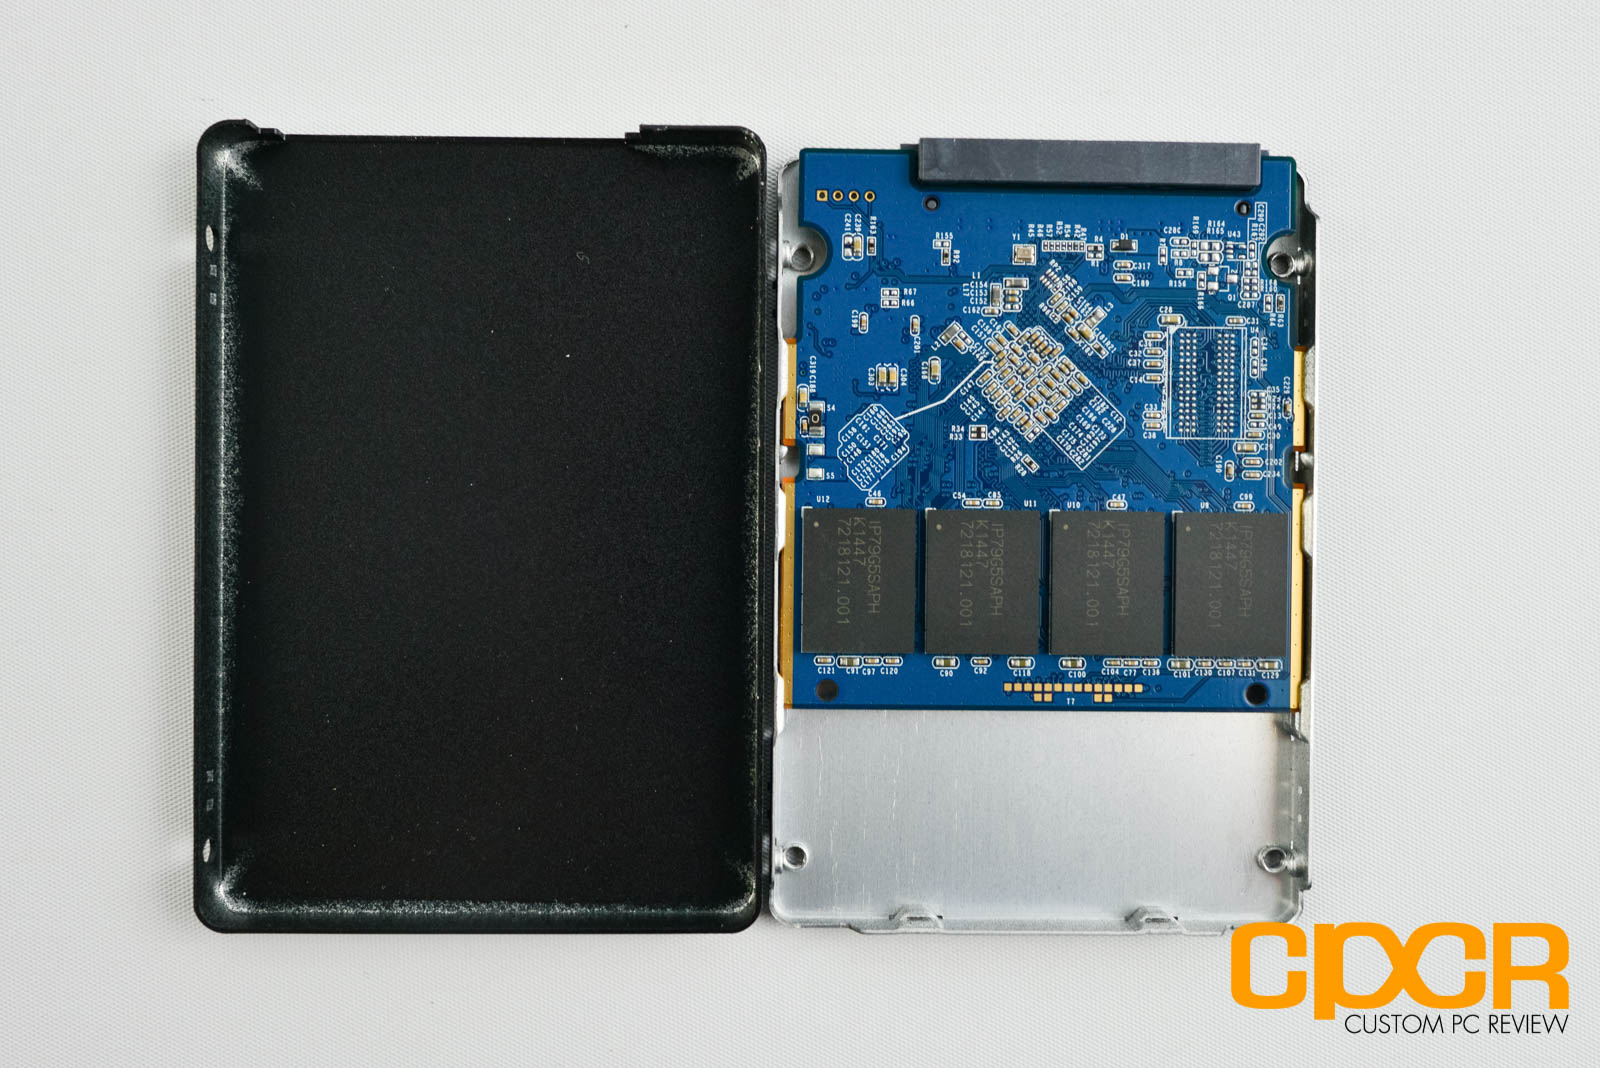
Cracking open the case, we can see that Patriot is using a 3/4 length PCB for the drive. This is pretty much the reference PCB design.
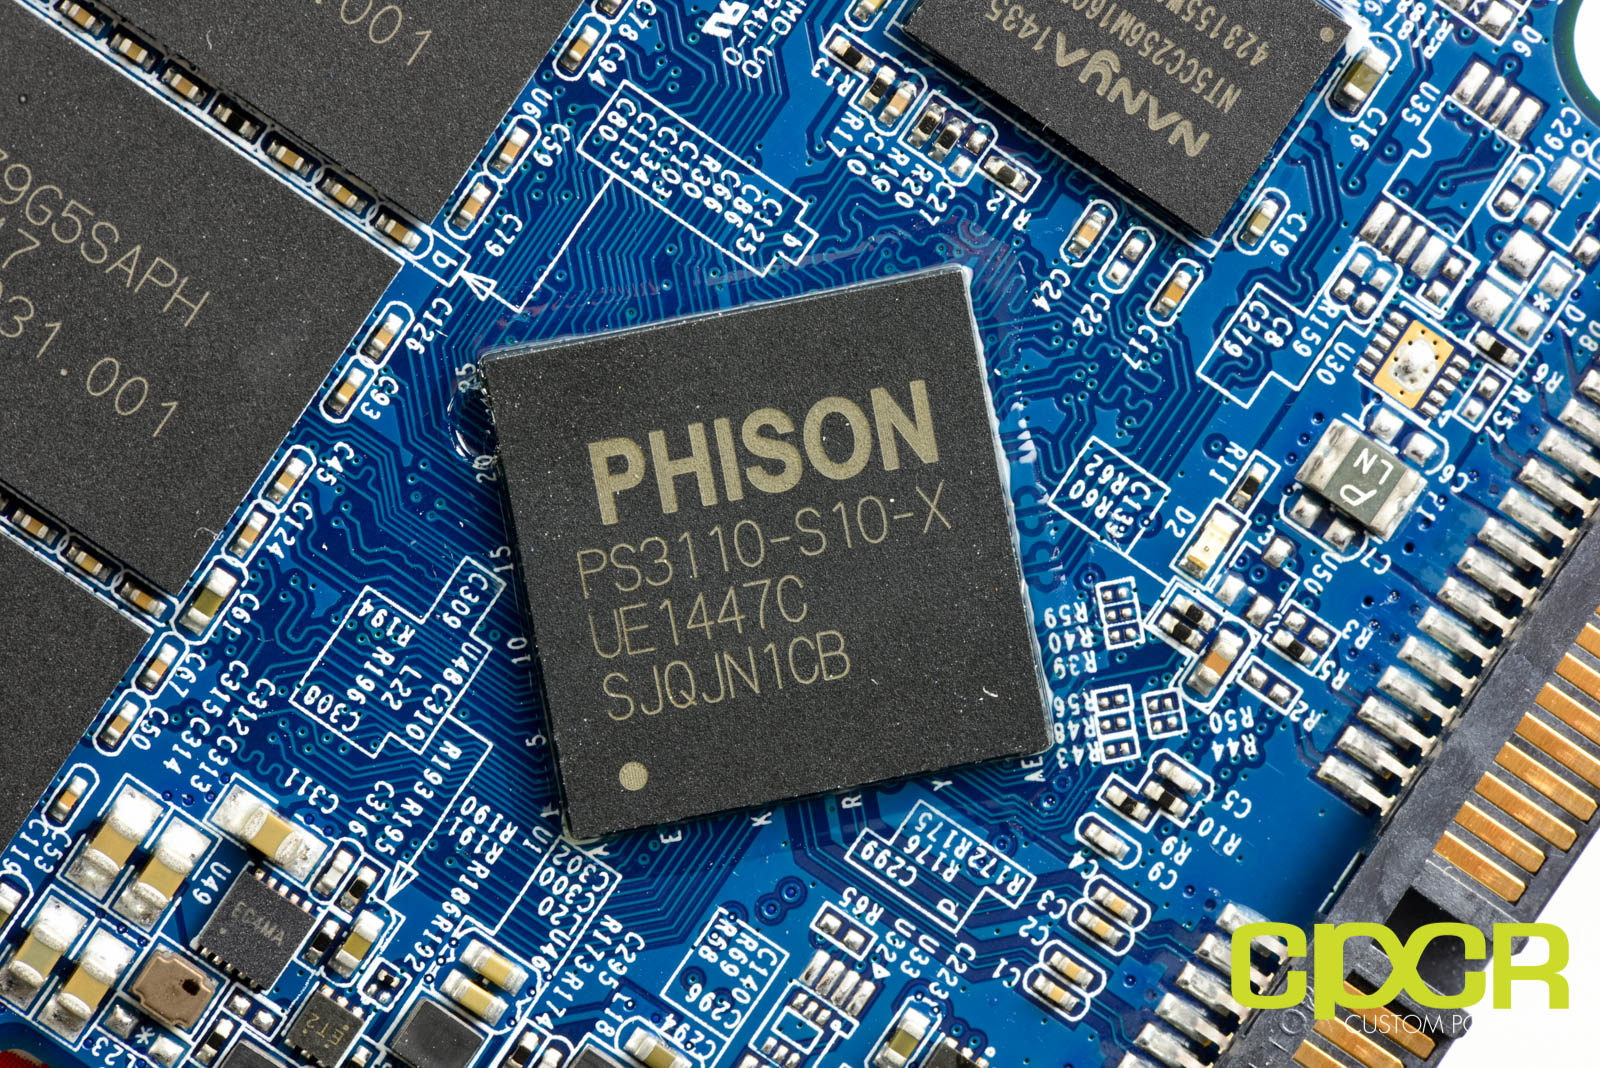
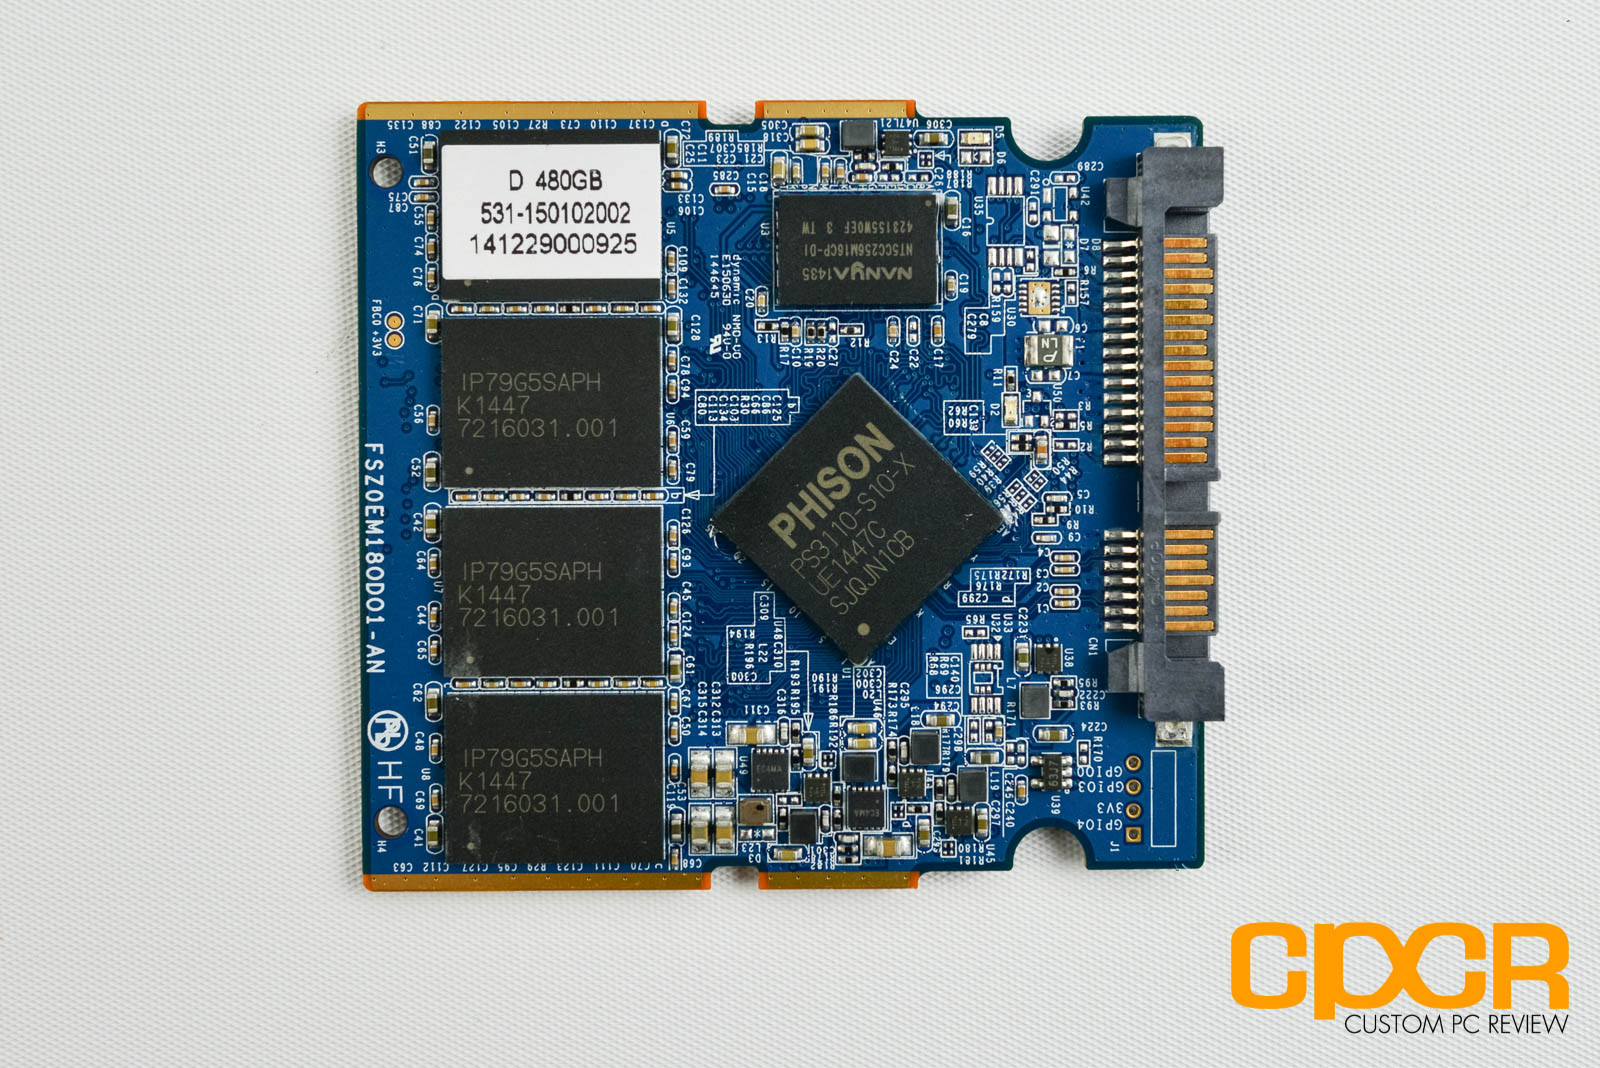
Here’s a look at the Phison S10, or PS3110-S10-X, controller. It’s an 8-channel, quad core controller with three cores dedicated to flash management and one dedicated to the host operations. Phison claims that the extra cores dedicated to flash management is designed to significantly improve drive performance.
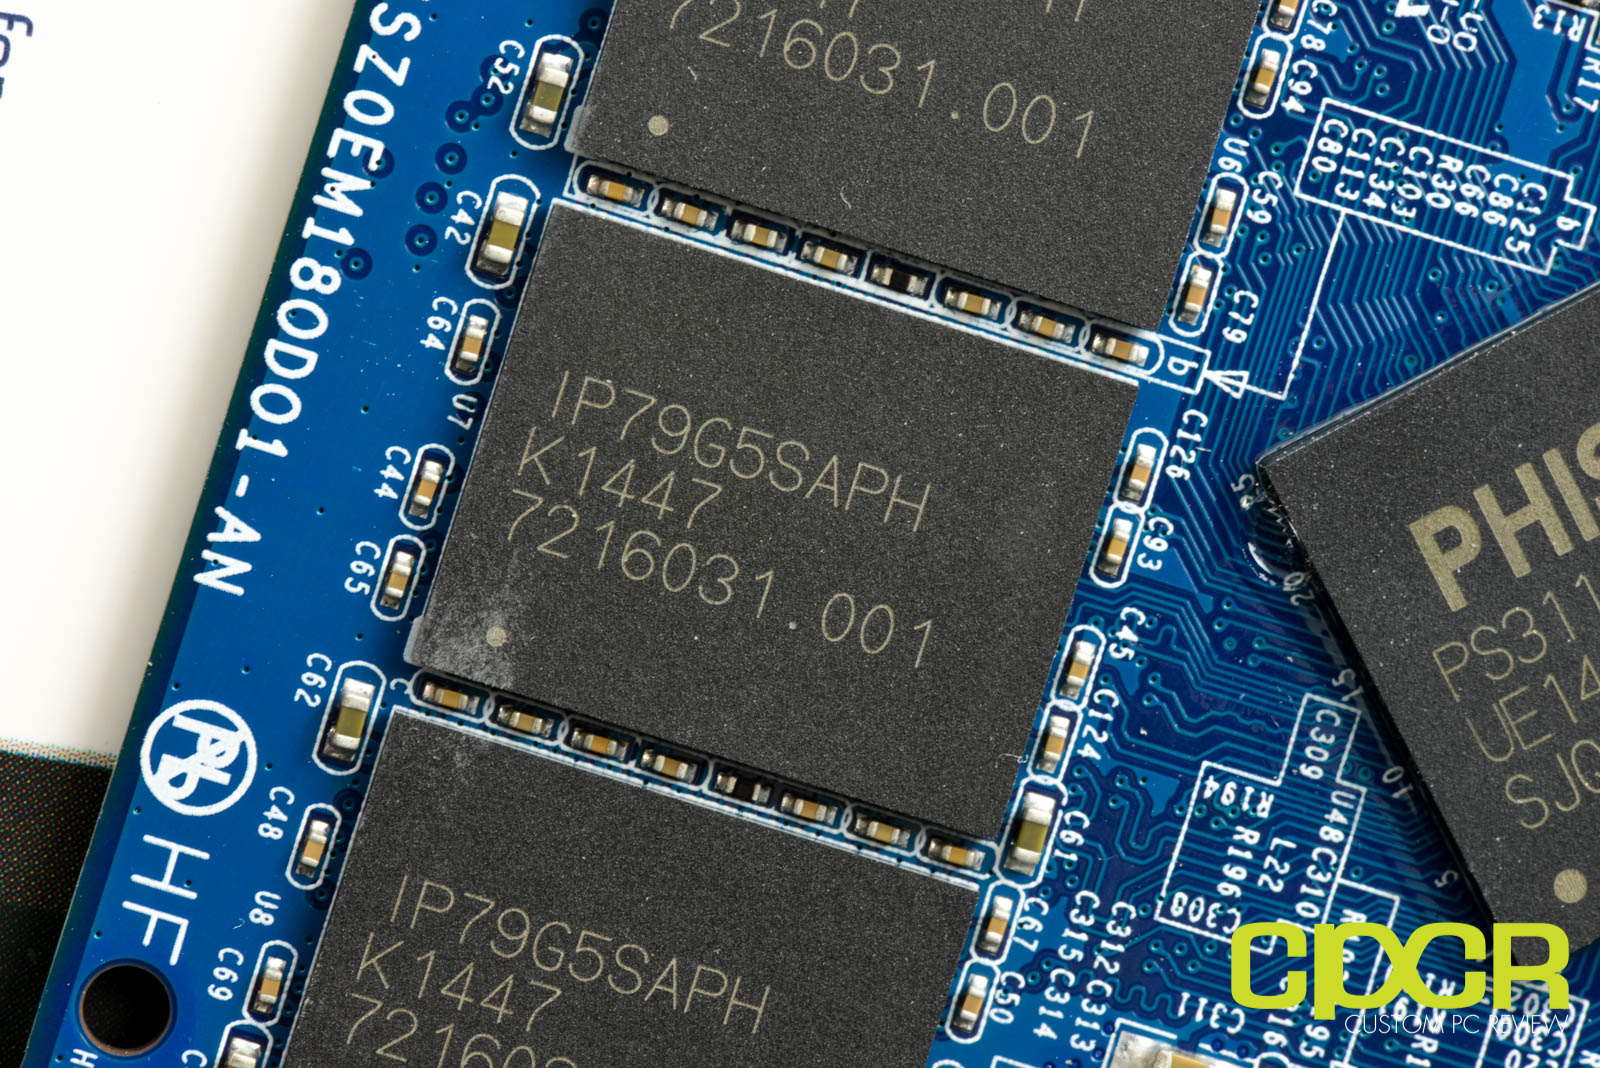
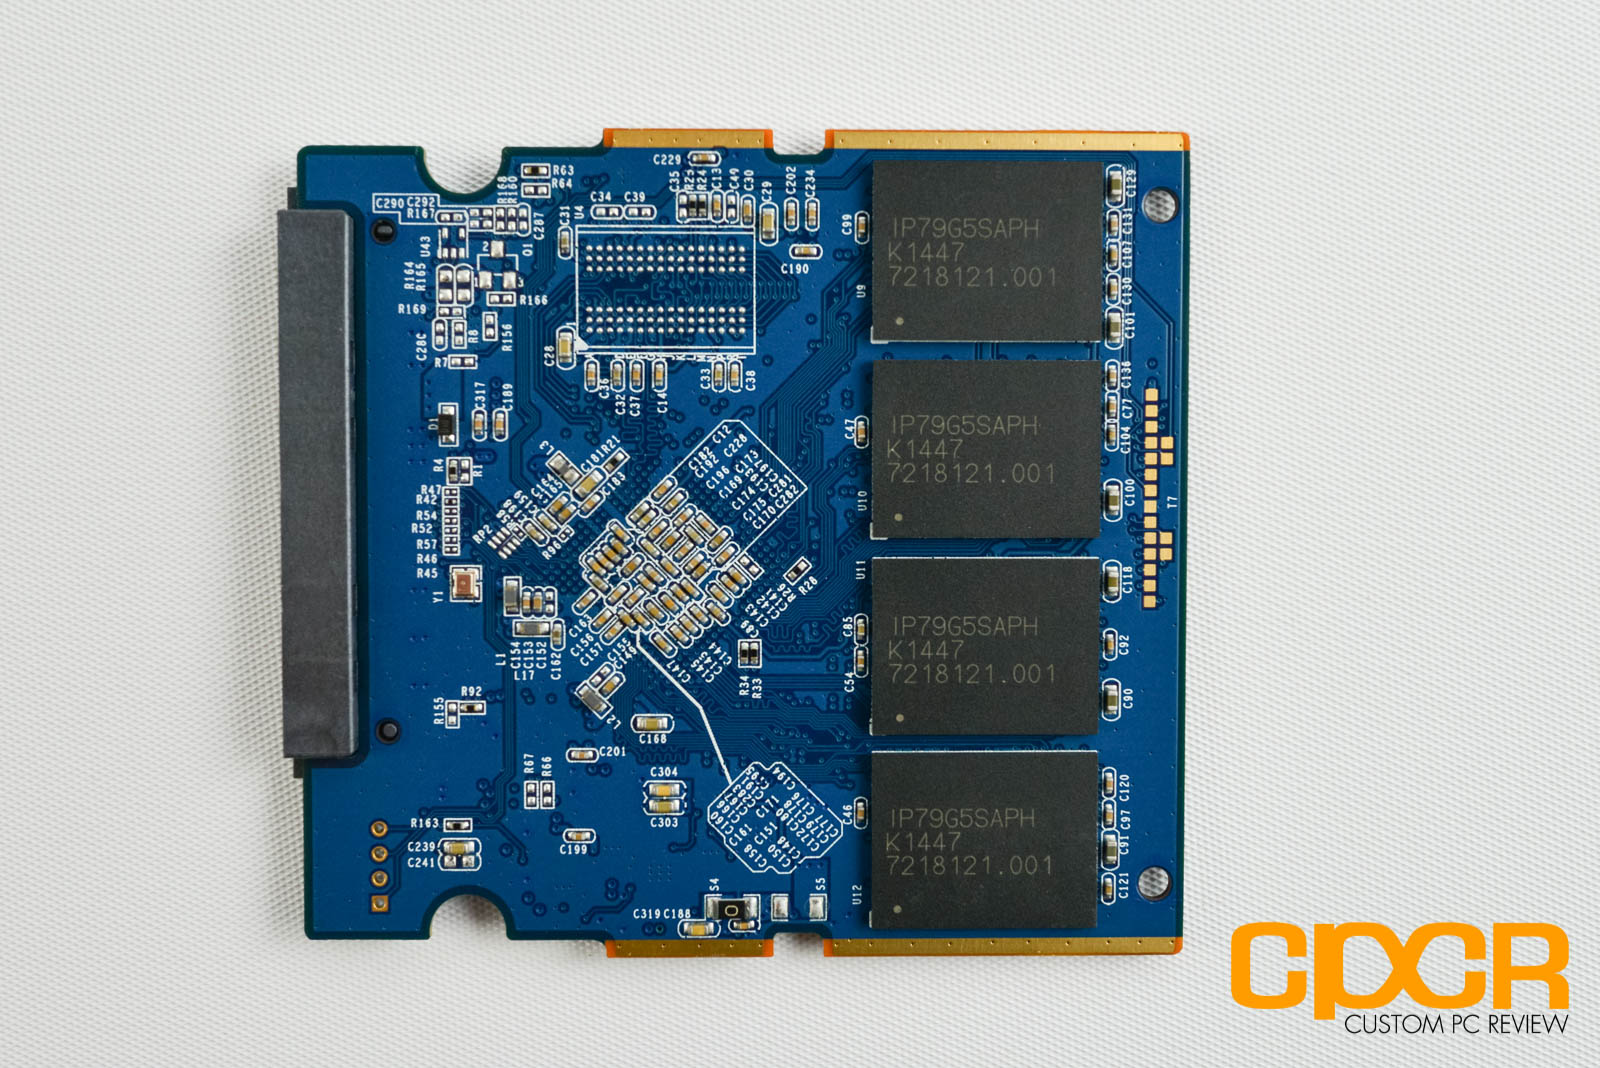
NAND onboard the Patriot Ignite 480GB is IMFT 16nm Asynchronous MLC (Model #IP79G5SAPH). On the 480GB drive we get 8 NAND packages. We weren’t given any information on die capacities or package capacities, but we’re most likely looking at 128Gb dies and 64GB NAND packages making up a total of 512GiB NAND onboard with an additional 7% reserved for overprovisioning.
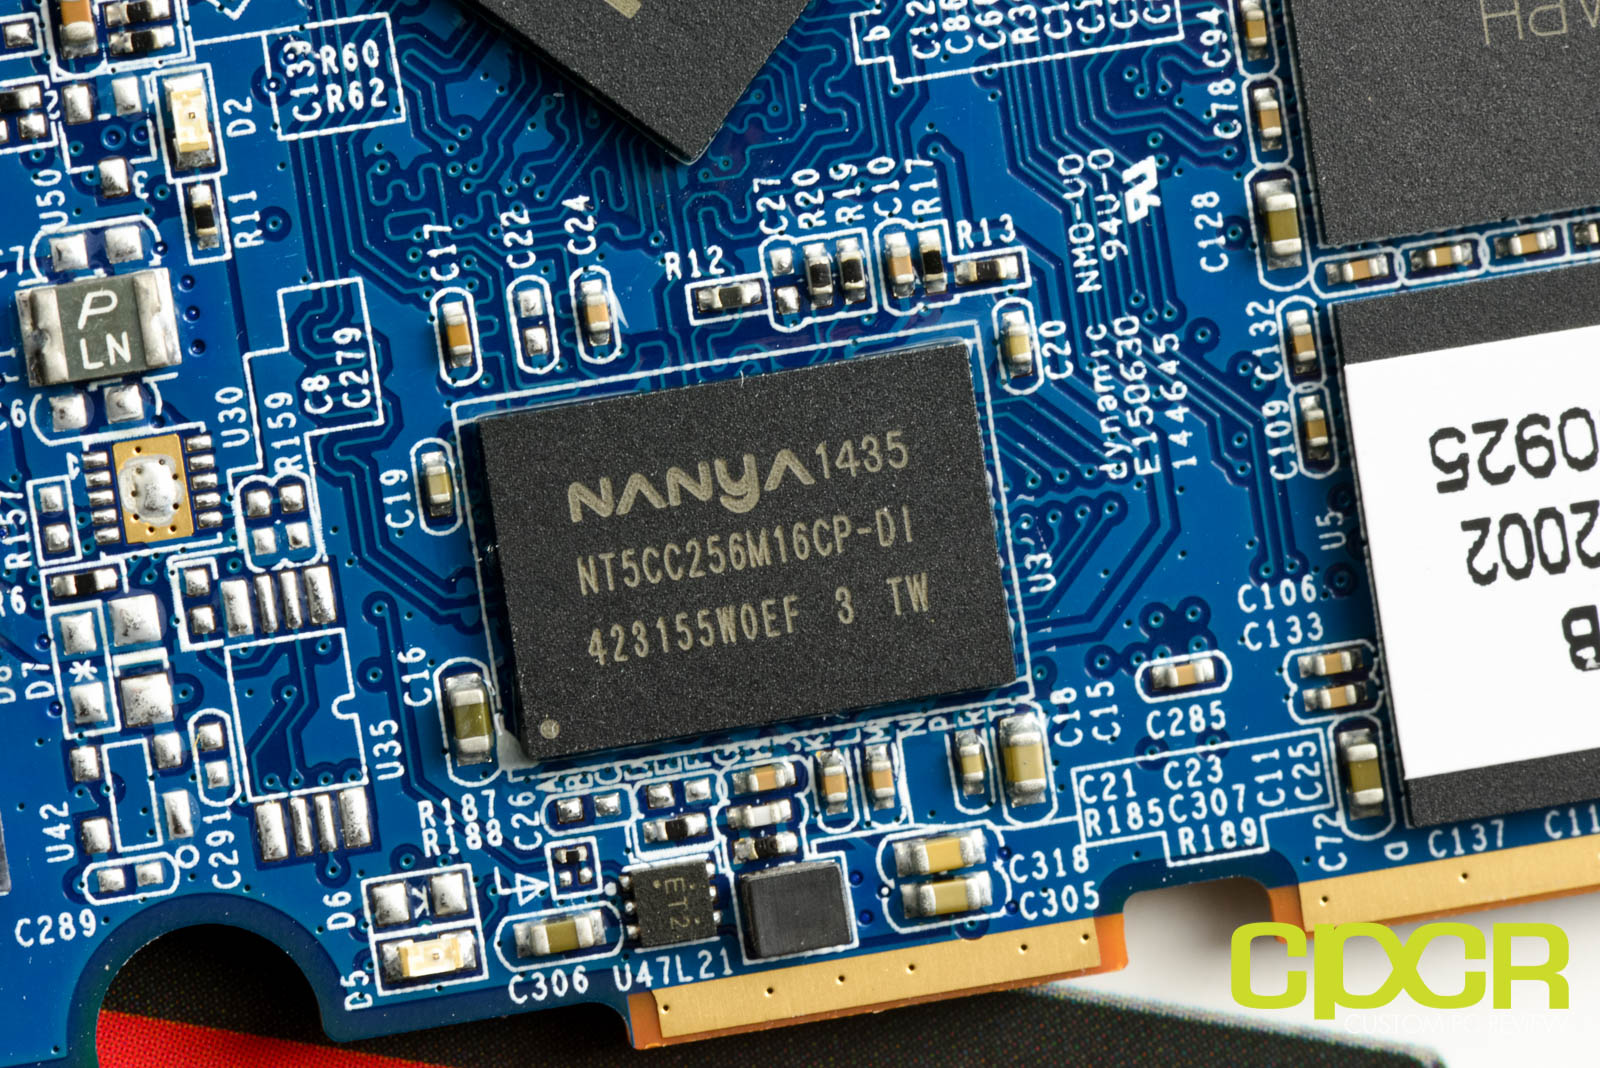
DRAM onboard the drive is a single 512MB Nanya DDR3L-1600 package (Model #NT5CC256M16CP-DI).
[section label=3. Testing Setup and Drive Info]
Testing Setup
| System | CyberPowerPC Gamer Xtreme 4200 |
|---|---|
| CPU | Intel Core i7-4770K |
| Motherboard | ASUS Z87-A |
| Memory | Kingston HyperX Genesis 16GB DDR3 2133MHz |
| Graphics | Intel HD4600 Graphics |
| Storage | OCZ Vertex 4 256GB |
| Power Supply | Corsair HX650 |
| Case | HSPC High Speed Tech Station |
| Optical Drive | ASUS OEM DVD Drive |
| Operating System | Windows 8 64 bit & CentOS 6.4 |
Special thanks to CyberPowerPC, Kingston, OCZ Storage Solutions and HSPC for sponsoring our test bench!
Crystal Disk Info
Patriot Ignite 480GB
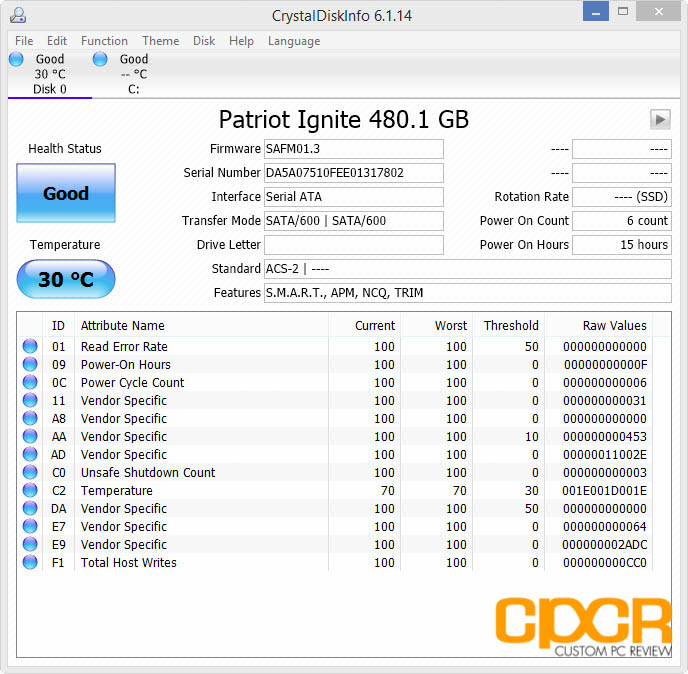
Today we’ll be reviewing the Patriot Ignite 480GB using firmware SAFM01.3.
[section label=4. ATTO Disk Benchmark / AS SSD / Crystal Disk Mark]
Patriot Ignite 480GB Performance
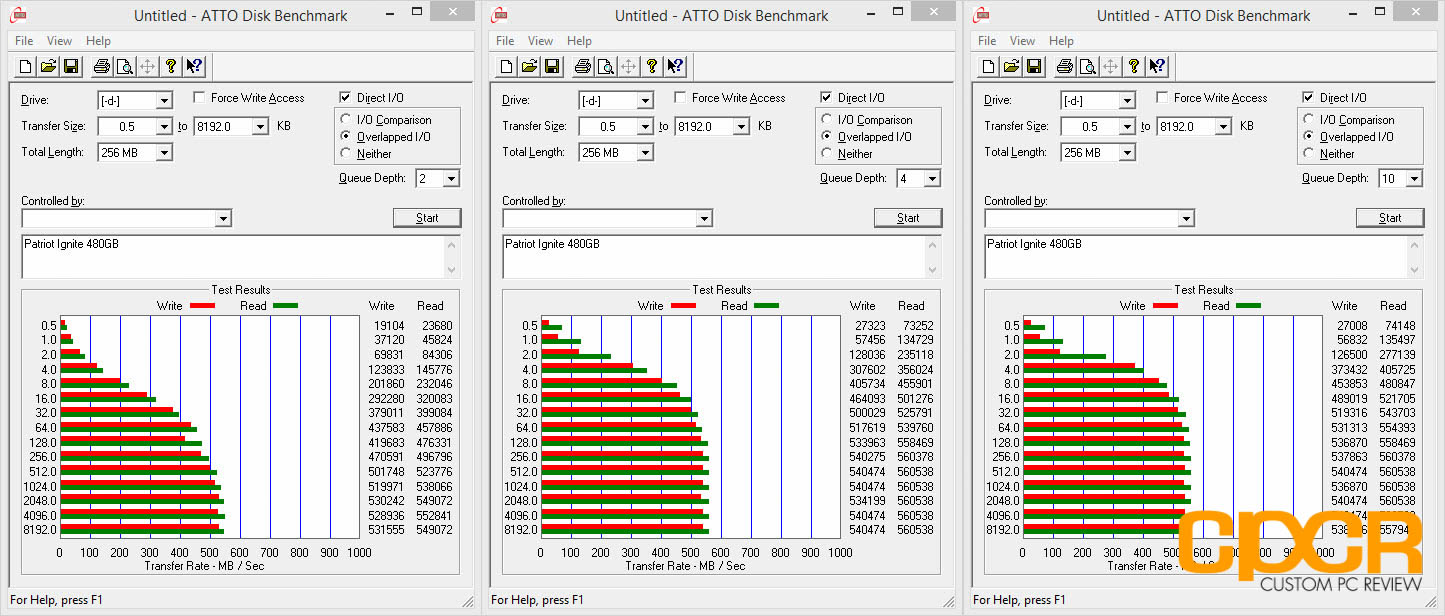
ATTO Disk Benchmark v2.46
ATTO Disk Benchmark is one of the industry’s oldest and most popular benchmarks for testing disk read/write speeds. This benchmarks allows read and write testing using predefined block sizes and gives us a good idea of read/write speeds with different sized files. Most SSD manufacturers prefer using this benchmark when advertising SSDs as it tests using compressible data, which tends to yield best performance.
Performance Analysis
Although Patriot has equipped with the Ignite with slower asynchronous NAND, it still performs extremely well in the ATTO Disk Benchmark thanks to the Phison S10 controller. Sequential read performance maxed out at 560MB/s and sequential write performance maxed out at 540MB/s, which is the upward ceiling for the SATA 3Gb/s interface. Prior to this, the only other controller we’ve tested capable of reaching this level of performance with asynchronous NAND is the SandForce SF-2281 thanks to its on the fly compression algorithms.
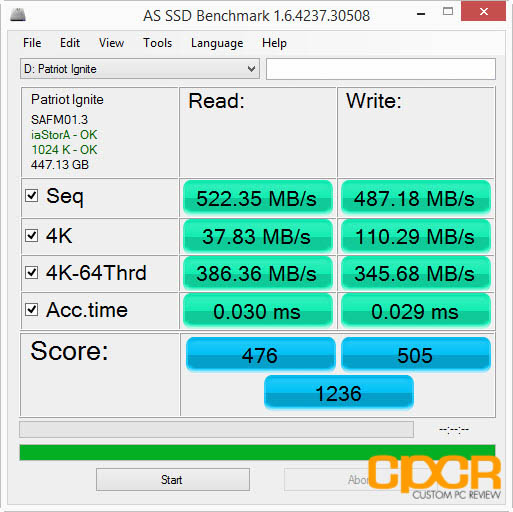
AS SSD Benchmark
AS SSD is a very commonly used benchmark used to measure SSD performance in sequential, 4K, 4K QD64 and latency. Tests are run using 100% incompressible data. AS SSD also outputs a final score at the conclusion of the test based off the overall performance of the drive.
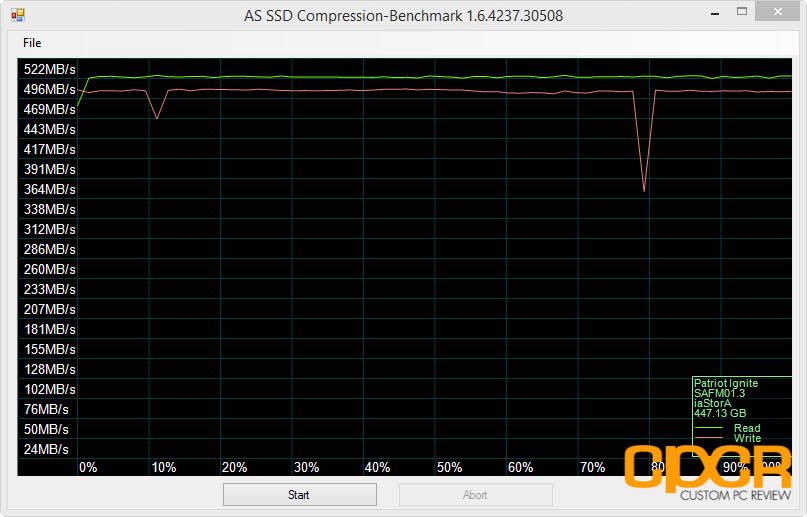
Additionally, we also run AS SSD’s included compression benchmark which tests the drive using data of varying compressibility. Some SSDs such as SandForce based SSDs tend to perform significantly better when the data is compressible.
Performance Analysis
AS SSD performance was equally impressive, which again is something we typically don’t find in drives equipped with asynchronous NAND. Sequential read/write performance was able to reach 522MB/s and 487MB/s respectively which is very good for an entry level drive. 4K performance is acceptable as well with 4K random read/write performance maxing out at 38MB/s and 110MB/s respectively.
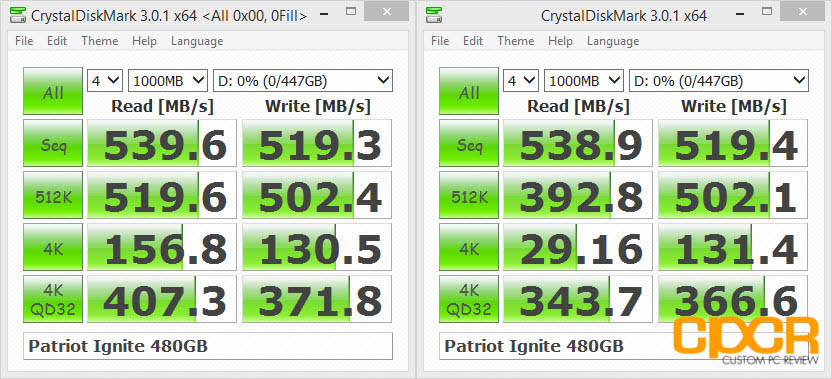
Crystal Disk Mark 3.0.1 x64
Crystal Disk Mark is another popular benchmark which allows us to measure both sequential read/write speeds as well as random read/write speeds. With this benchmark, tests can be run using both random fill (incompressible data) and 0 fill (compressible data). Realistically in typical computer usage scenarios, data being transferred will consist of a mixture of both incompressible and compressible data.
Performance Analysis
Looking at Crystal Disk Benchmark, drive performance reached a SATA saturating 540MB/s sequential reads and 519MB/s sequential writes. What’s interesting about this benchmark is that it clearly shows the Phison S10 being able to perform better with compressible data. However, rather than accelerating writes like SandFoce does, the Phison S10 accelerates compressible reads.
[section label=5. PC Mark 7 / PC Mark 8]
Patriot Ignite 480GB Performance
PC Mark 7 Storage Benchmark
The PC Mark 7 storage benchmark is a trace based benchmark that evaluates the SSD under many different real world environments such as gaming, multimedia editing, etc. PC Mark 7 uses a relatively light workload, which represents a typical mainstream client storage sub-system workload.
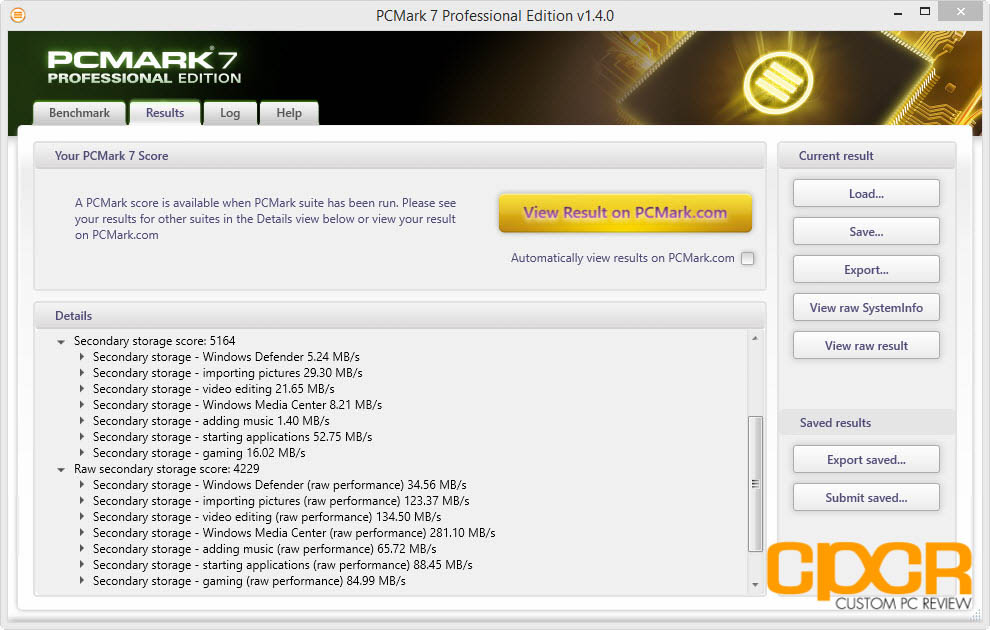
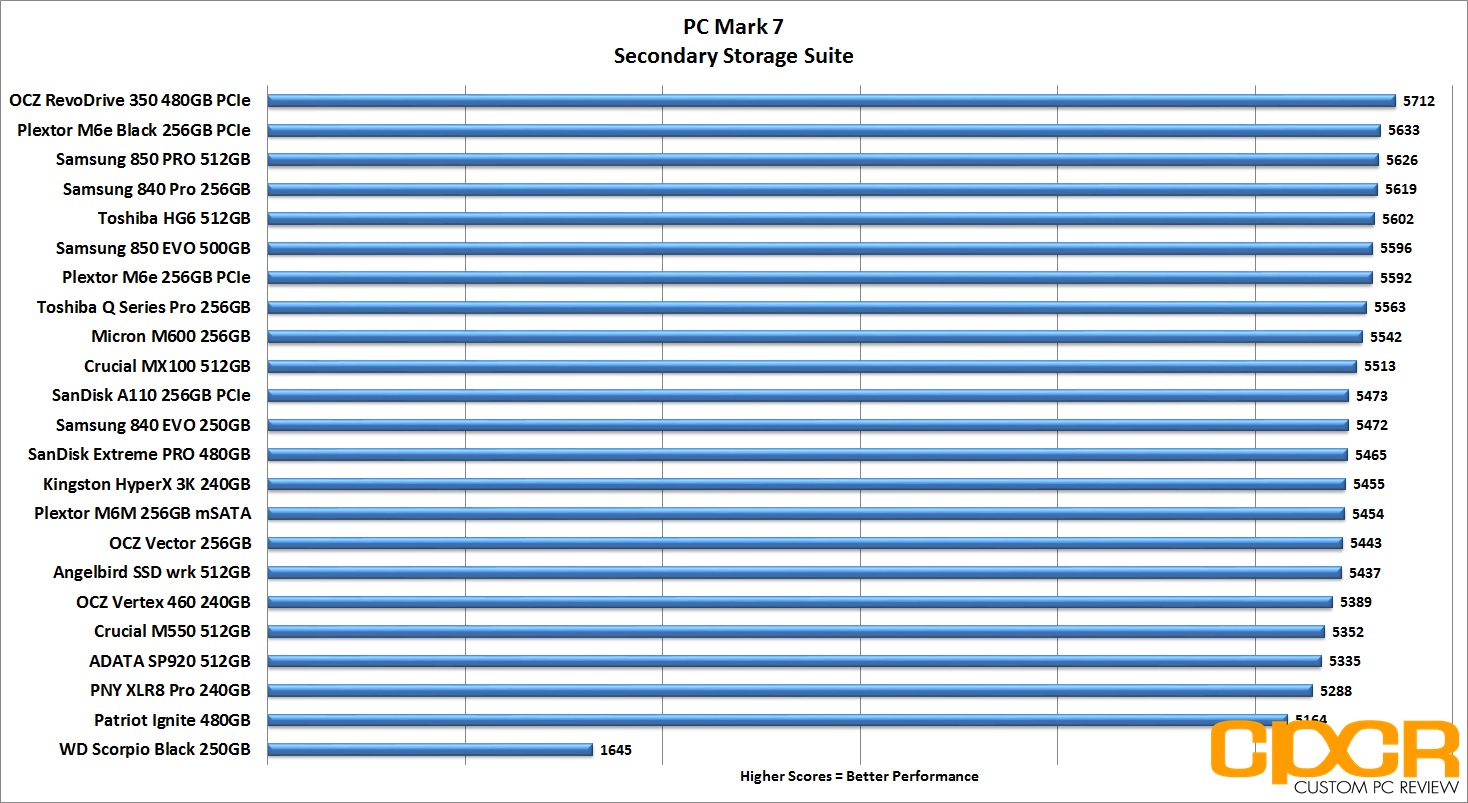
Performance Analysis
In PC Mark 7, the Patriot Ignite’s asynchronous NAND falters quite a bit compared to its synchronous MLC and toggle NAND counterparts, coming in at the bottom of our charts.
PC Mark 8 Expanded Storage Benchmark
With the introduction of PC Mark 8 2.0.228, Futuremark added the option for an Expanded Storage Benchmark which is literally designed to bring any storage system its absolute limits. The new PC Mark 8 Expanded Storage Benchmark takes around 24 hours to run and for our purposes, we’ll be using the consistency test which measures performance consistency, degradation tendency, and recovery speed of a storage system.
Consistency Test
Full details on the consistency test can be found in the PC Mark 8 Technical Guide here. For the more simplified version, the test is basically a near 24 hour, five phase benchmark – three of which we’ll be reporting on in our results below.
- Phase 1 is a precondition phase designed to “dirty” the drive with random data. The entire drive is filled twice to the capacity of the drive.
- Phase 2 is a degrade phase where the drive is hammered with tons of random data followed by a performance test run. This is done 8 times.
- Phase 3 is the steady state phase where the drive is once again hammered with tons of random data followed by a performance test run. This is done 5 times.
- Phase 4 is the recovery phase where the drive is given 5 minutes to rest followed by a performance test run. This is done 5 times.
- Phase 5 is the clean up phase where the drive is simply secure erased.
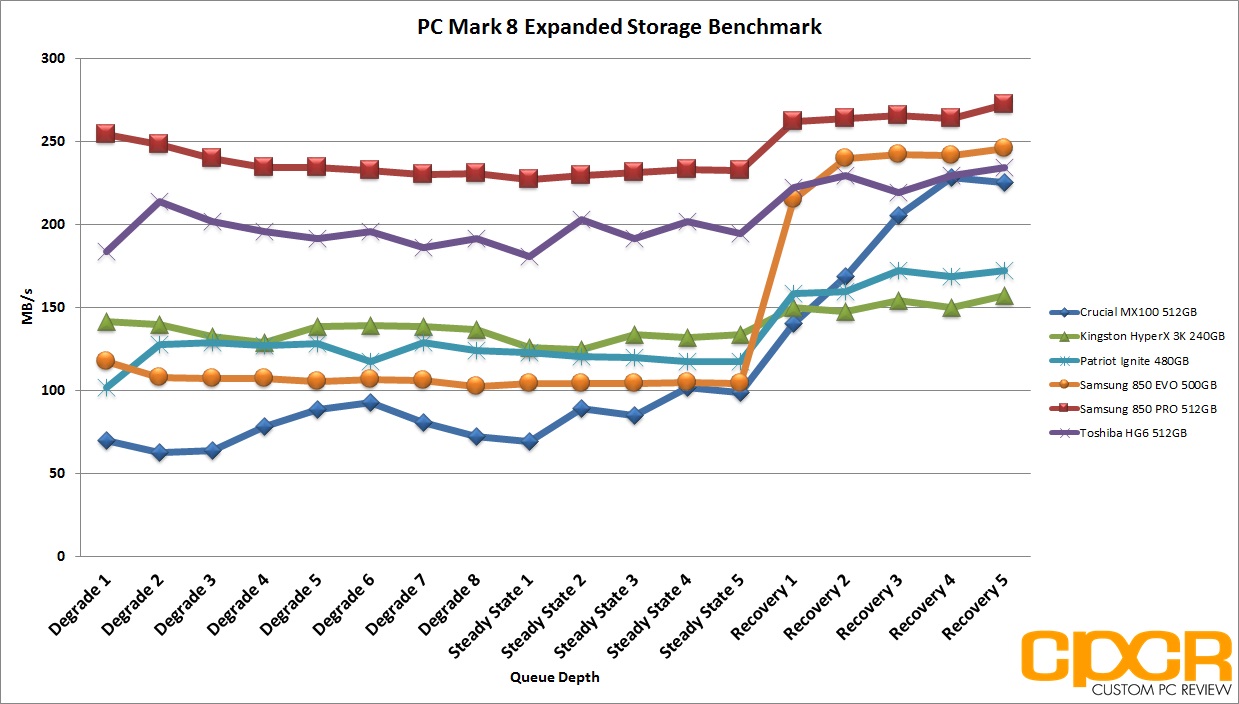
Performance Analysis
PC Mark 8’s expanded storage benchmark shows a side of the Patriot Ignite which is a bit interesting. Unlike competing low cost drives such as the Crucial MX100 and the Samsung 850 EVO which tend to slow down during heavier workloads and speed up at lighter workloads where there’s ample time between operations to run internal flash maintenance operations, the Patriot Ignite’s performance stays relatively steady in both heavier and lighter workloads.
[section label=6. FIO – FOB]
Patriot Ignite 480GB Performance
FIO (Flexible I/O Tester)
FIO, which stands for Flexible I/O Tester, is basically what its name says – a flexible I/O tester / I/O workload generator. Whereas all the benchmarking tools we’ve used previously are fantastic, easy to use benchmarking tools that provide a good snapshot of SSD performance, they do lack a lot of versatility, especially for more complex and in-depth operations such as custom queue depths, block sizes, test run times, etc. While the testing that follows may not pertain to typical consumer usage, they do help give us a much more in-depth look at each individual product’s strengths and weaknesses when they’re pushed to the limits.
FIO – FOB (Fresh Out of the Box) Testing
When SSDs are brand new and Fresh Out of the Box, they’re generally able to perform at or outperform their advertised speeds, but unlike traditional hard drives, performance on SSDs begin to degrade over time as they become more and more used. This is because while SSDs are new, all bits on the SSD are empty, so they can instantly be programmed with data. However, once data gets programmed in, even if it’s deleted in the filesystem the actual data will still stay programmed on the NAND itself unless some sort of garbage collection routine comes in to wipe the data. Unfortunately, in order to write new data onto “dirty” NAND, the NAND needs to go first through an erase cycle to erase the old data before a program cycle can happen to program new data, which as you may imagine takes more time than just a simple program cycle. As this only happens when writing new data onto the SSD, you’ll generally see less performance degradation on reads and more performance degradation on writes.
For our FOB testing, we run a secure erase on the SSD then run each test sans any preconditioning. This will provide us with the highest level of performance the SSD is capable of and is likely never to be seen ever again once the SSD goes into a used state.
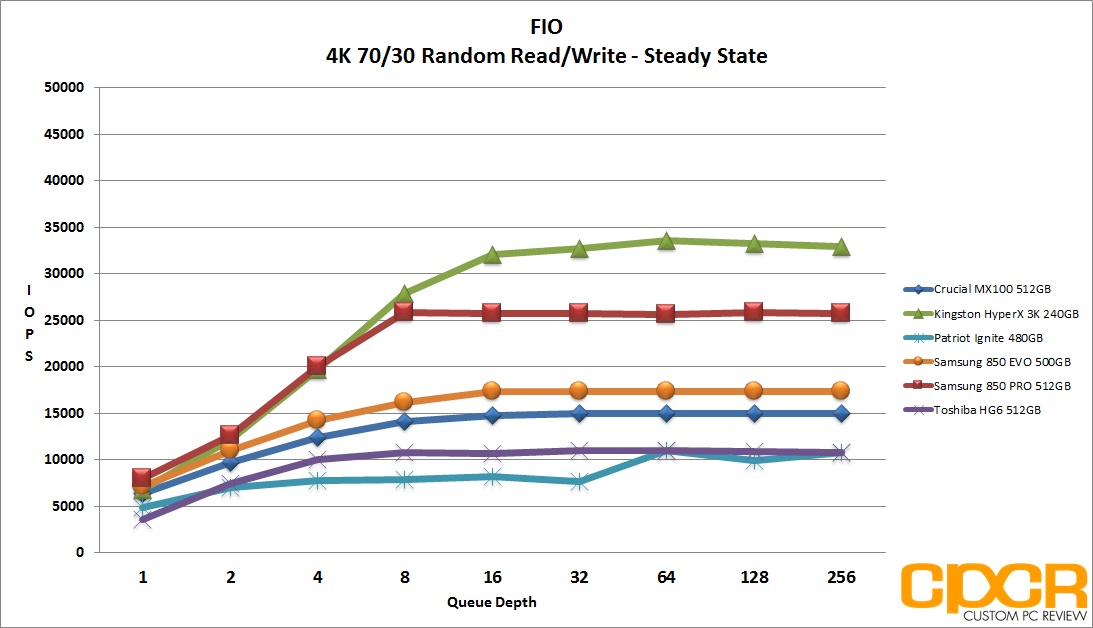
Our testing will include 4K read testing, 4K write testing, and 4K 70/30 read/write mix testing at queue depths of 1,2,4,8,16,32,64,128,256. The reason we’ve also included 4K 70/30 read/write mix testing is simply because most real world workloads will always fall somewhere between 0% write and 100% write rather than one or the other. Since client usage is much more read heavy, we’ll be using the 70/30 read/write mix.
For general client usage, performance will fall somewhere between queue depths of 1-4 whereas servers and other enterprise applications will easily see queue depths of 32 or greater.
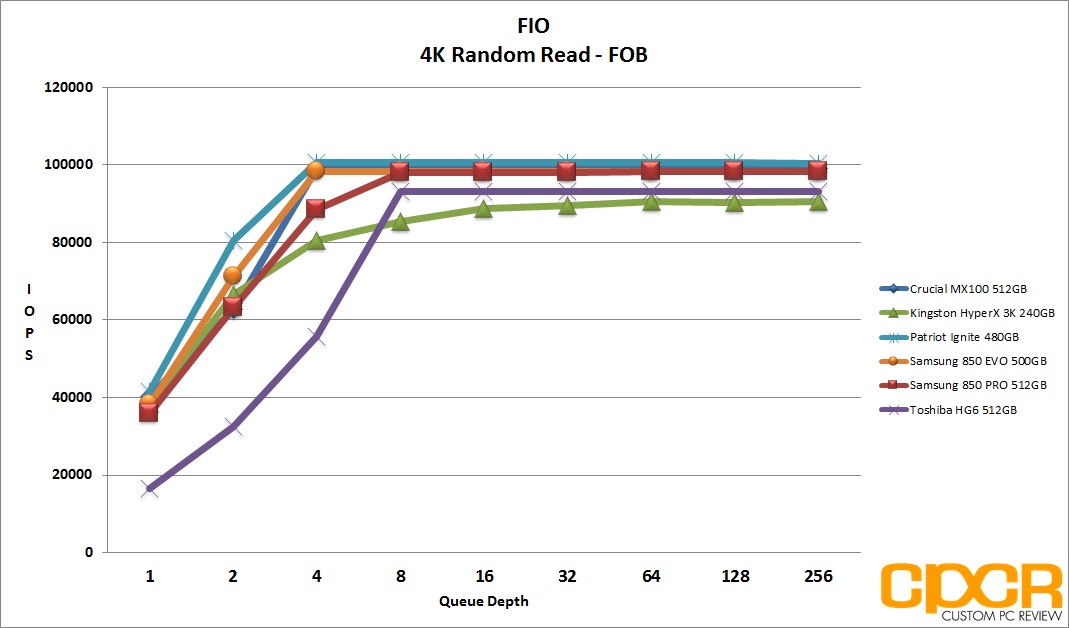
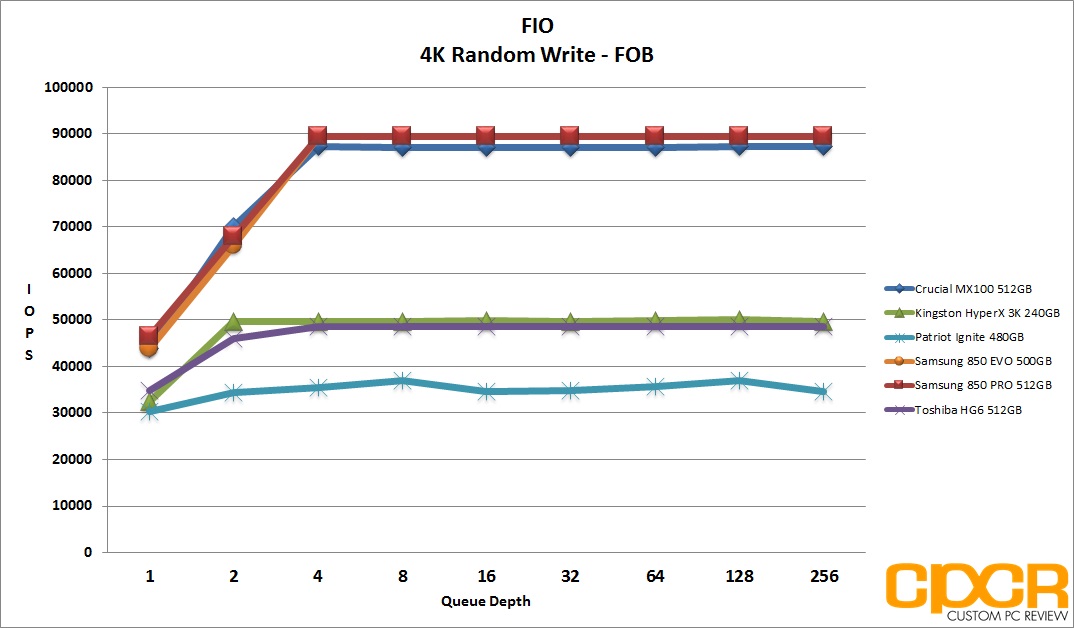
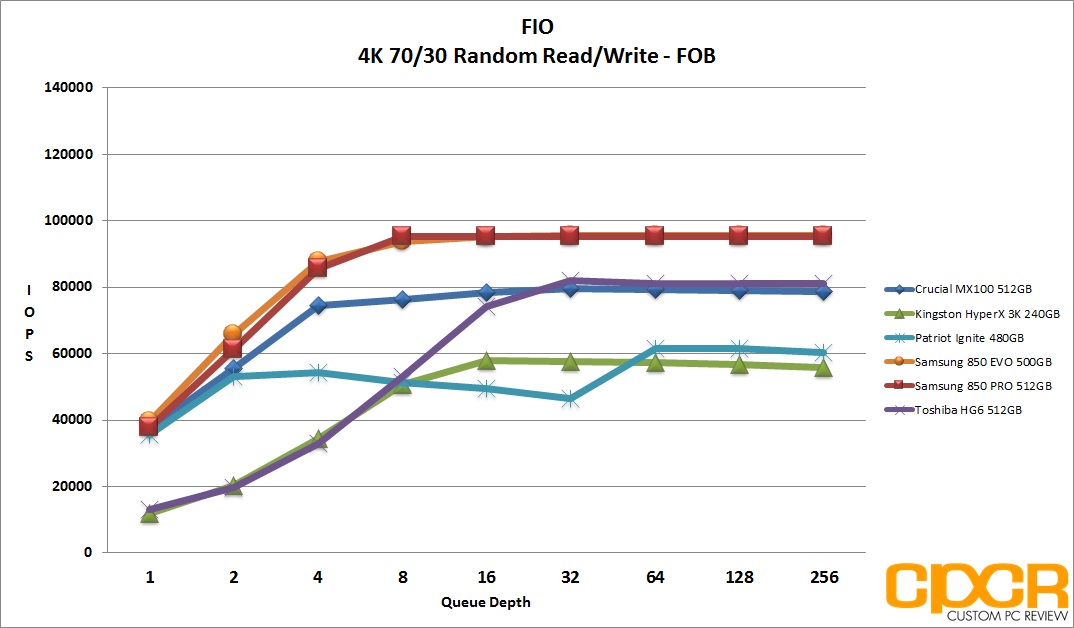
Performance Analysis
Fresh out of the box, the Patriot Ignite was able to pull off some extremely good 4K random read performance. Although rated at a very conservative 80,000 IOPS, random read performance reached ~101,000 IOPS which is the fastest we’ve seen from any SATA drive we’ve tested to date! Random write performance on the other than didn’t fare too well. Random write performance capped out at just ~37,000 IOPS, the lowest of any drive tested today. Mixed workload performance however was competitive at the lower queue depths.
[section label=”7. FIO – Steady State”]
Patriot Ignite 480GB Performance
FIO – Steady State Testing
After prolonged use of an SSD, it will reach “steady state” where performance levels off to a minimum level. The FOB state is the “best case scenario” for SSD performance while “steady state” is going to be your worst. Here, we ran the exact same set of benchmarks we just completed in the FOB state; except this time around, we’ll be preconditioning the drive by filling 100% of the drive’s LBAs with two sequential passes of 128k data followed by hammering the drive for six hours with 4K random data prior to actual testing.
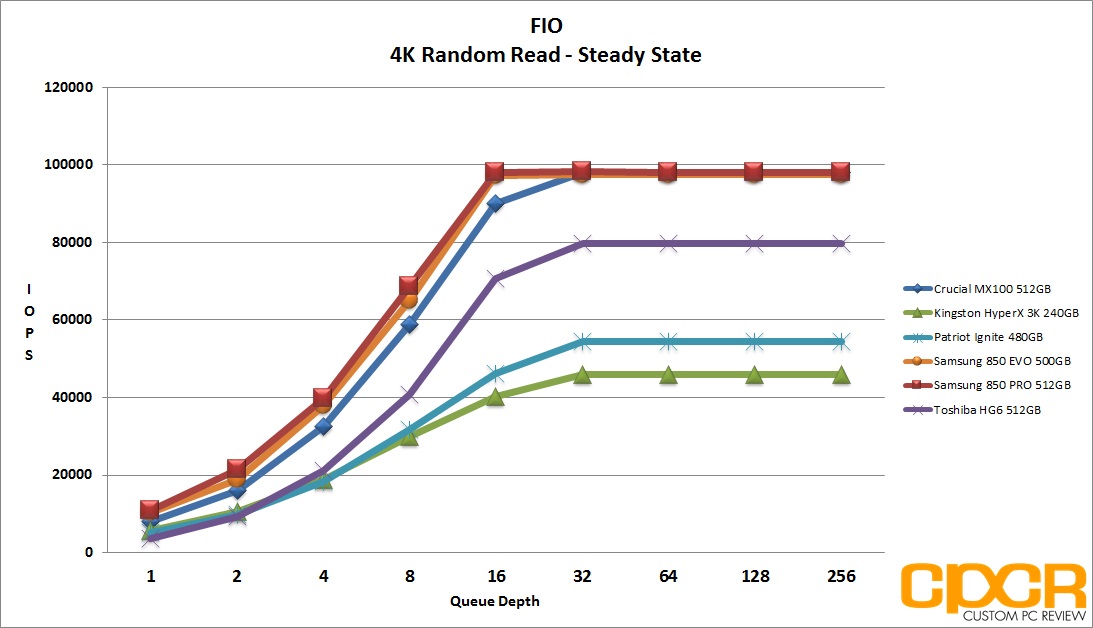
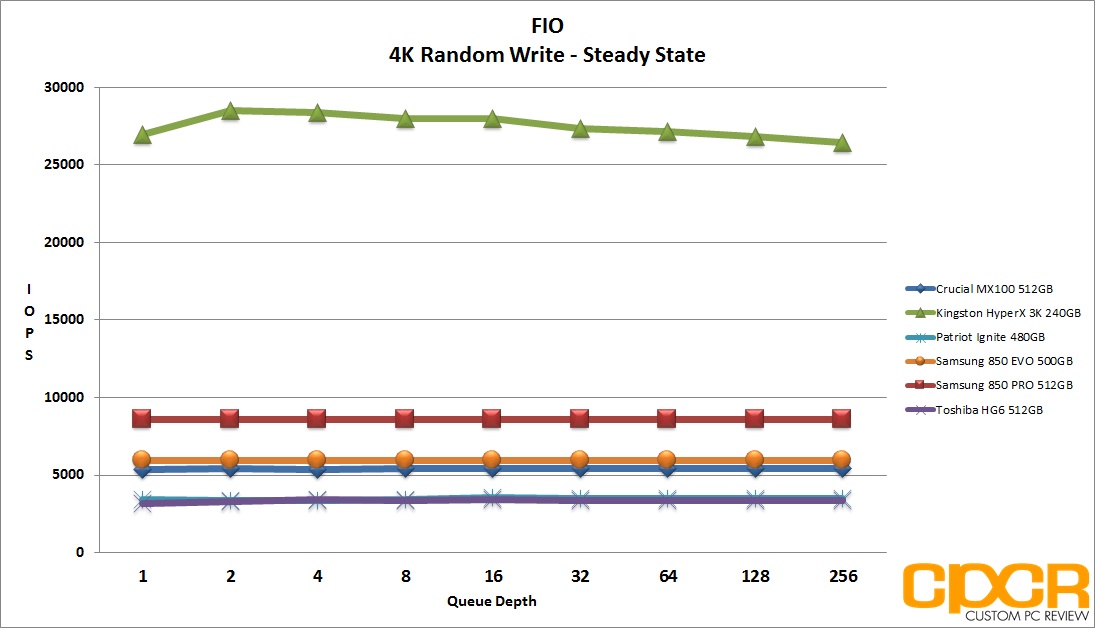
Performance Analysis
Moving into steady state, the Patriot Ignite doesn’t perform nearly as well. In 4K random reads, performance is nearly halved with the drive topping out at just ~54,000 IOPS at QD32. 4K random write performance didn’t fare too well either with drive performance coming in at just under ~4,000 IOPS.
[section label=”8. FIO – 4K Random Write Consistency”]
Patriot Ignite 480GB Performance
FIO 4K Random Write Consistency Testing
Another one of the benefits of testing with FIO is the flexibility of running consistency tests, which is one of the most important metrics when considering SSDs going forward. Looking at the results of our benchmarks such as ATTO Disk Benchmark and Crystal Disk Benchmark, we can see that practically every top tier SSD is capable of saturating SATA 6Gb/s in the FOB state. However, what really differentiates these SSDs is their ability to hold a certain level of performance even after extended periods of use.
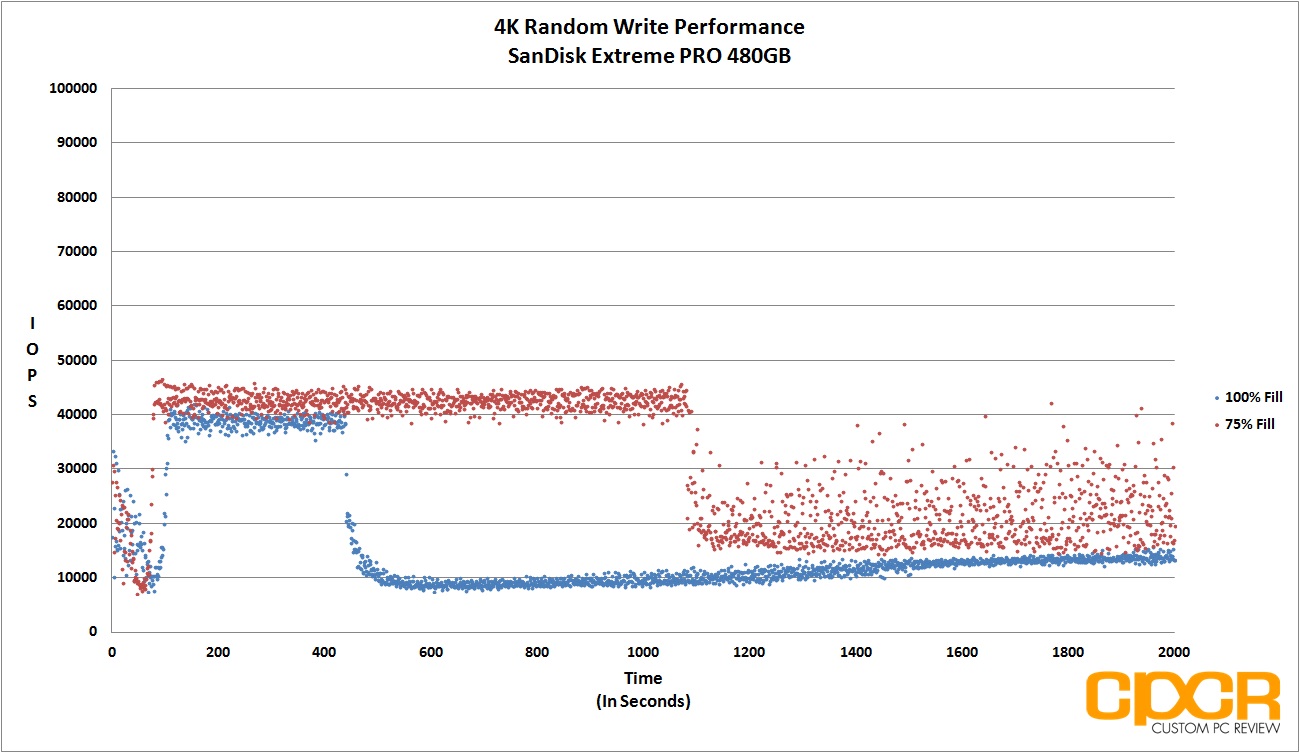
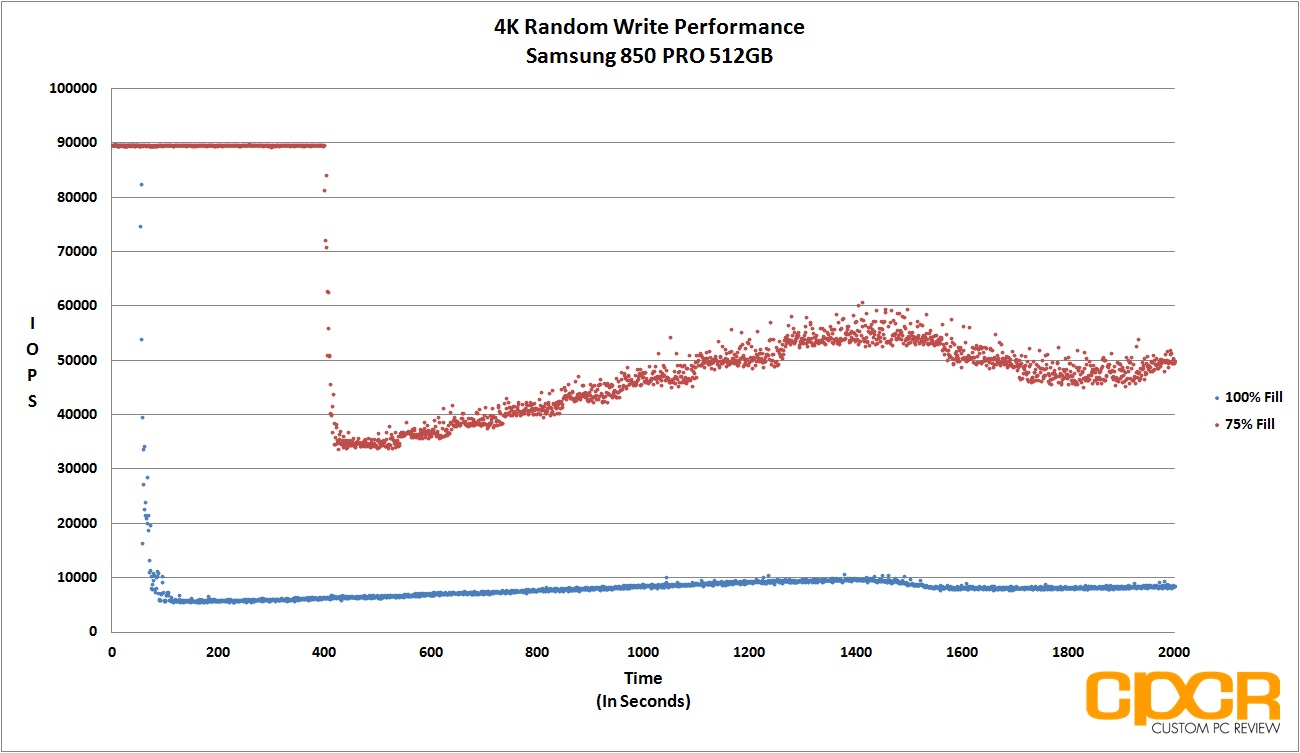
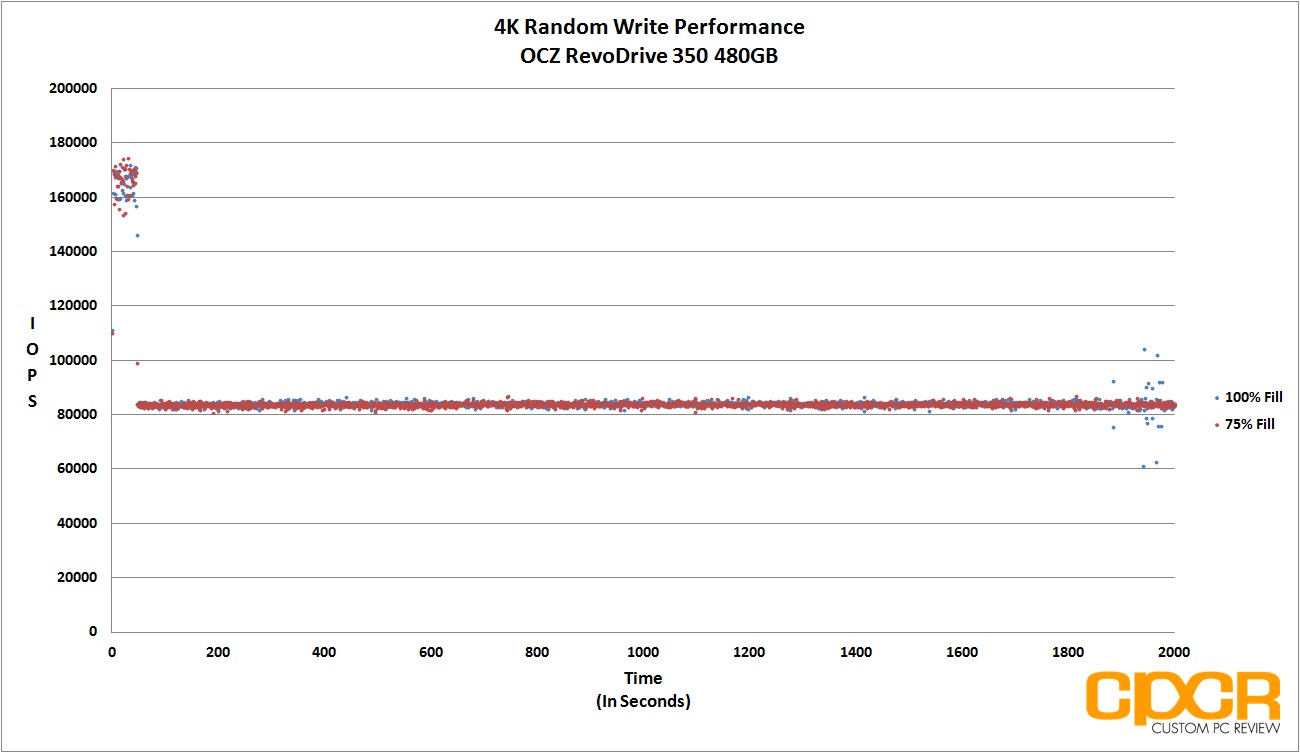
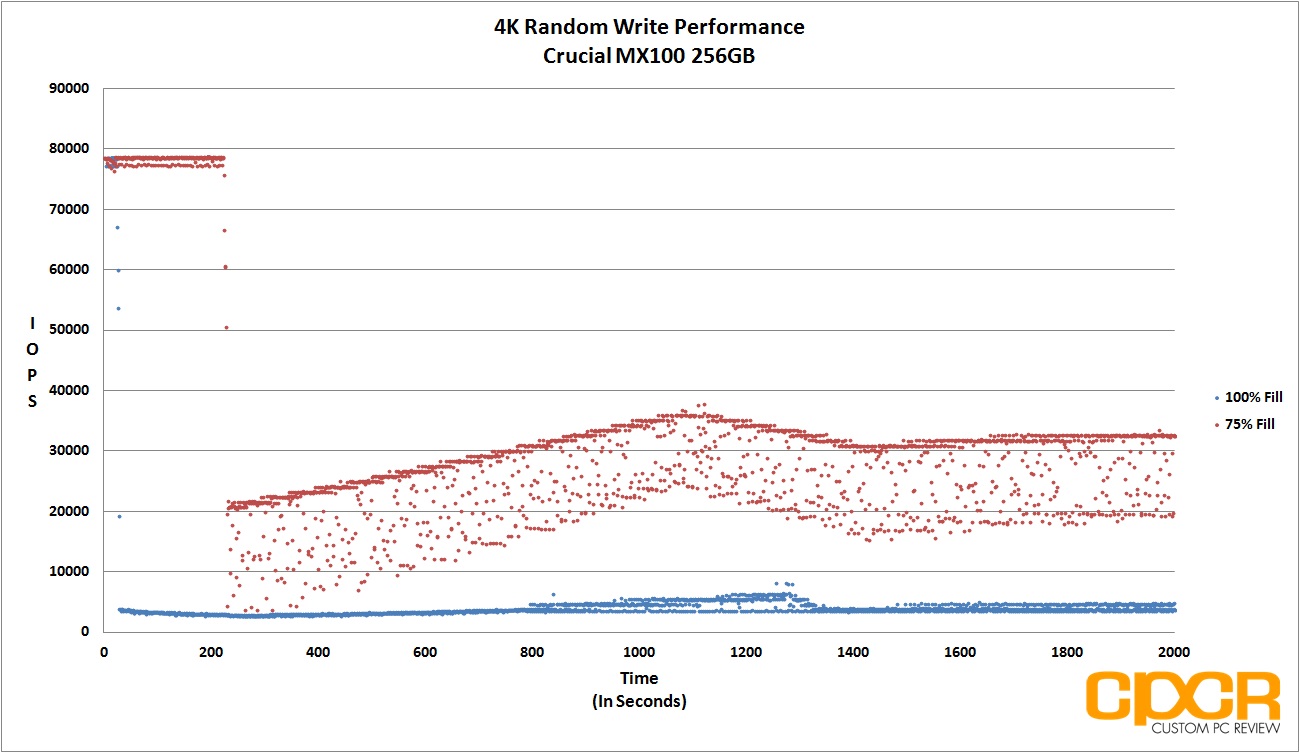
For our consistency testing, we used a fairly standard method, which includes both filling up 75% of capacity as well as 100% capacity twice with sequential 128k data followed by the actual test itself, which is simply running 4K random writes at a queue depth of 32. By recording the IOPS every second for 2,000 seconds, we’re able to get a good look at what kind of performance can be expected when the drive is relatively new, when it’s heading towards steady state, and when it’s actually in steady state.
[tabgroup]
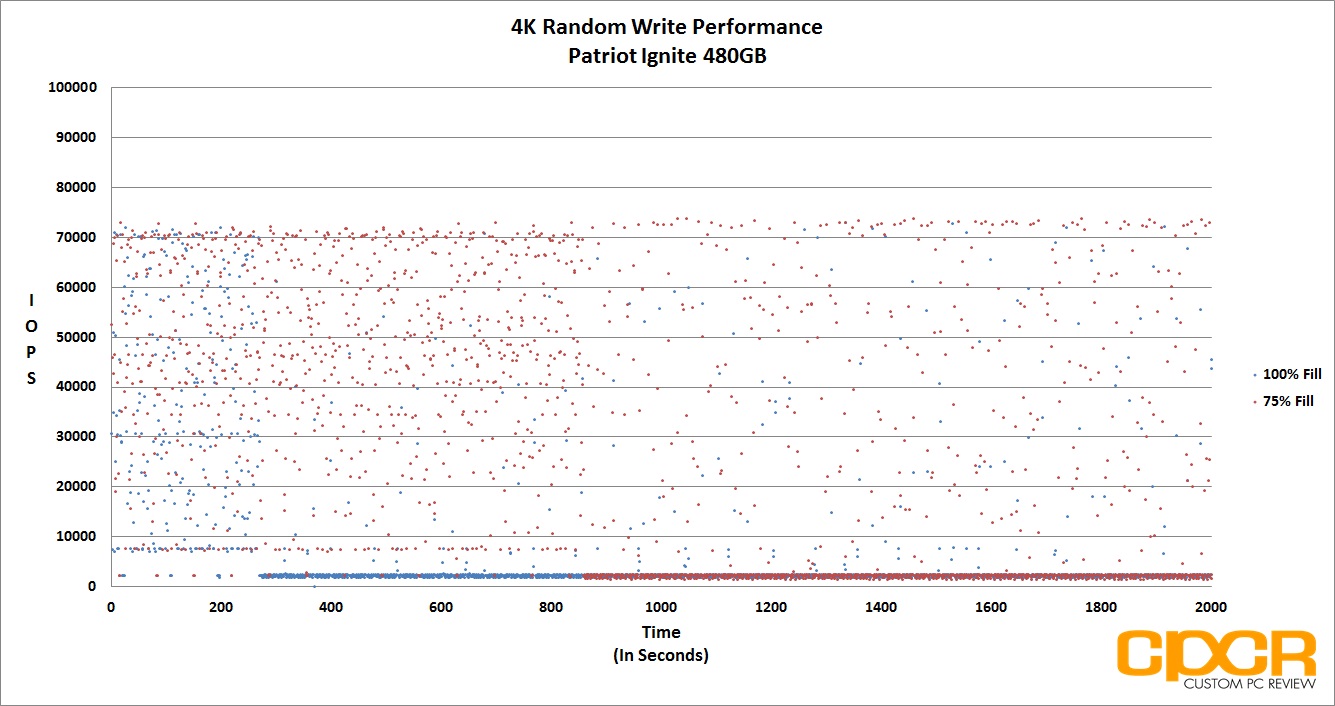
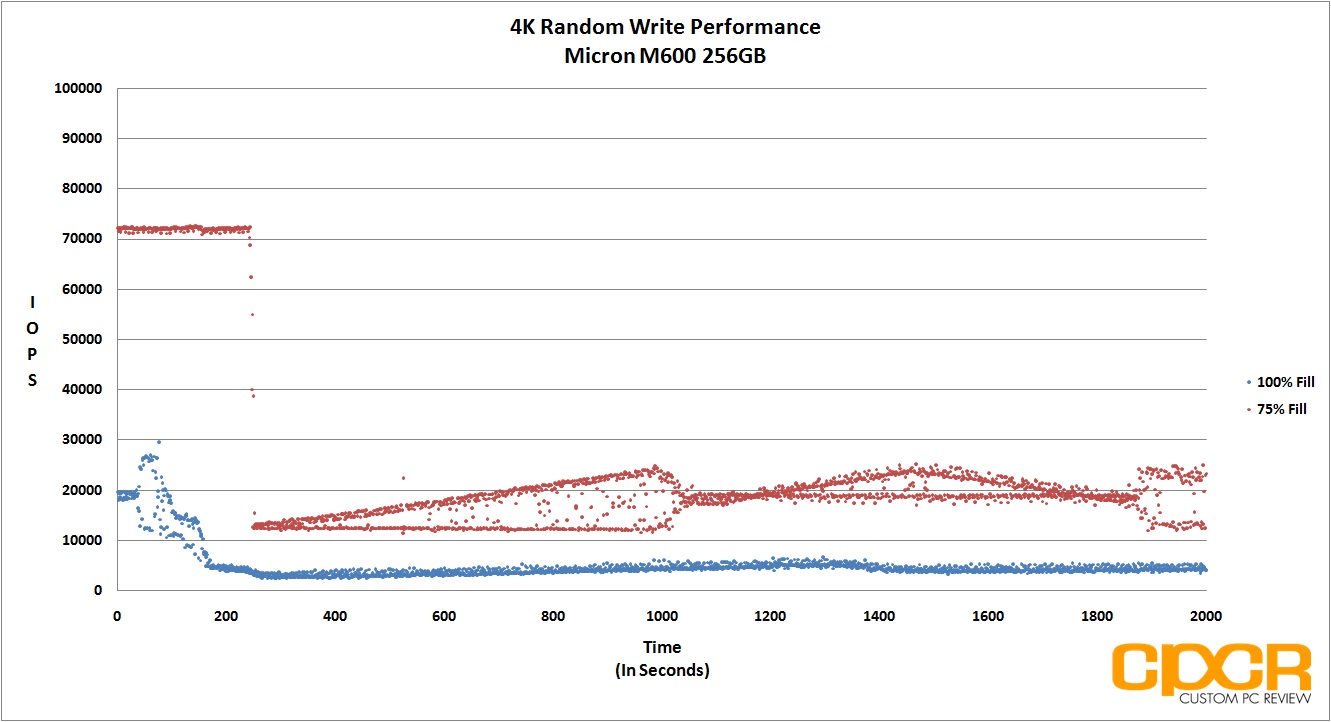
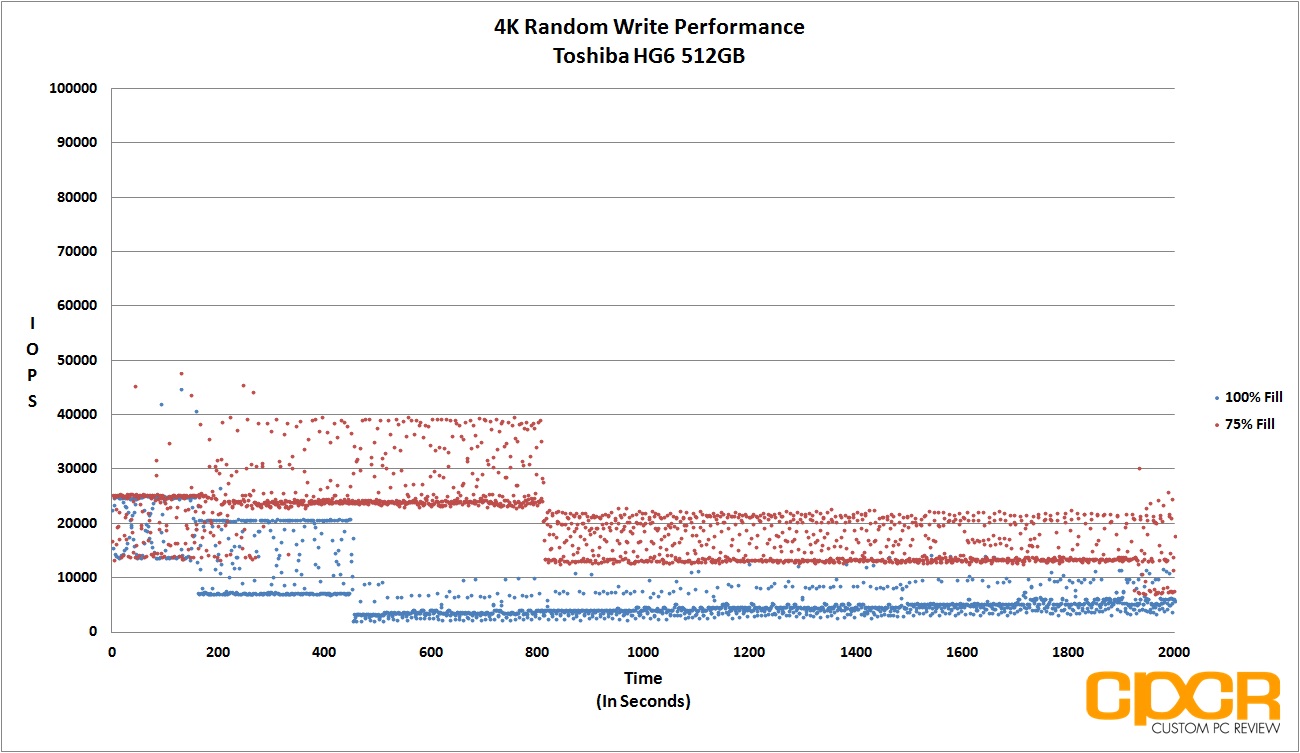
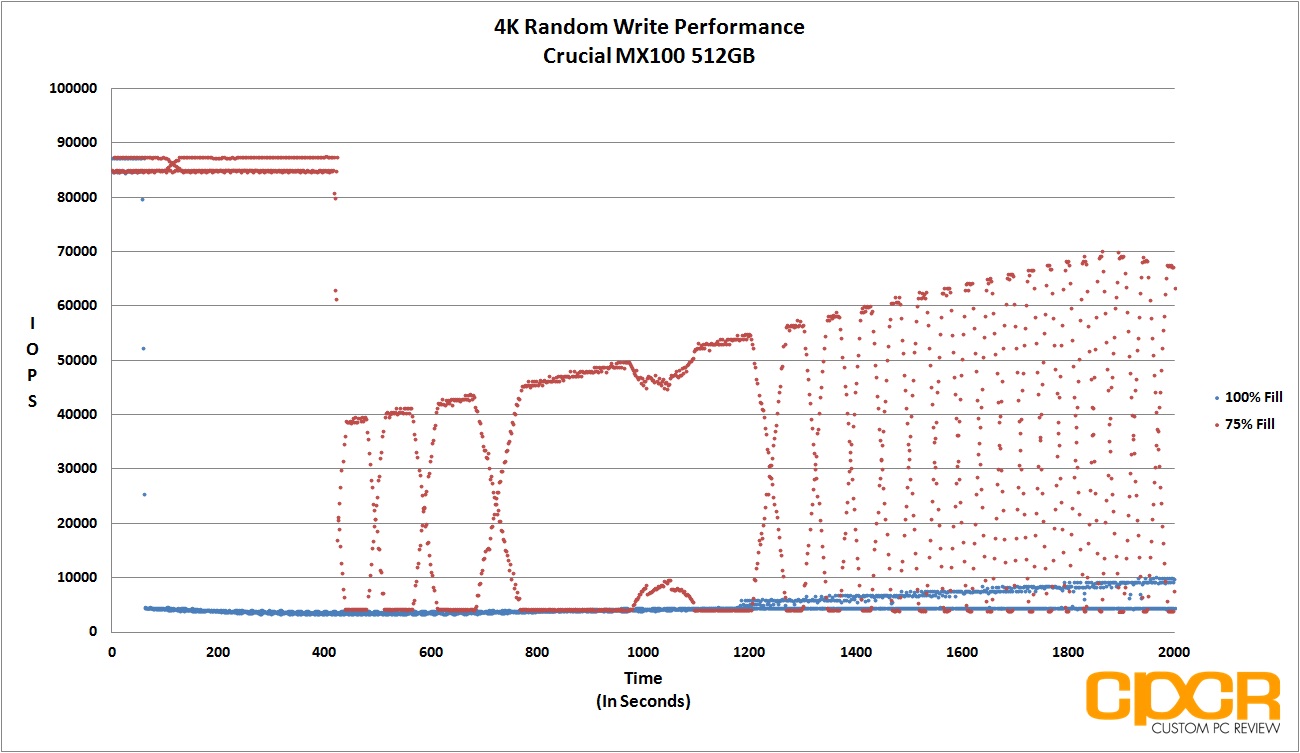
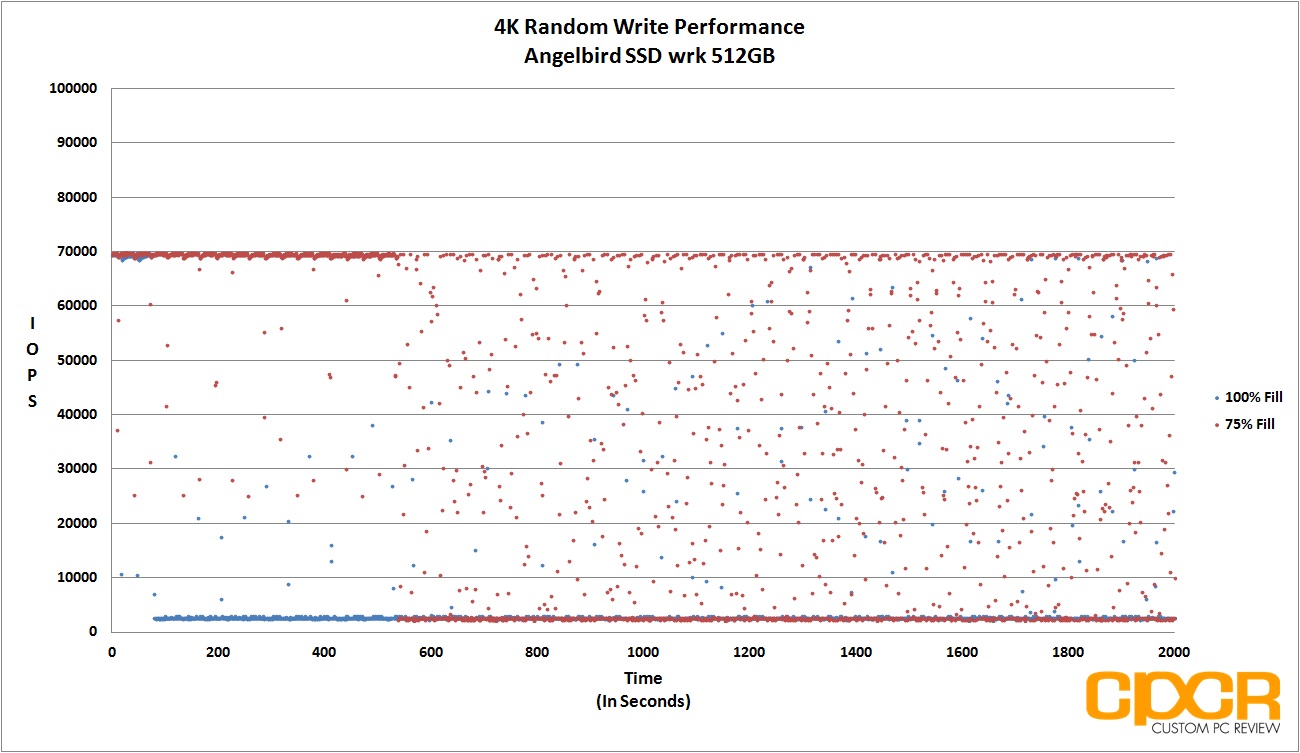
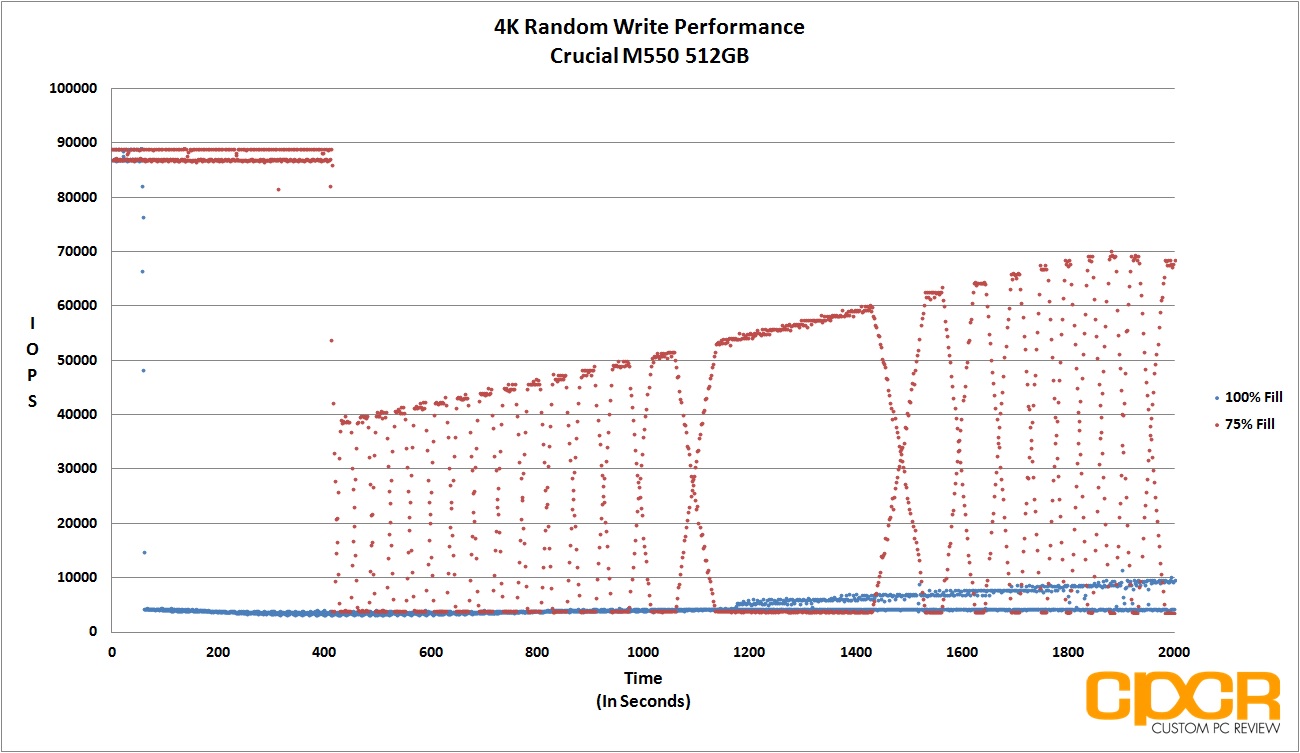
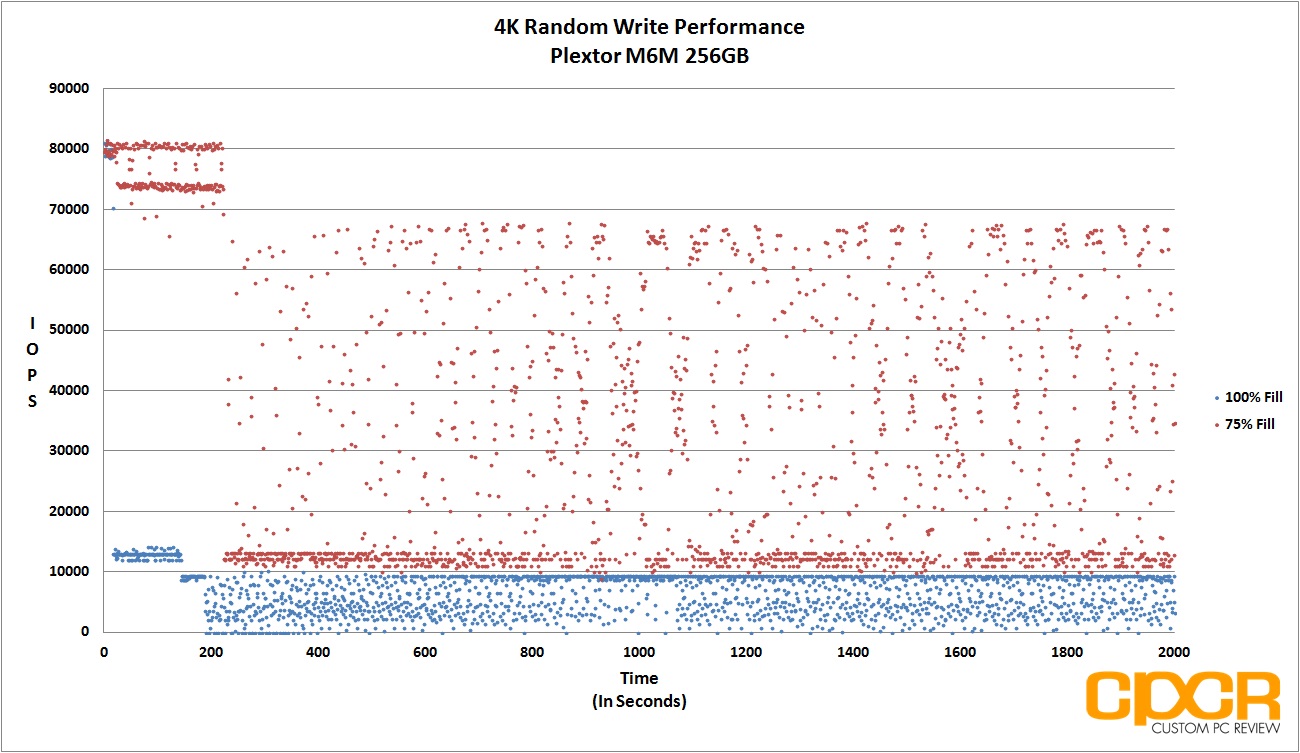
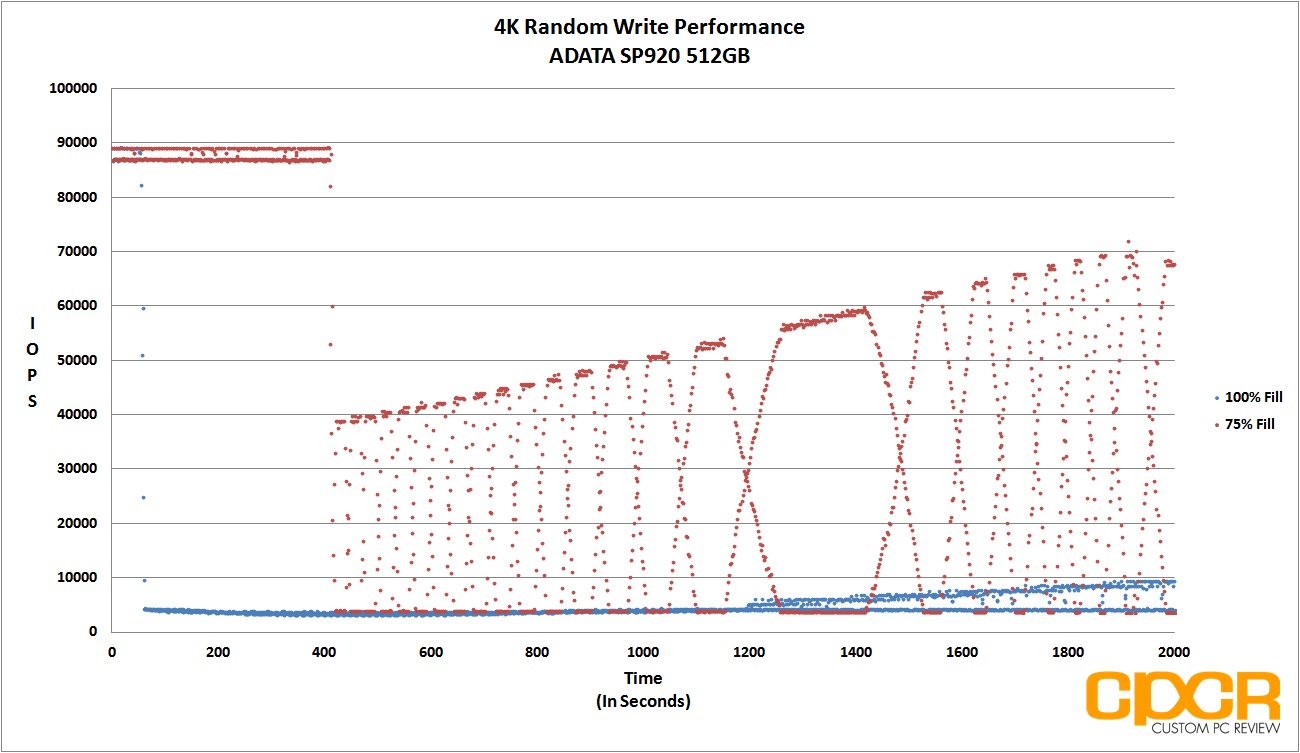
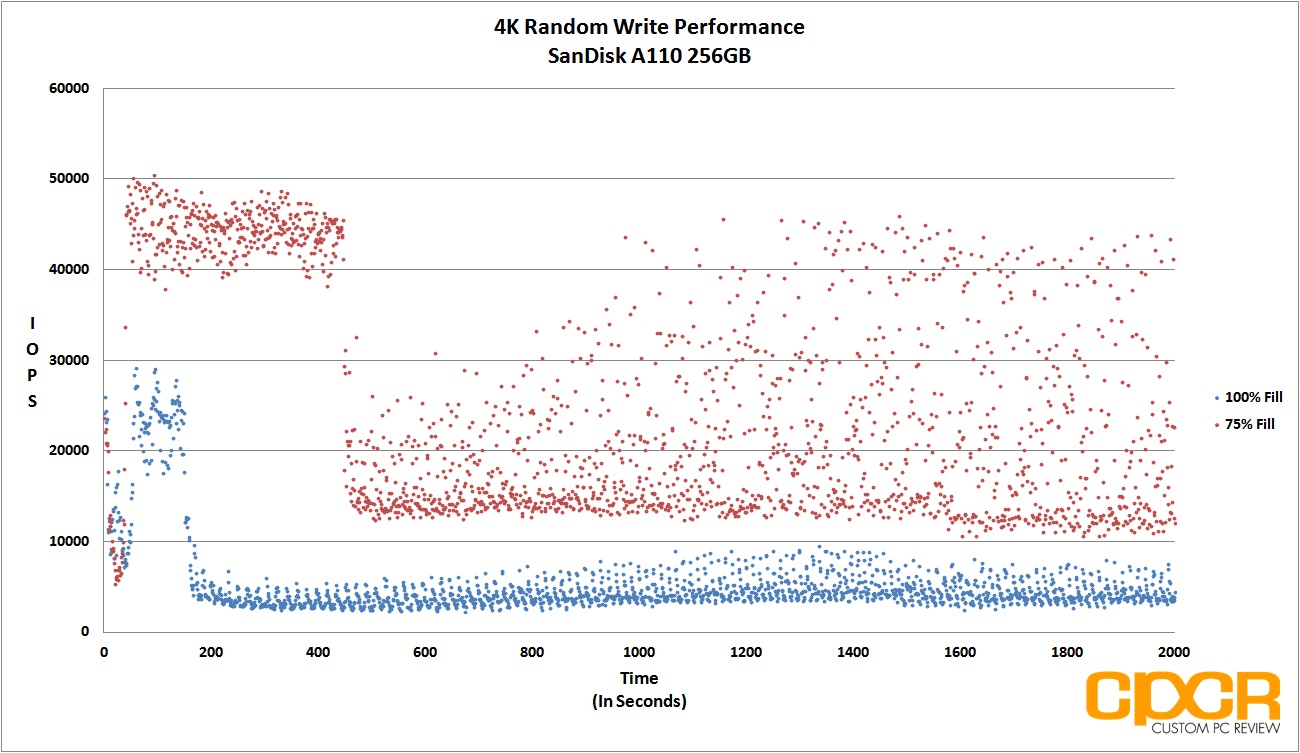
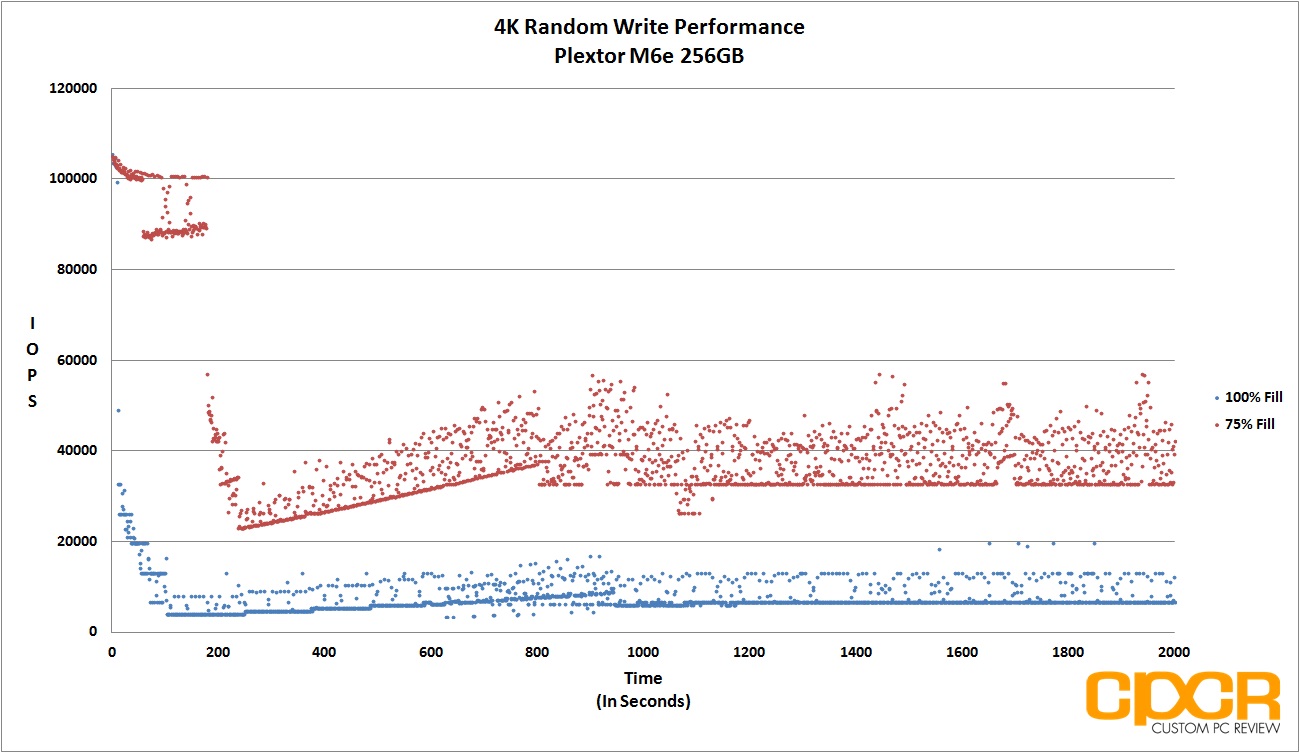
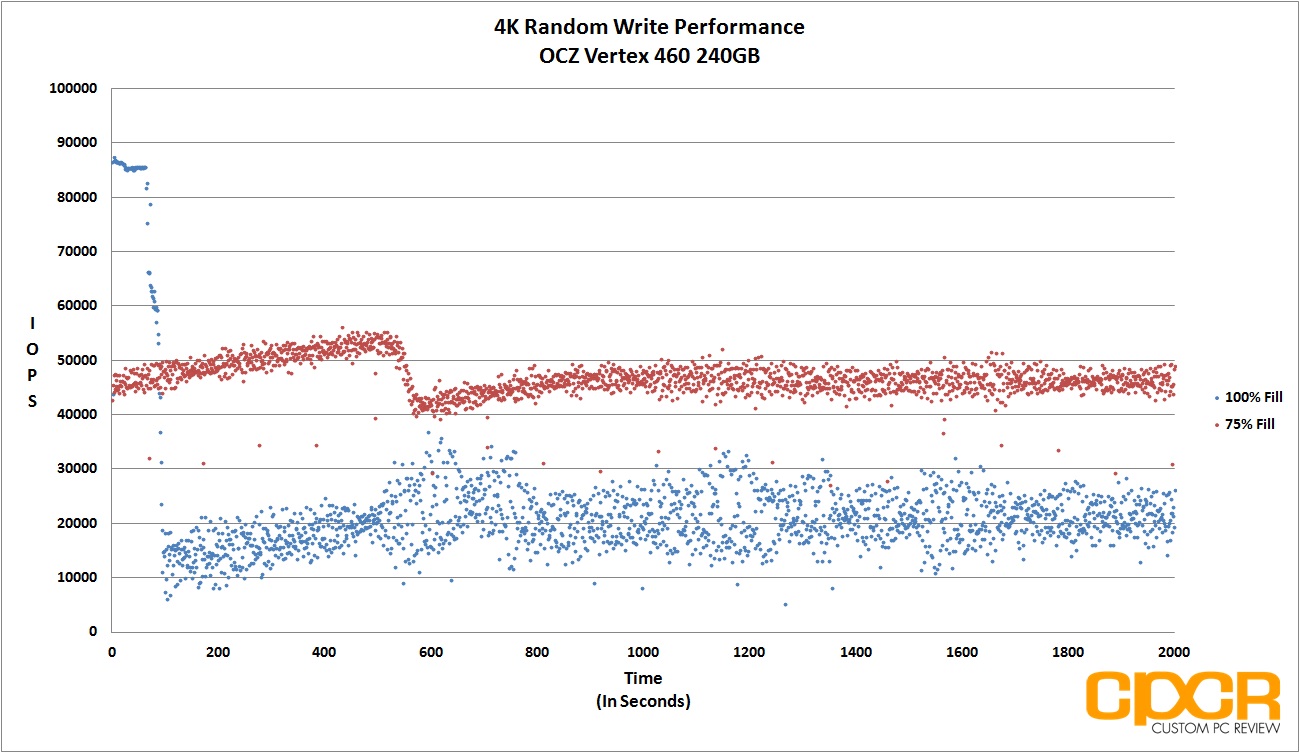
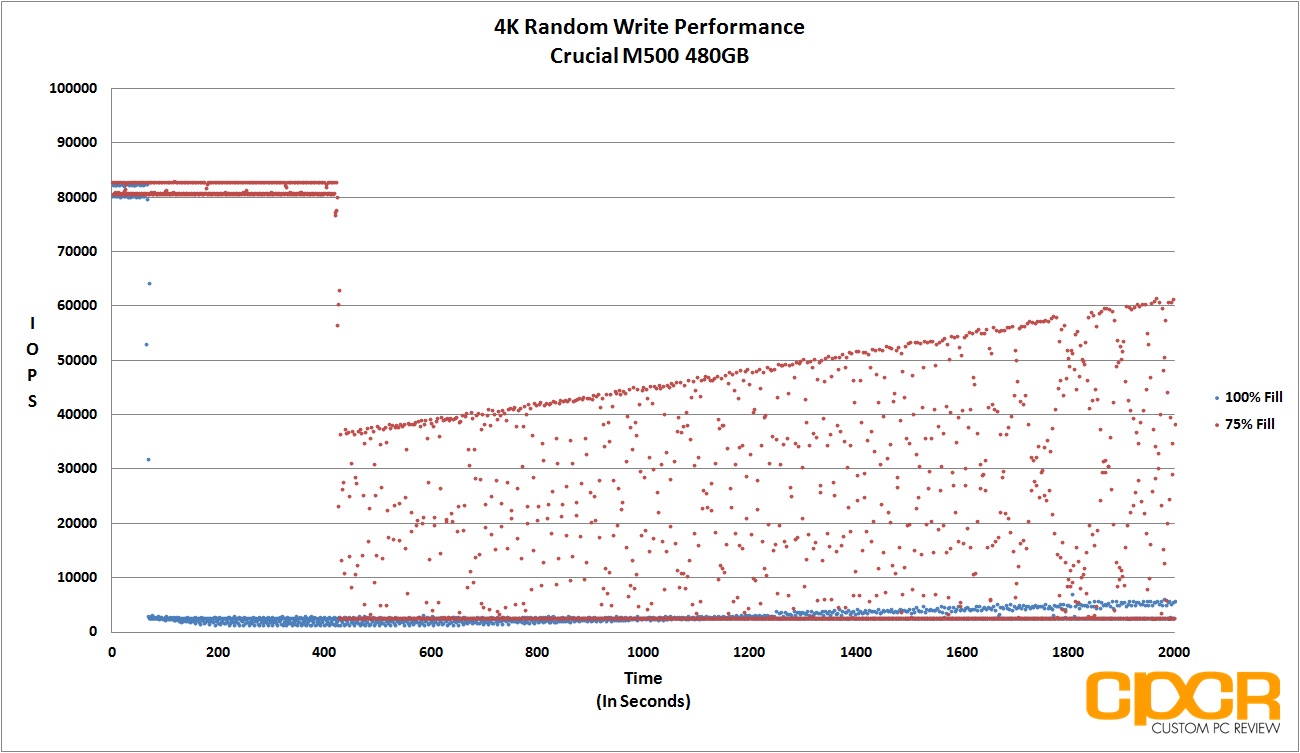
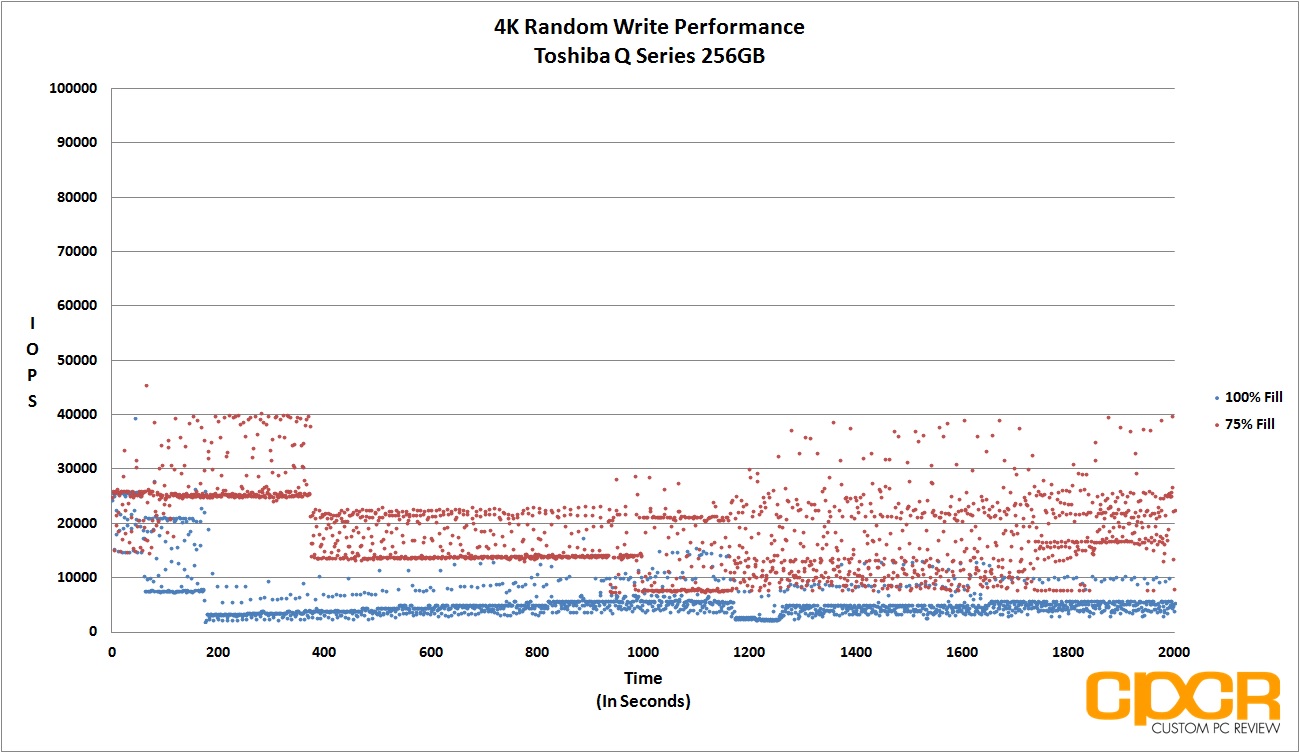
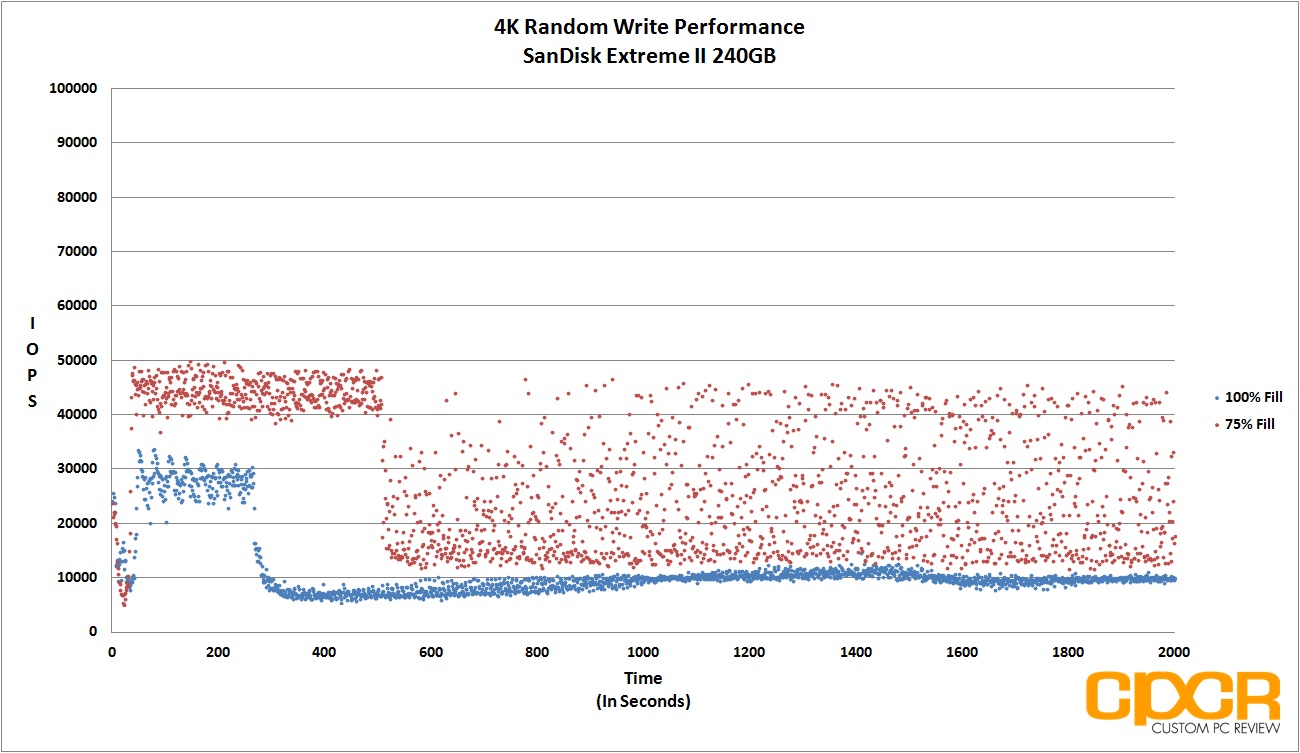
Performance Analysis
With its asyncrhonous NAND, the Patriot Ignite 480GB’s 4K random write performance is both slow and inconsistent. Performance varied from just under ~2,000 IOPS to just over 71,000 IOPS both when testing the drive at 75% fill and 100% fill. Extra spare area appears to make very little difference at steady state.
[section label=”9. FIO – 4K Random Write Latency”]
Patriot Ignite 480GB Performance
FIO 4K Random Write Latency Testing
Another metric that’s becoming increasingly important in SSDs is its ability to keep latency low despite being subjected to a heavy workload. Even if a SSD were capable of ultra high and ultra consistent IOPS performance, if latency were high, users would still feel that the drive is slow. Ideally, SATA SSDs should always be capable of latencies under 50ms, even during heavy workloads.
For latency testing, we’ll be using the exact same testing parameters as IOPS consistency testing, except instead of recording IOPS every second, we’ll be recording latency.
[tabgroup]
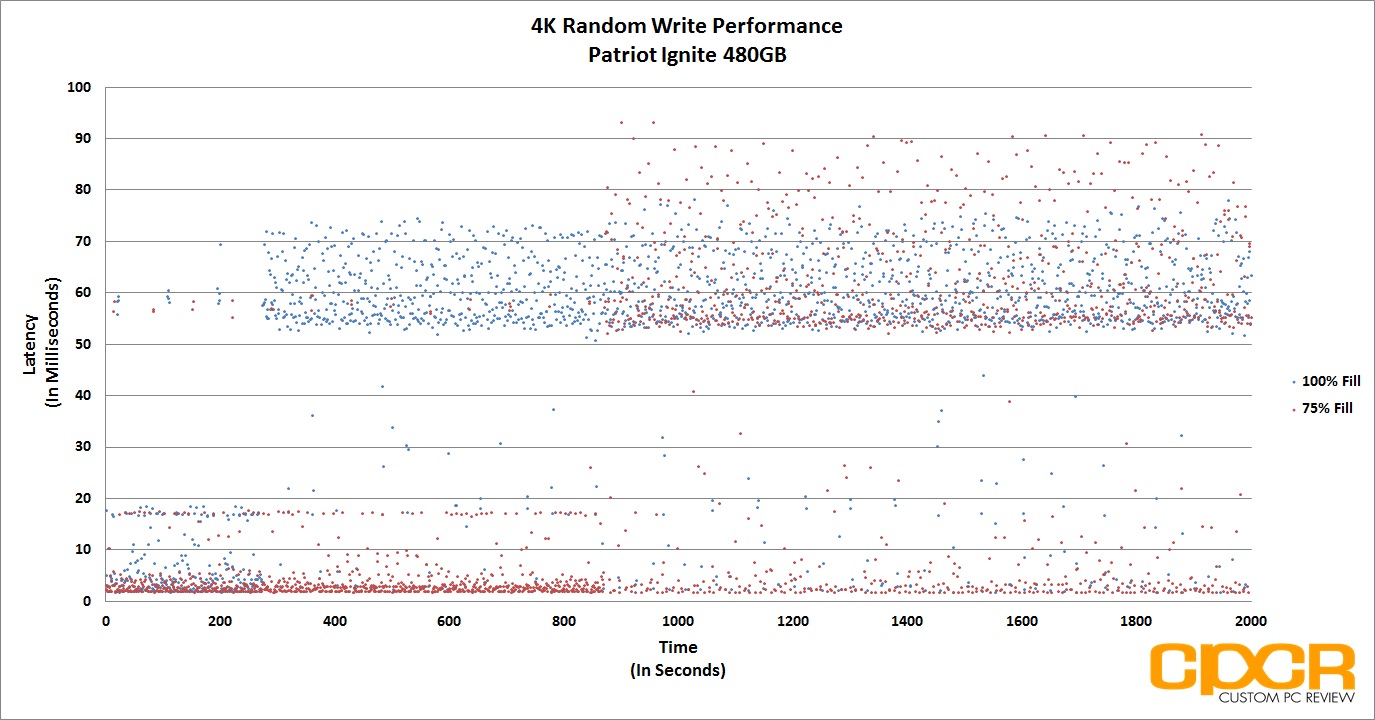
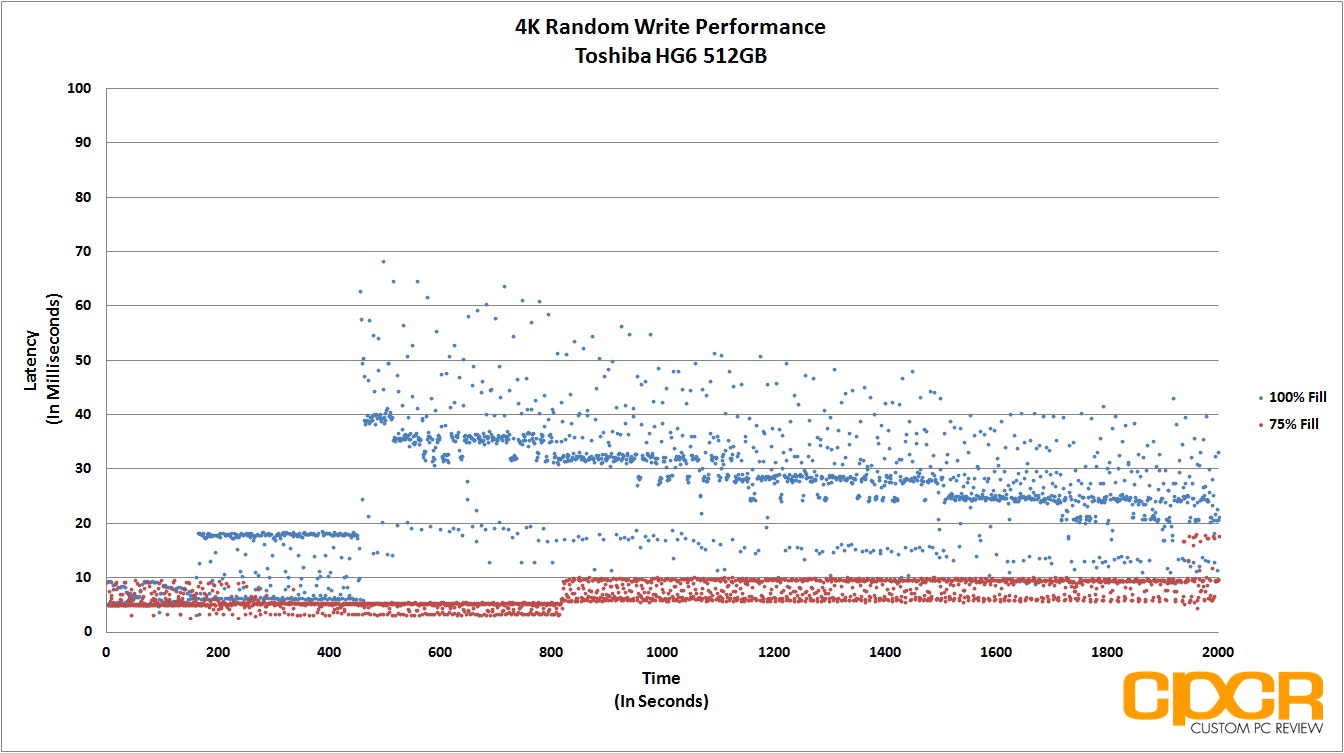
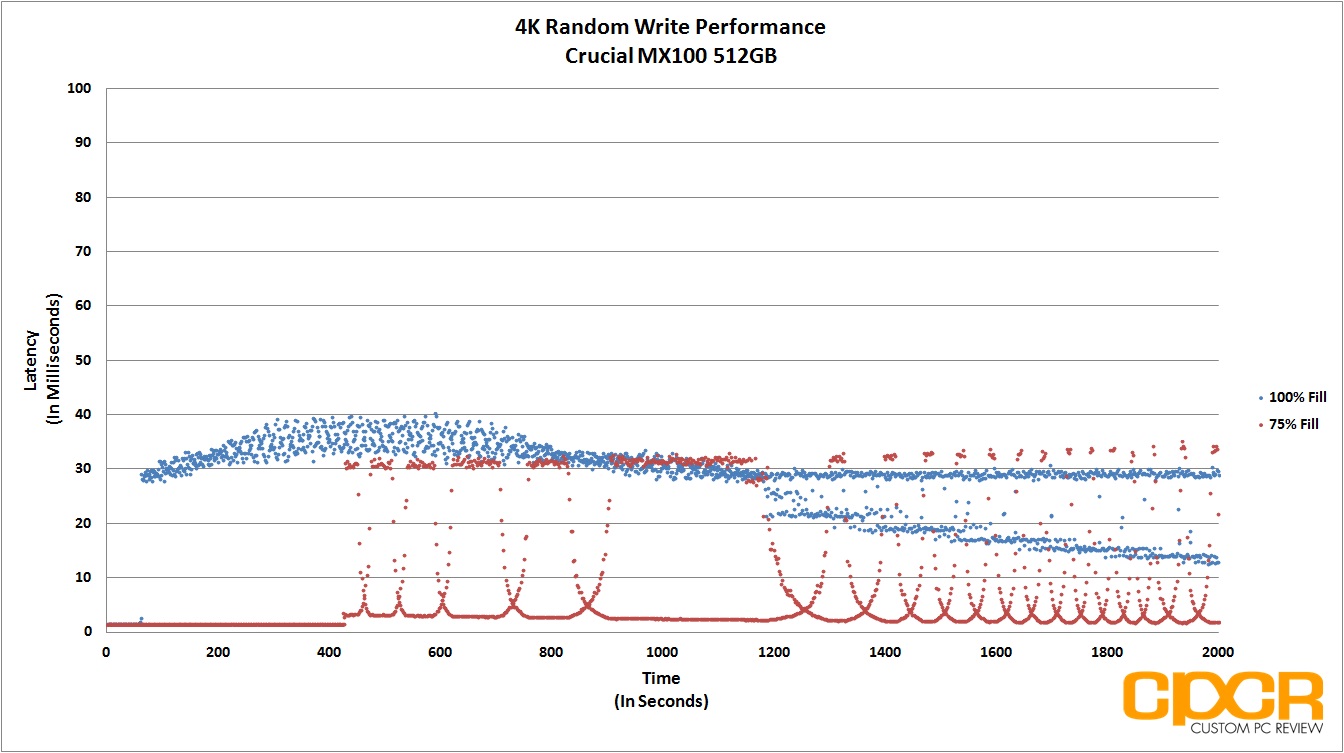
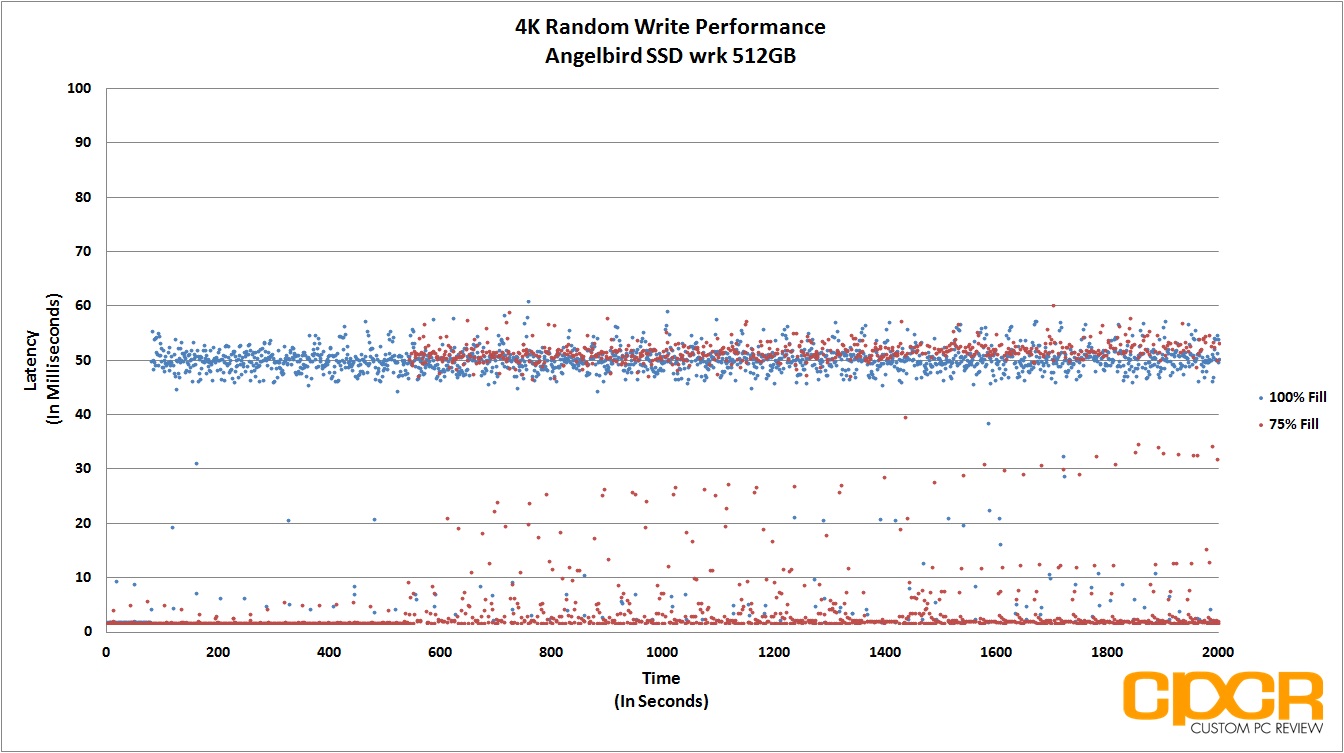
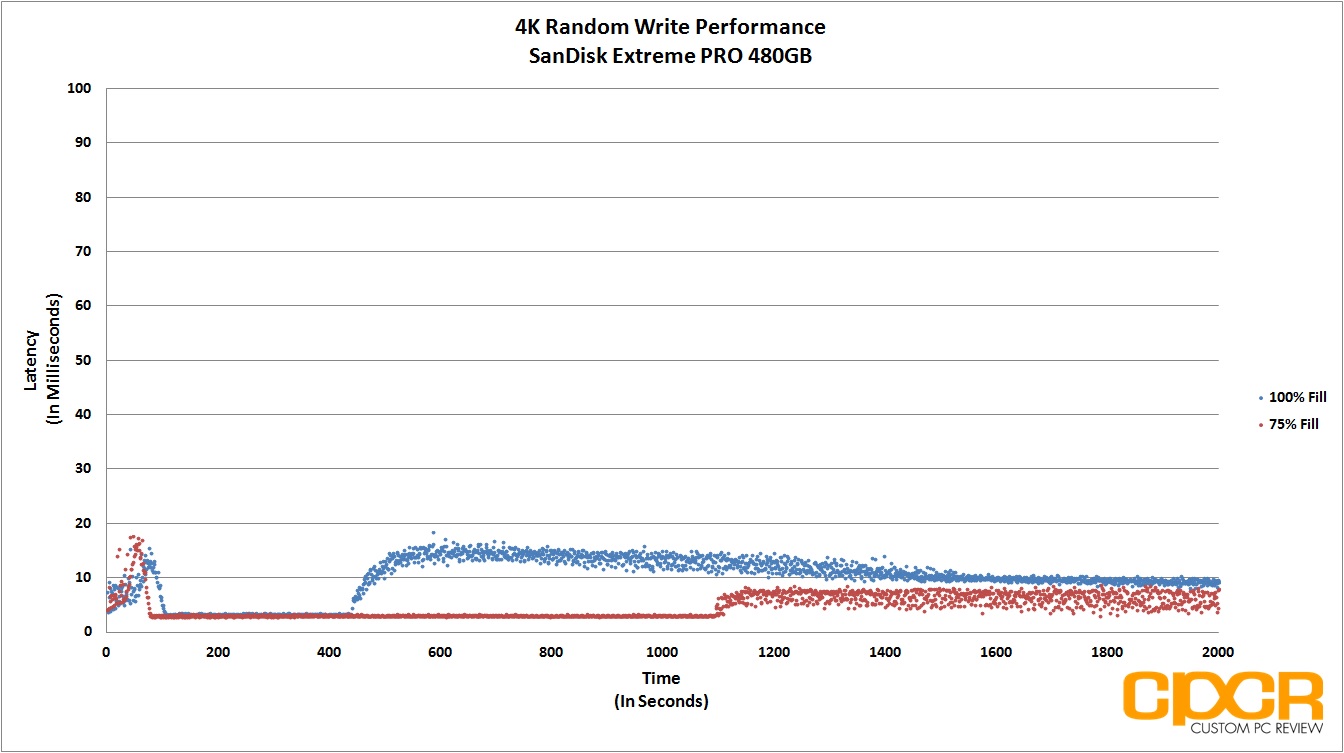
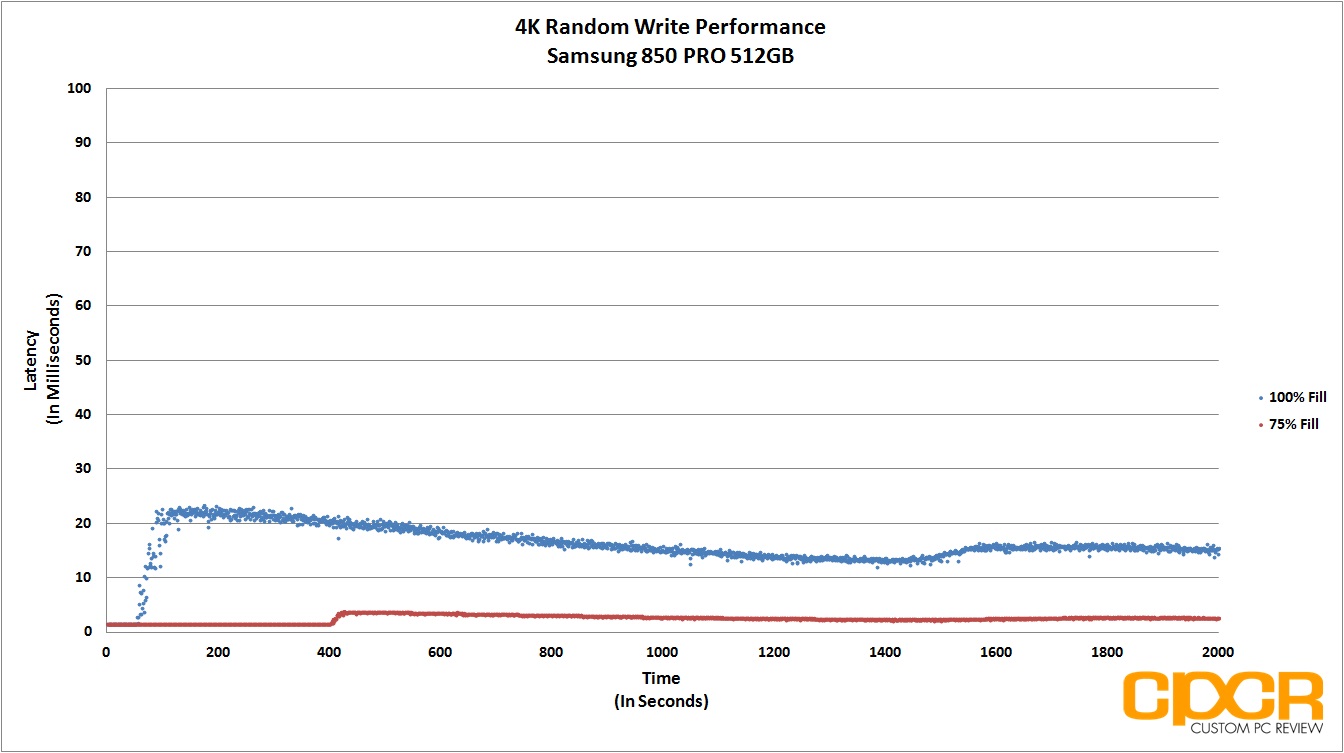
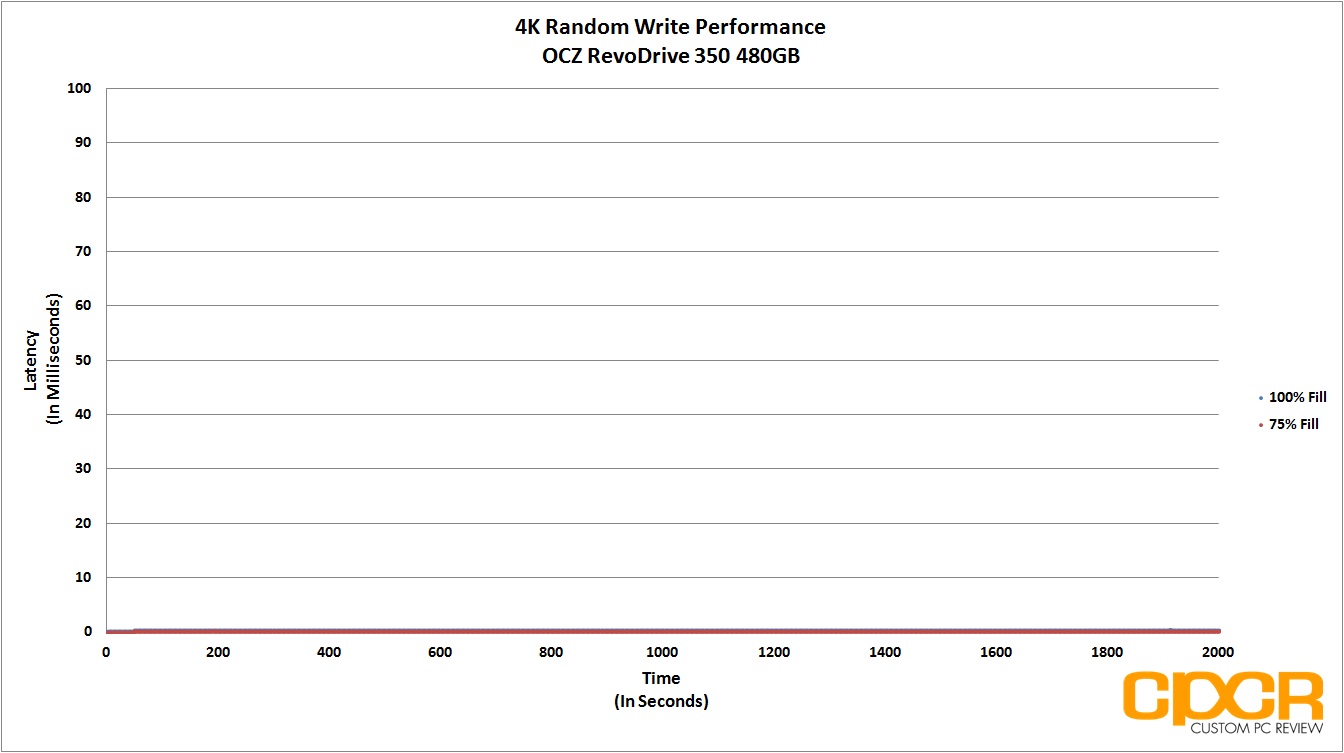
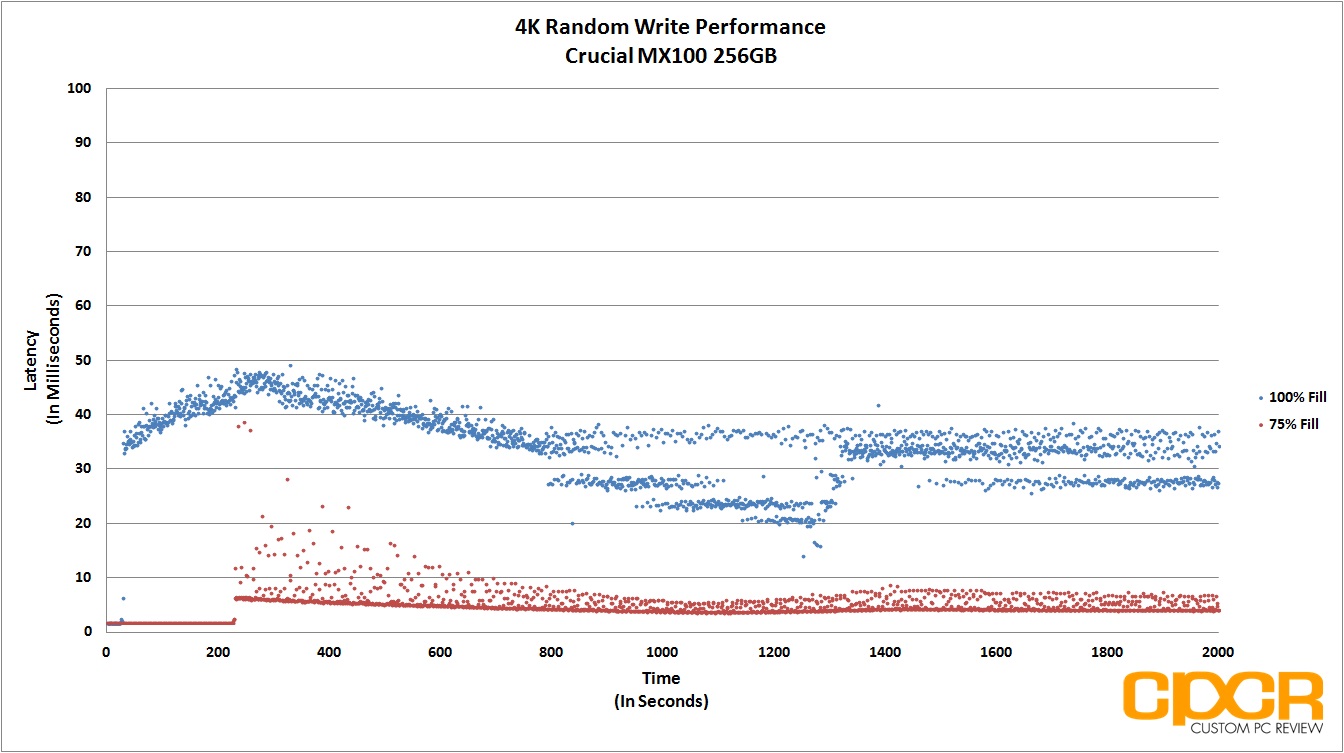
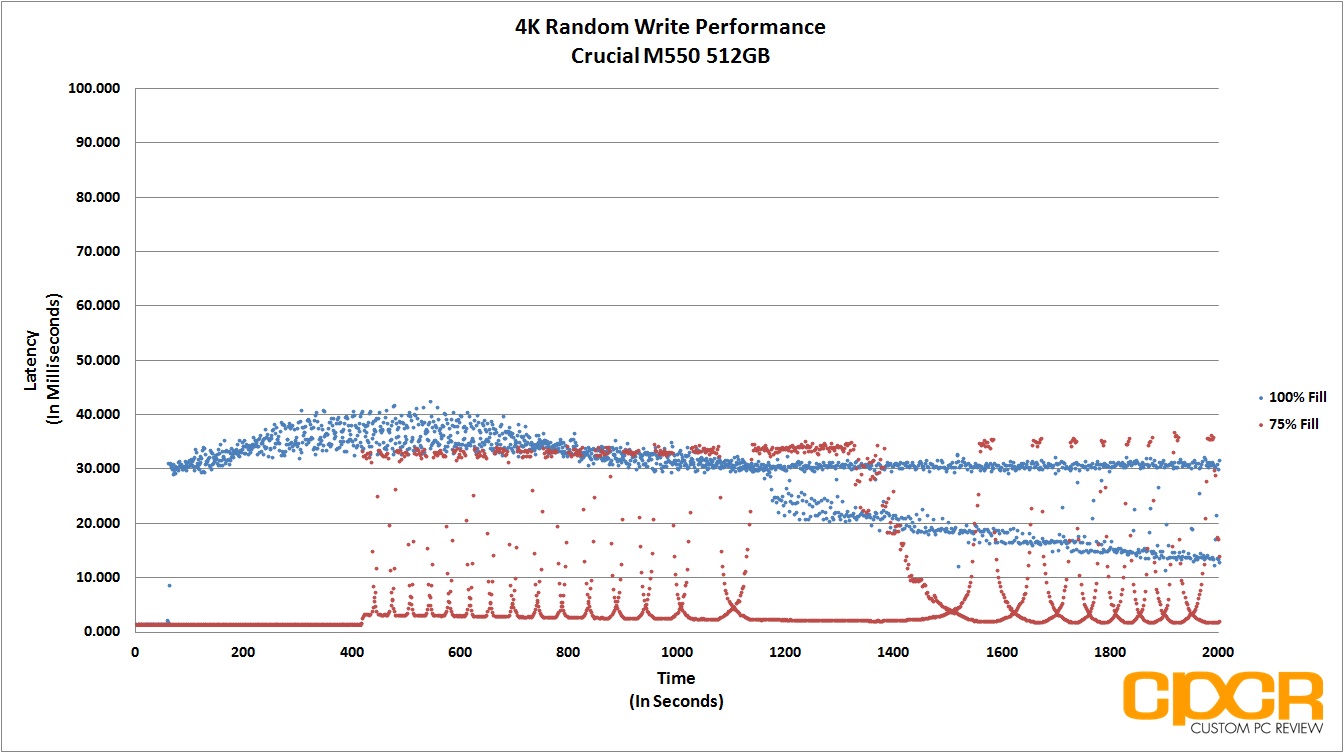
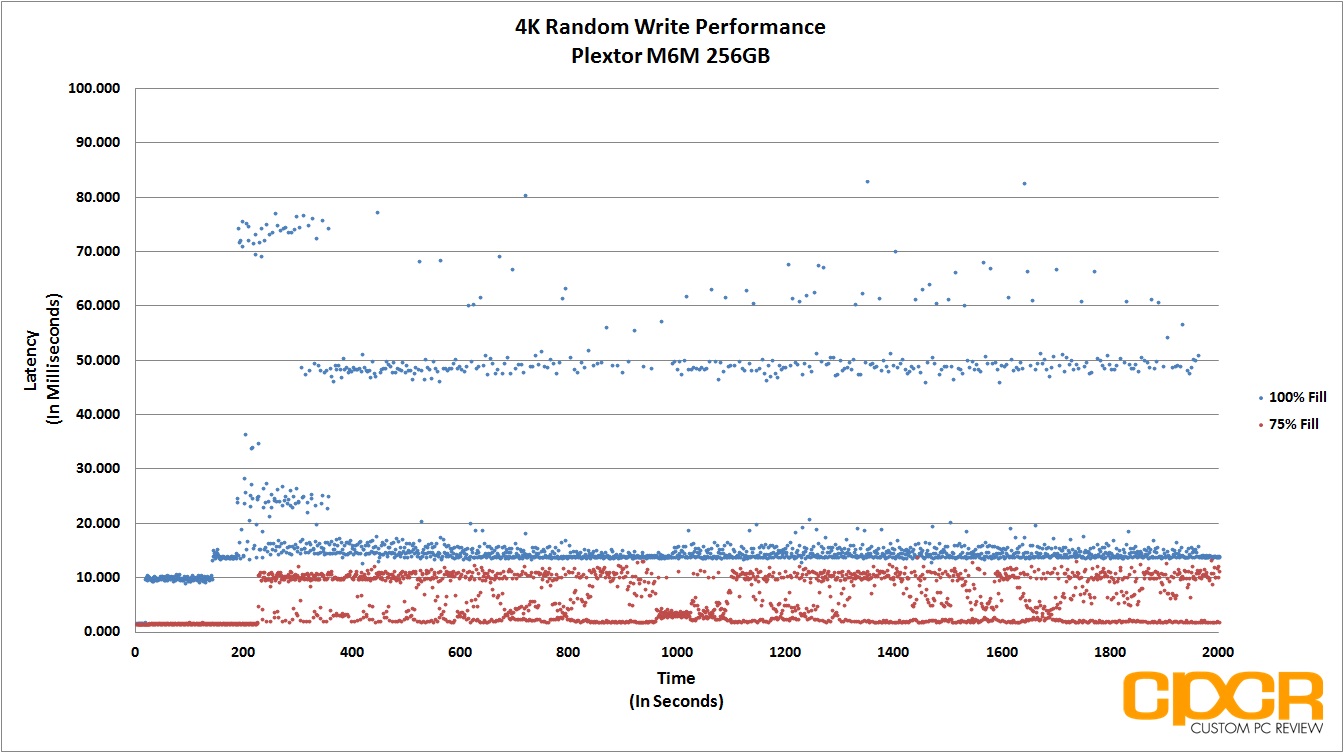
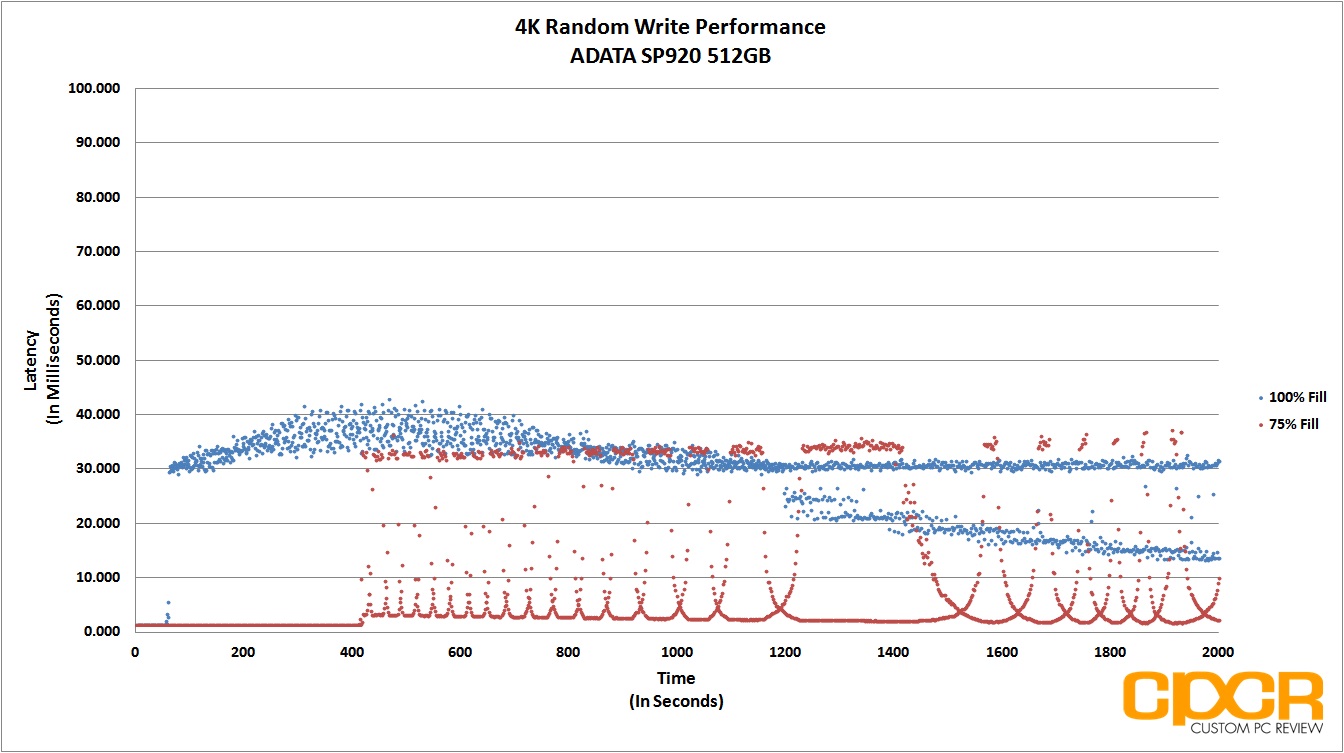
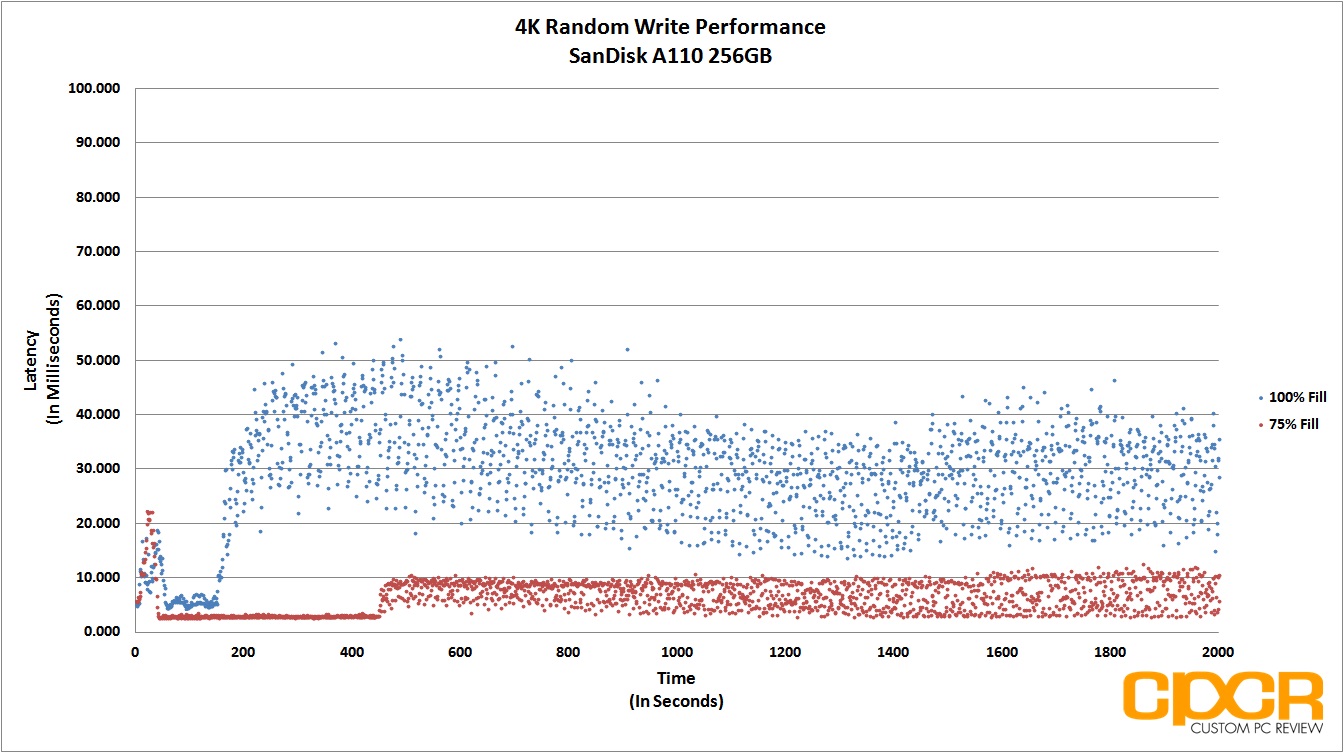
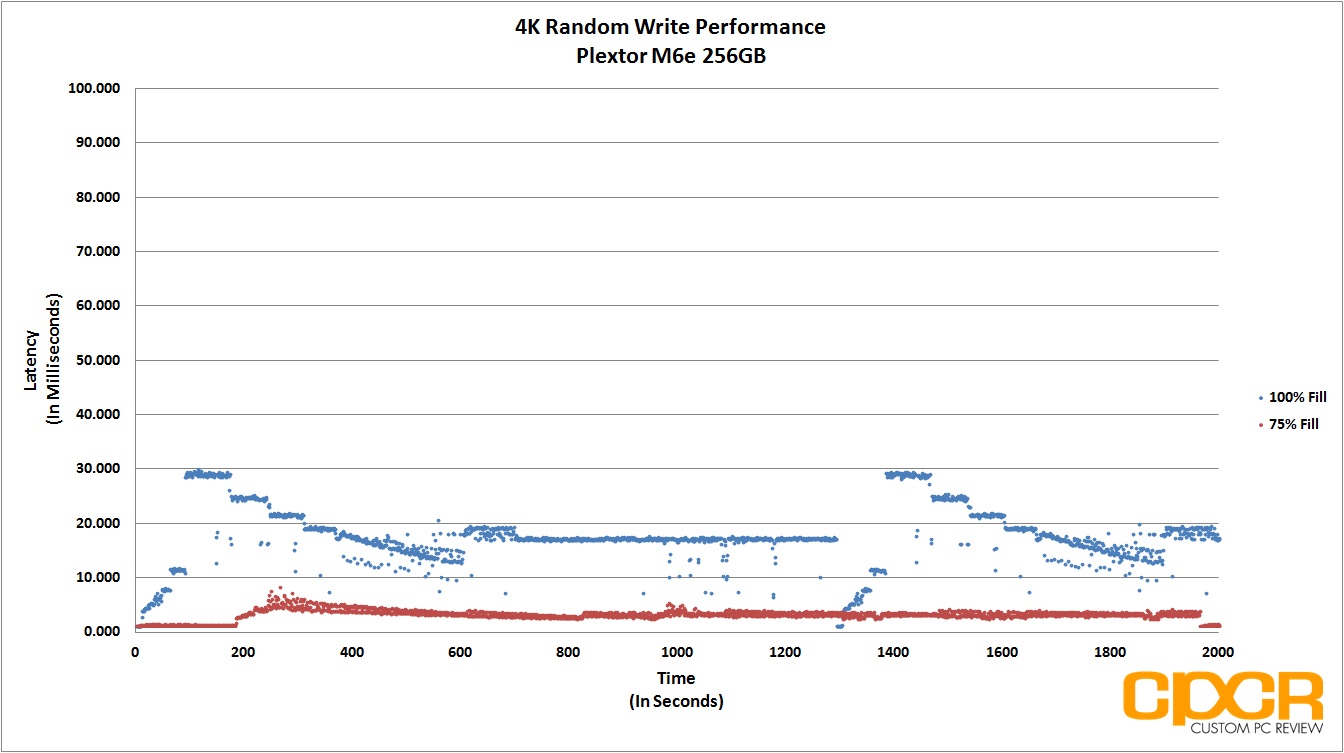
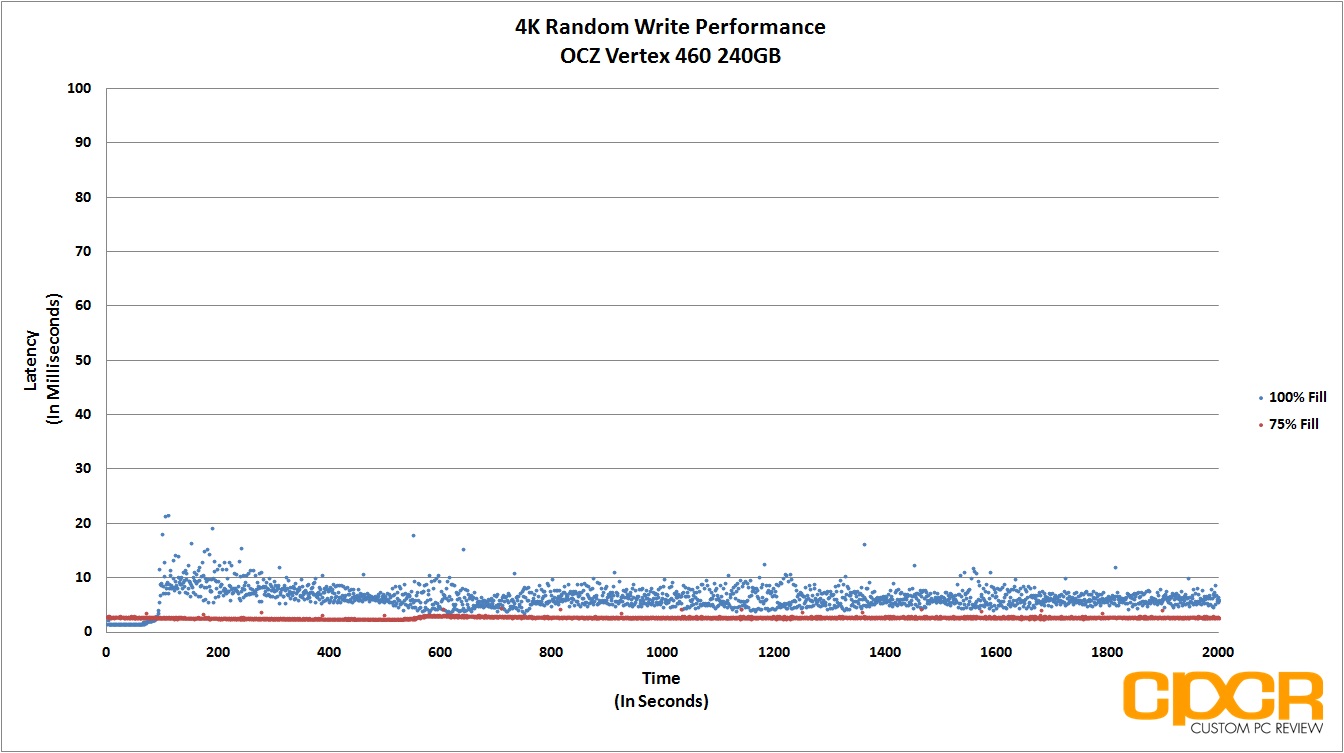

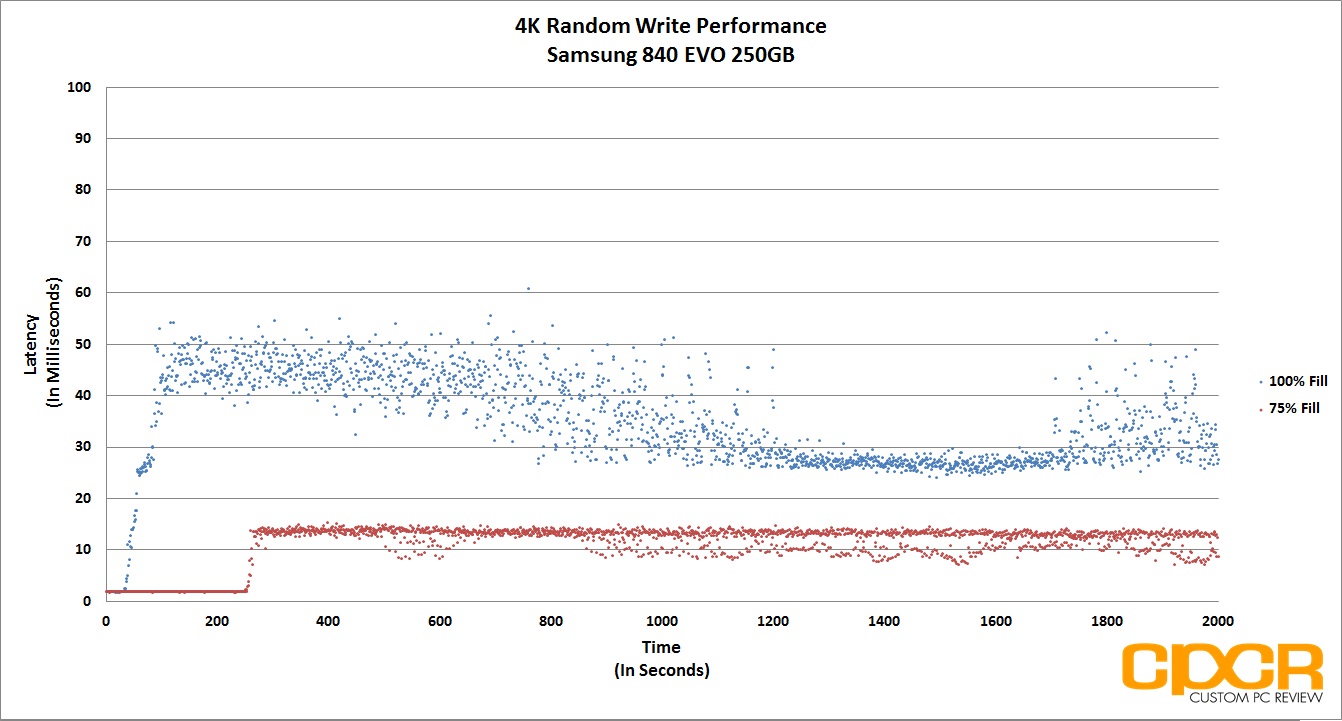
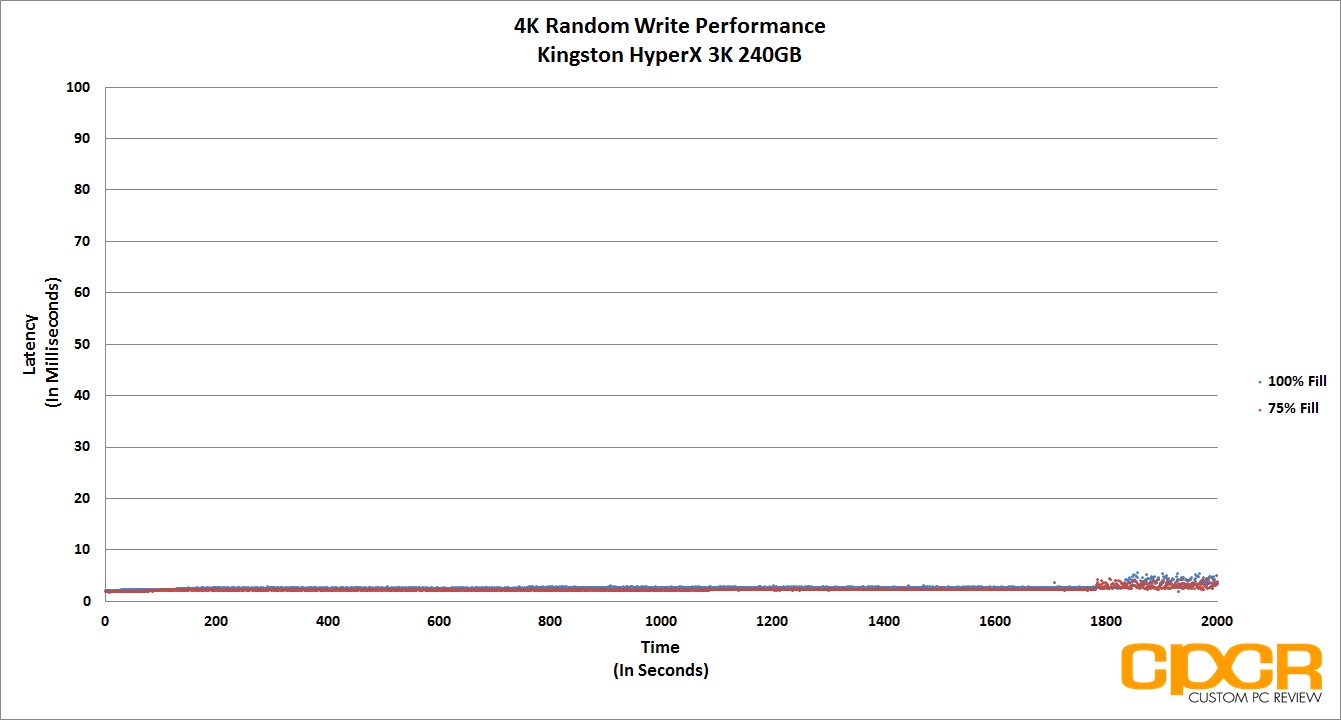
Performance Analysis
Latency for the Patriot Ignite doesn’t paint a pretty picture as well. Latencies were consistently higher than our preferred 50ms threshold, reaching as high as 90ms after extended workloads.
[section label=”10. FIO – 128K Random Write”]
Patriot Ignite 480GB Performance
FIO 128K Random Write Consistency Testing
In addition to testing 4K random write consistency, we’ll also test for 128K random write consistency to see how well a SSD is able to hold itself to a level of performance when getting hammered with larger file transfers.
Testing methodology is very similar to our testing for 4K random write consistency. We use a fairly standard method, which includes both filling up 75% of capacity as well as 100% capacity twice with sequential 128k data followed by the actual test itself, which is running 128K random writes at a queue depth of 32. By recording the IOPS every second for 2,000 seconds, we’re able to get a good look at what kind of performance can be expected when the drive is relatively new, when it’s heading towards steady state, and when it’s actually in steady state.
[tabgroup]
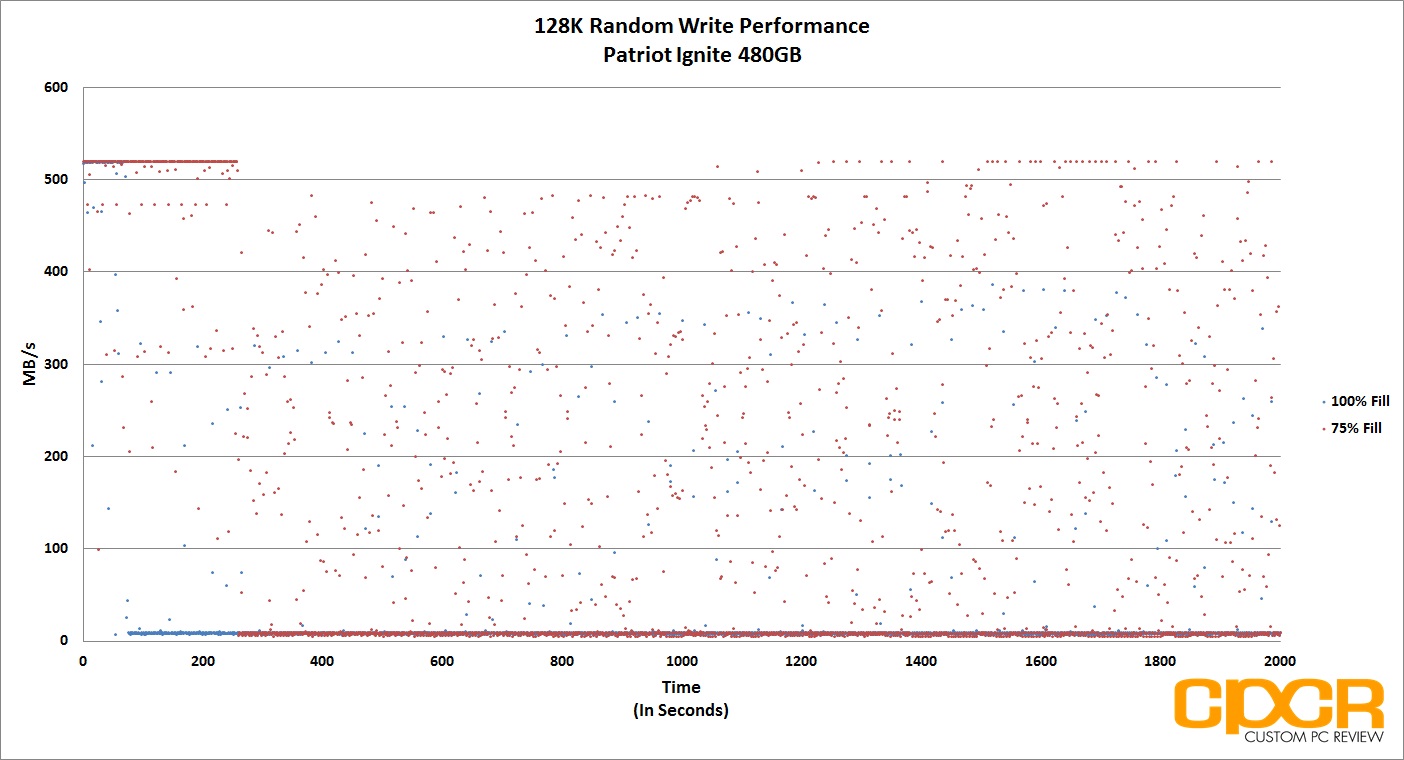
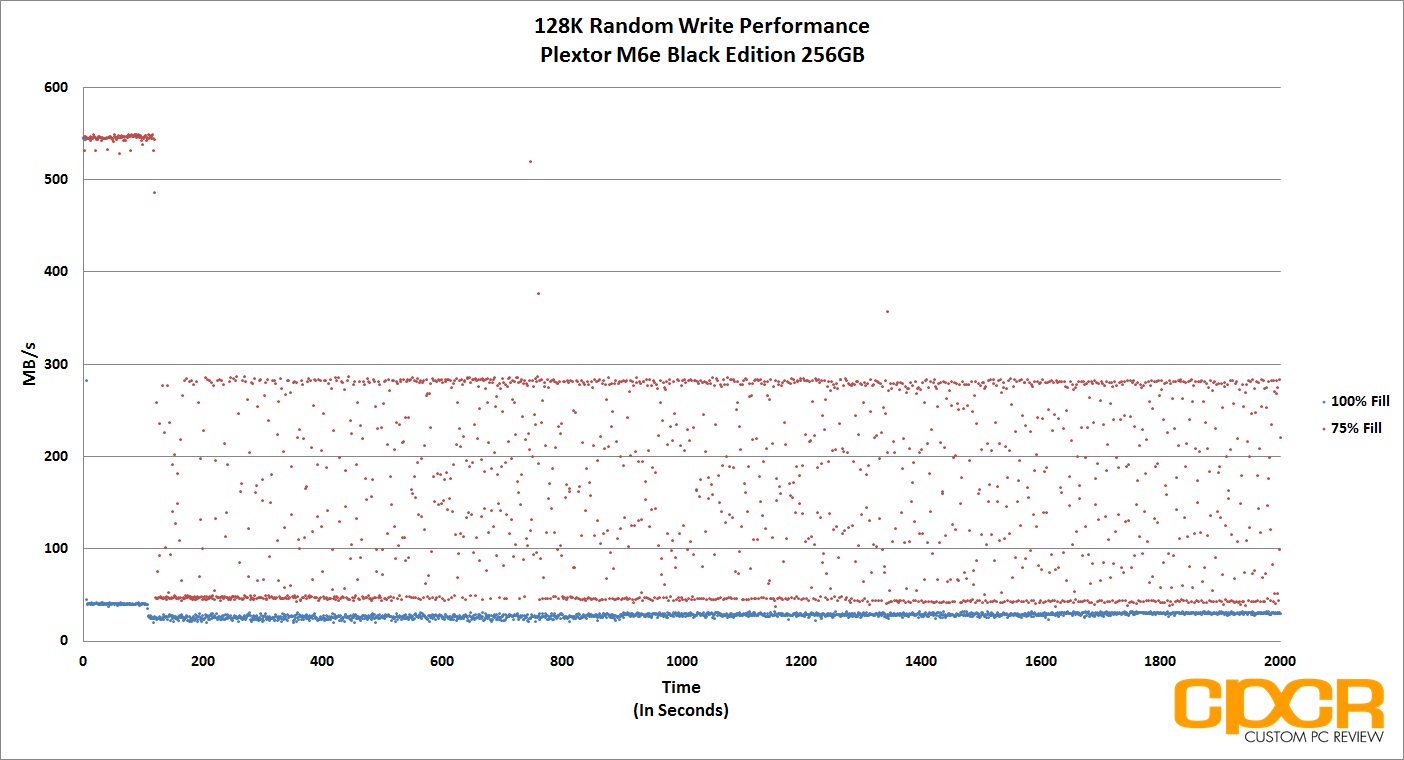
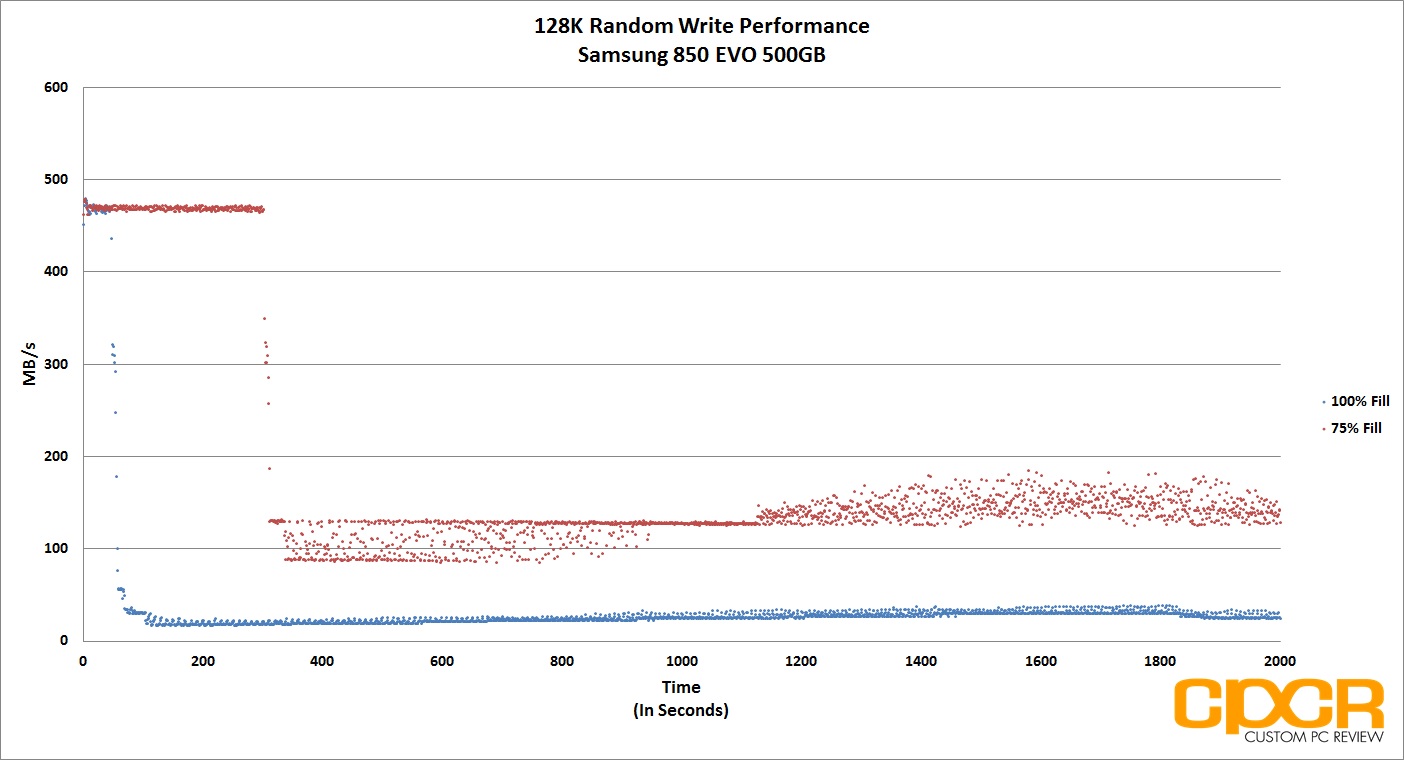
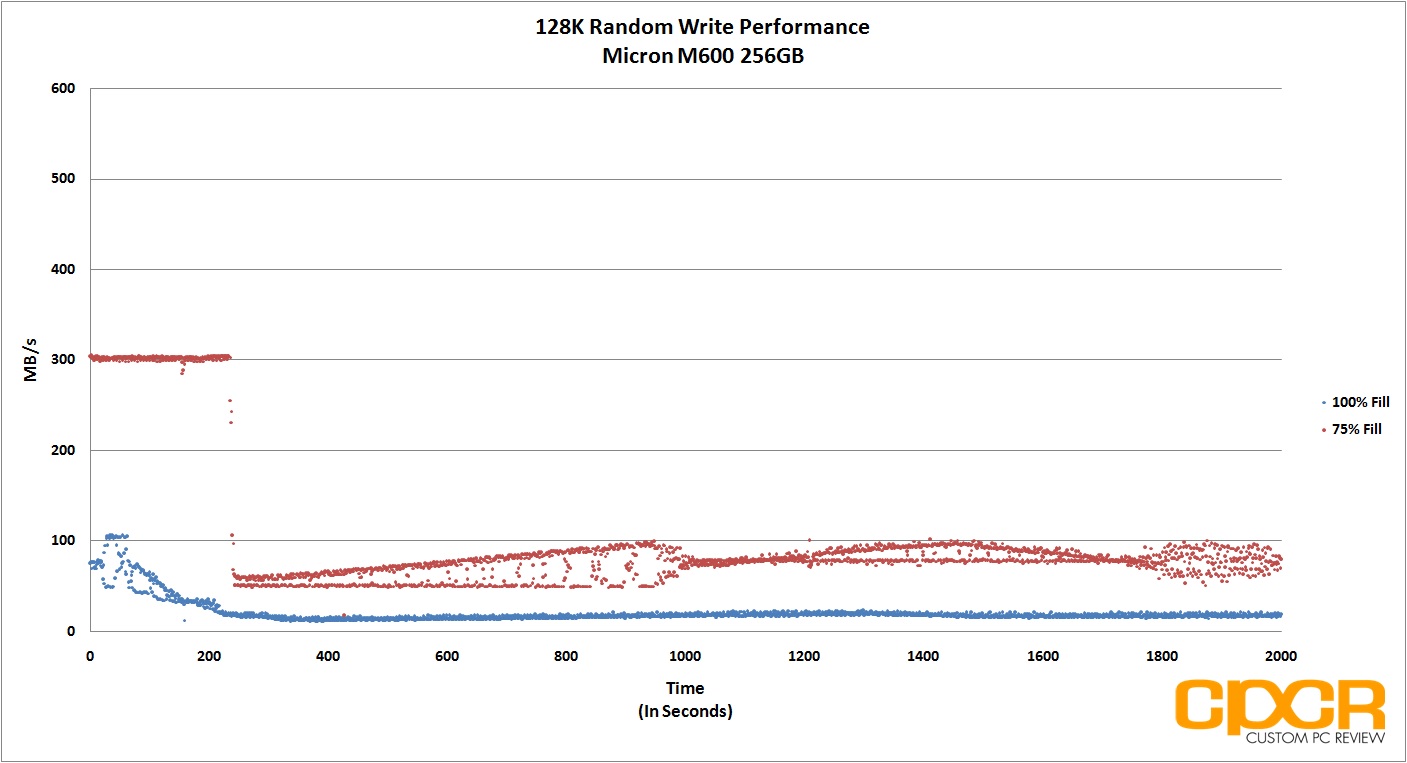
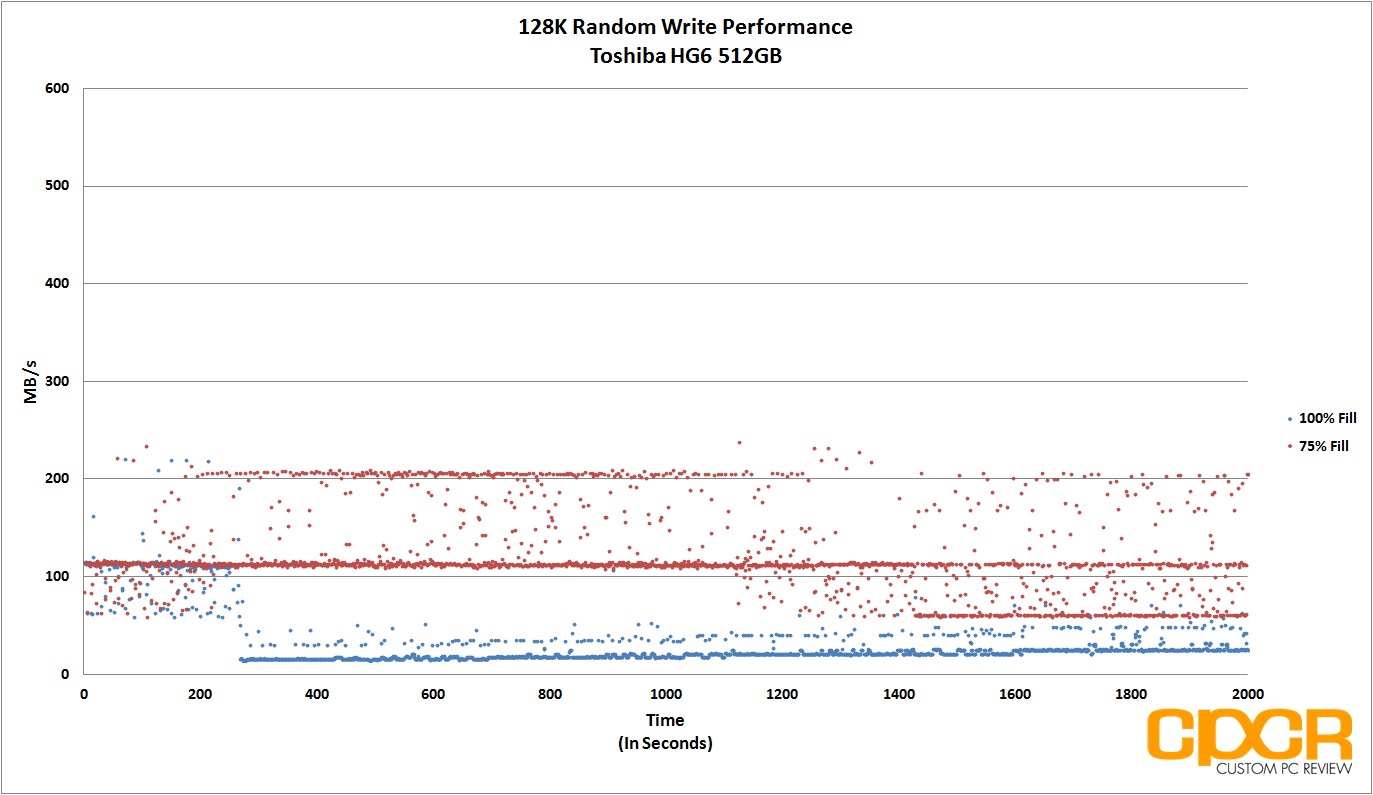
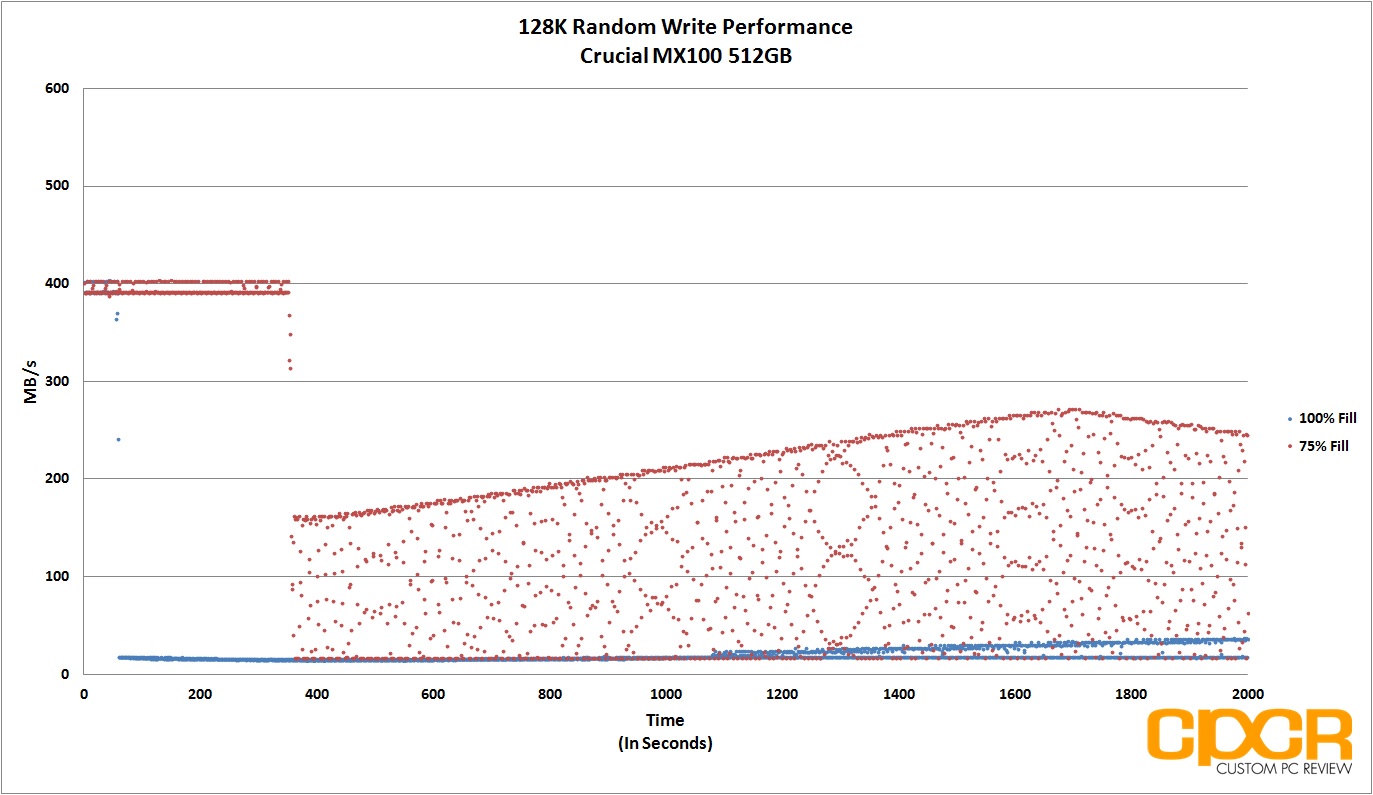
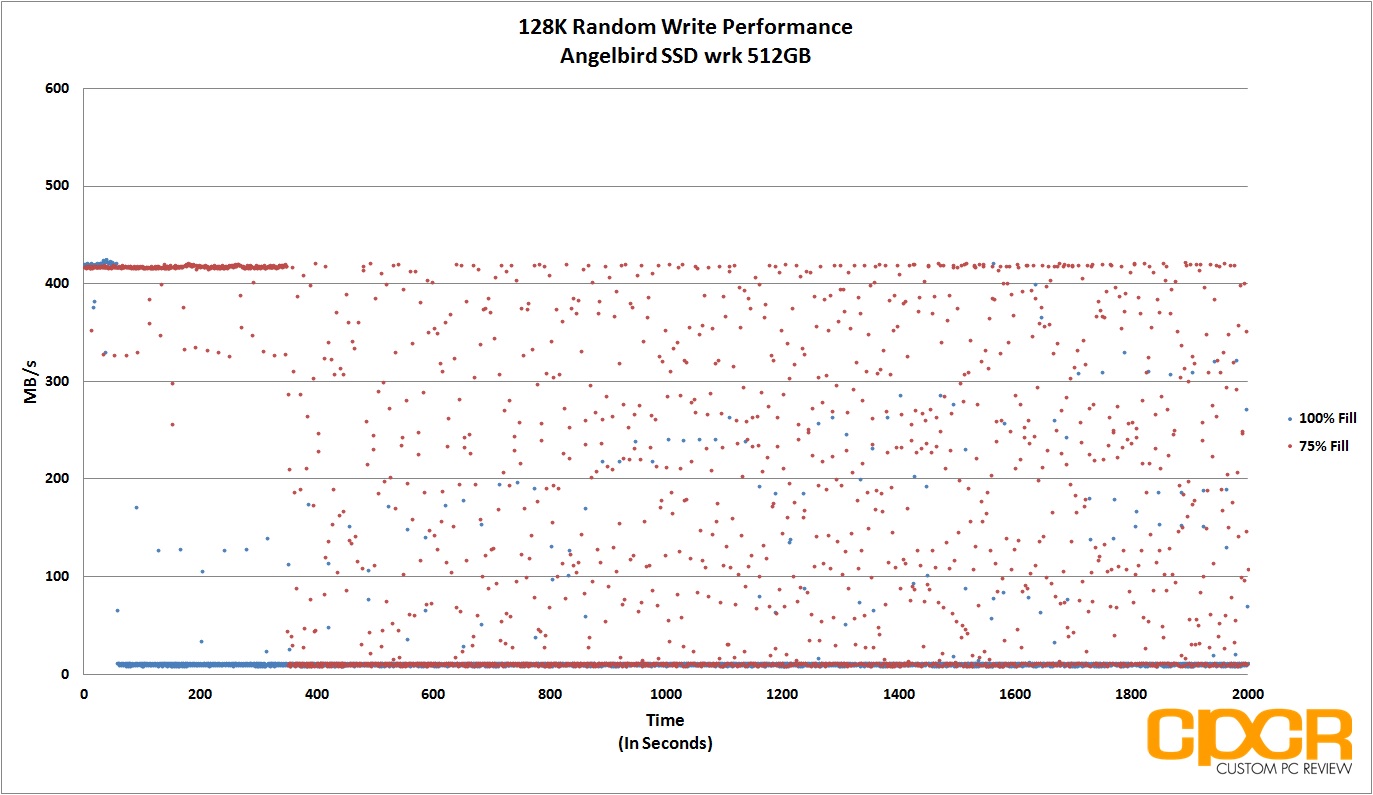

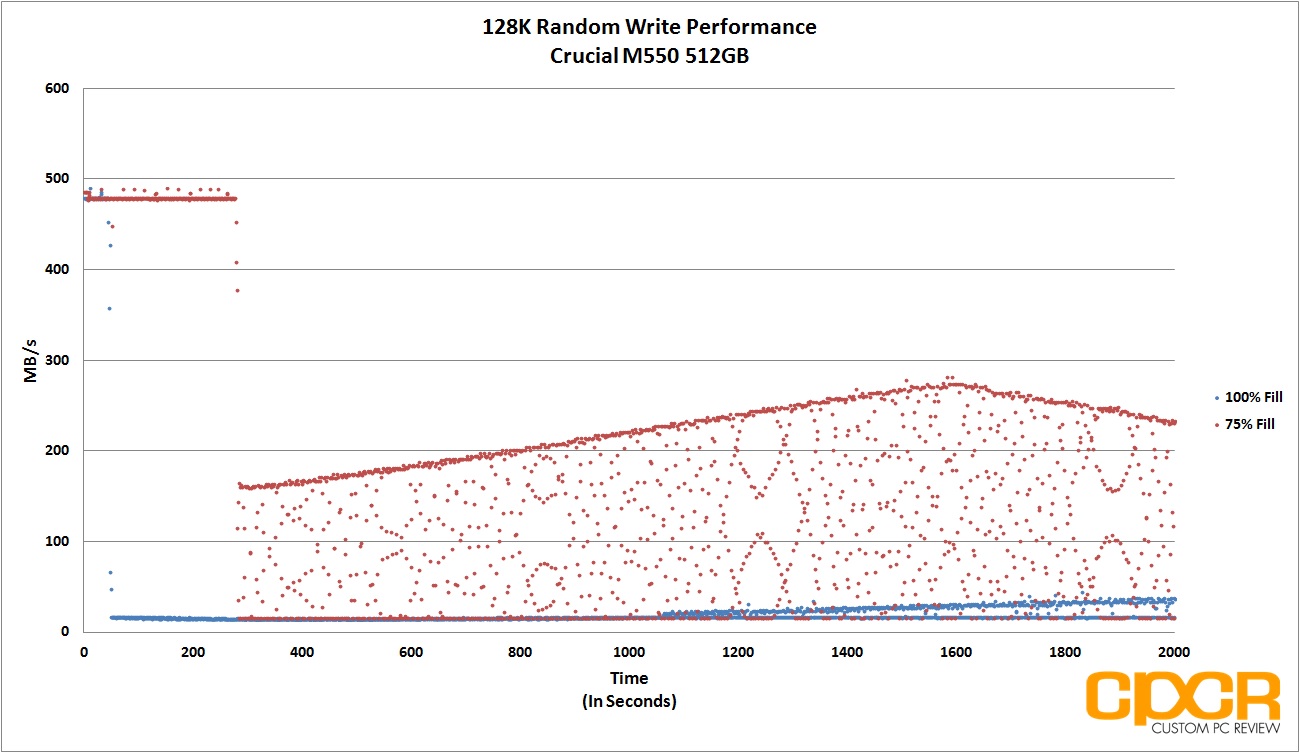
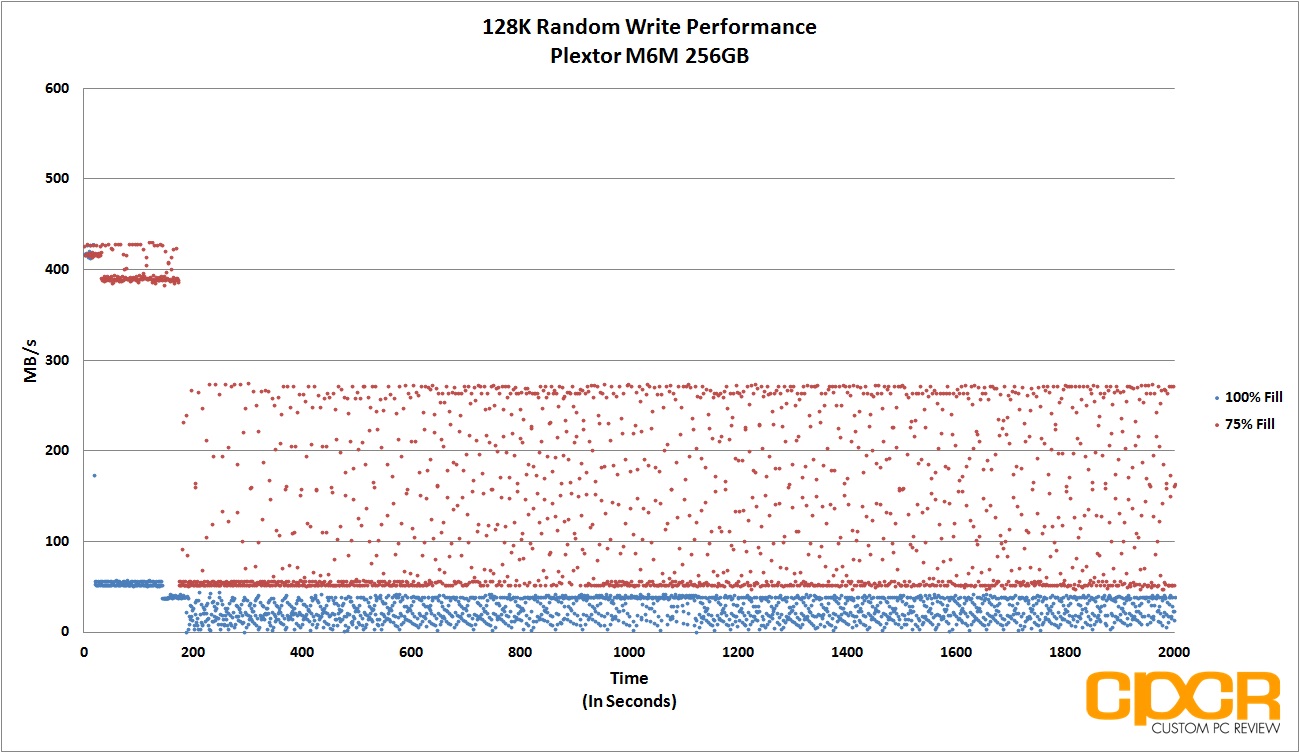
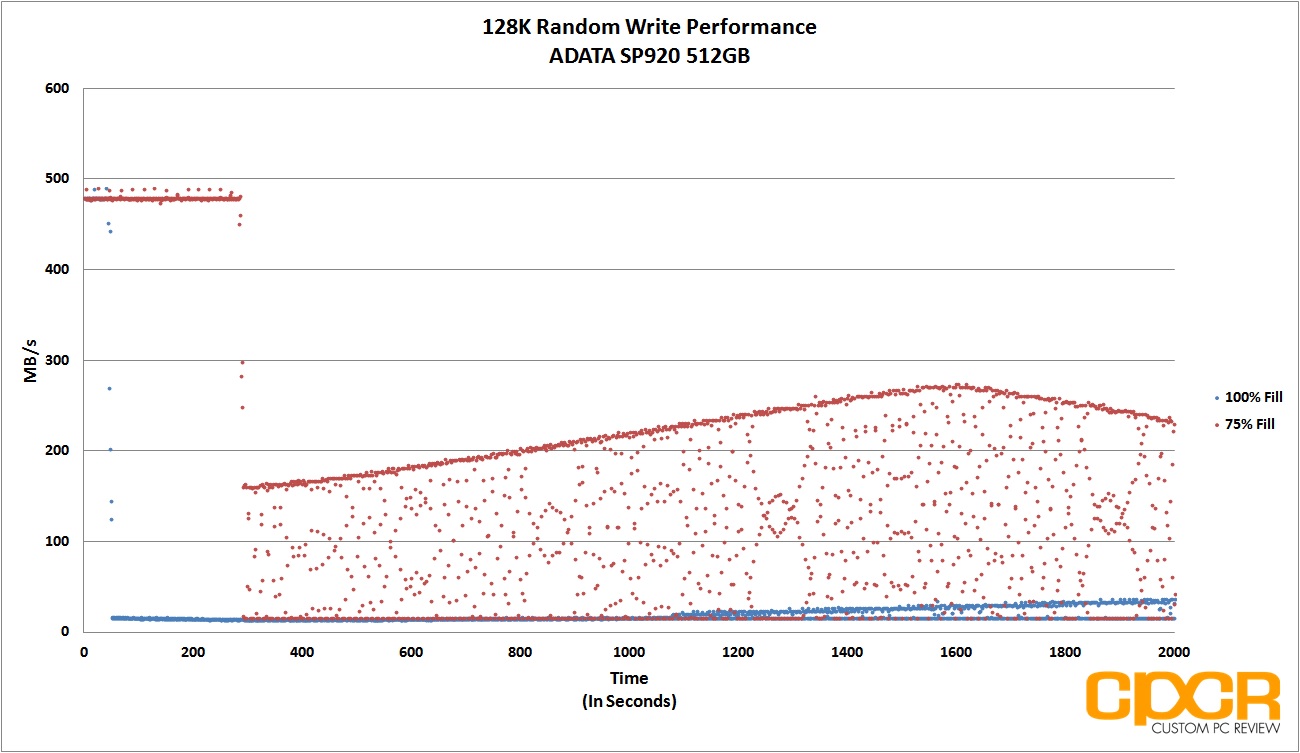
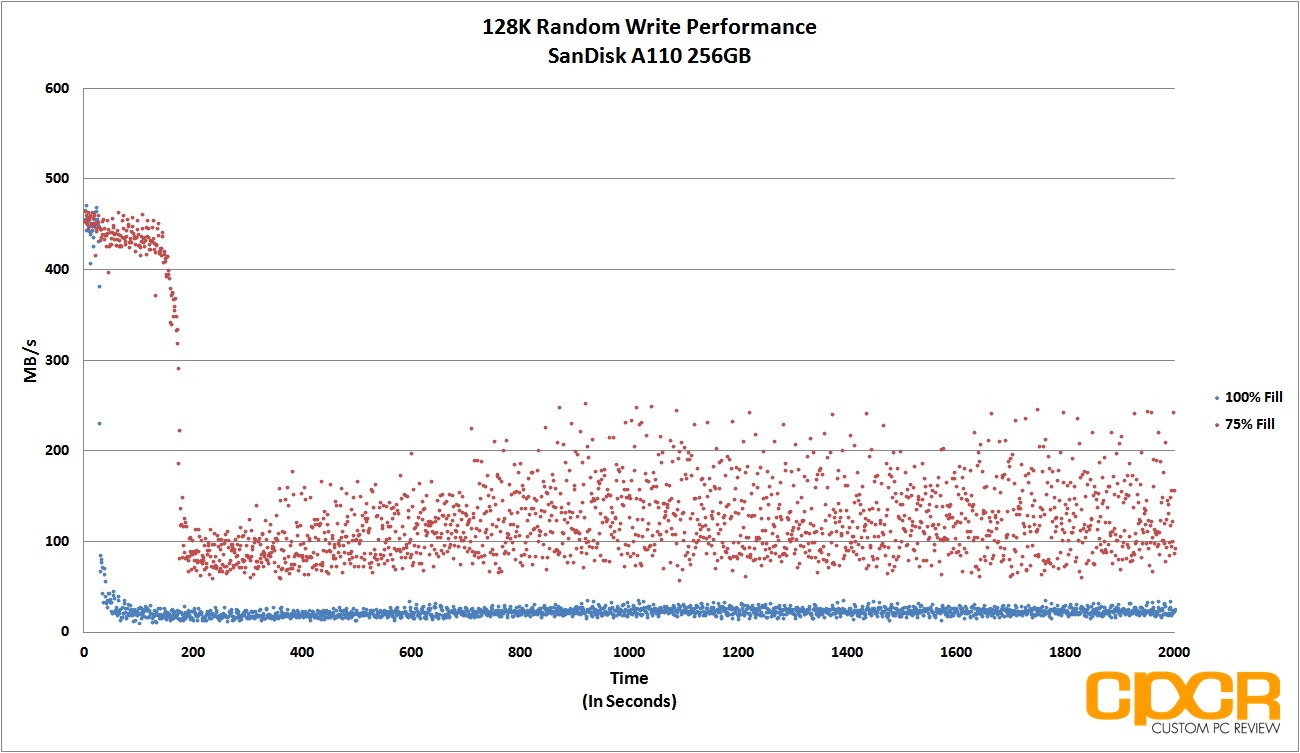
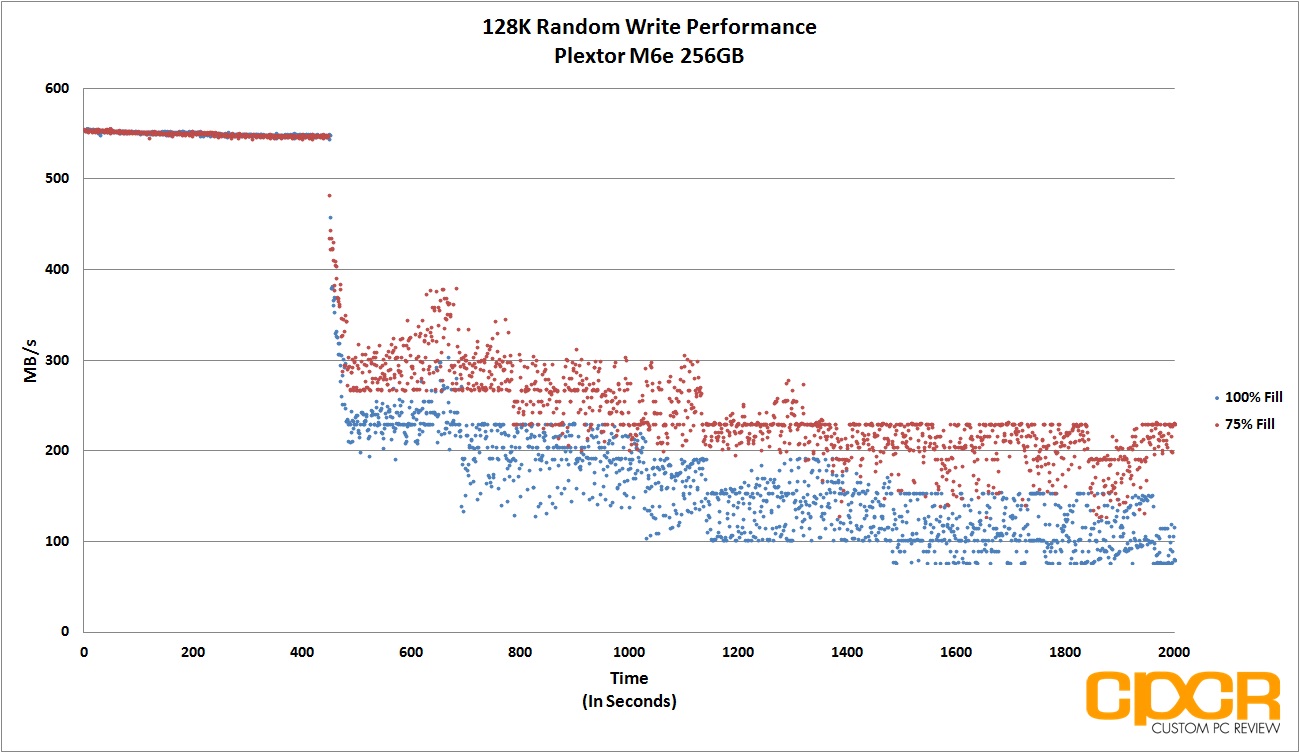
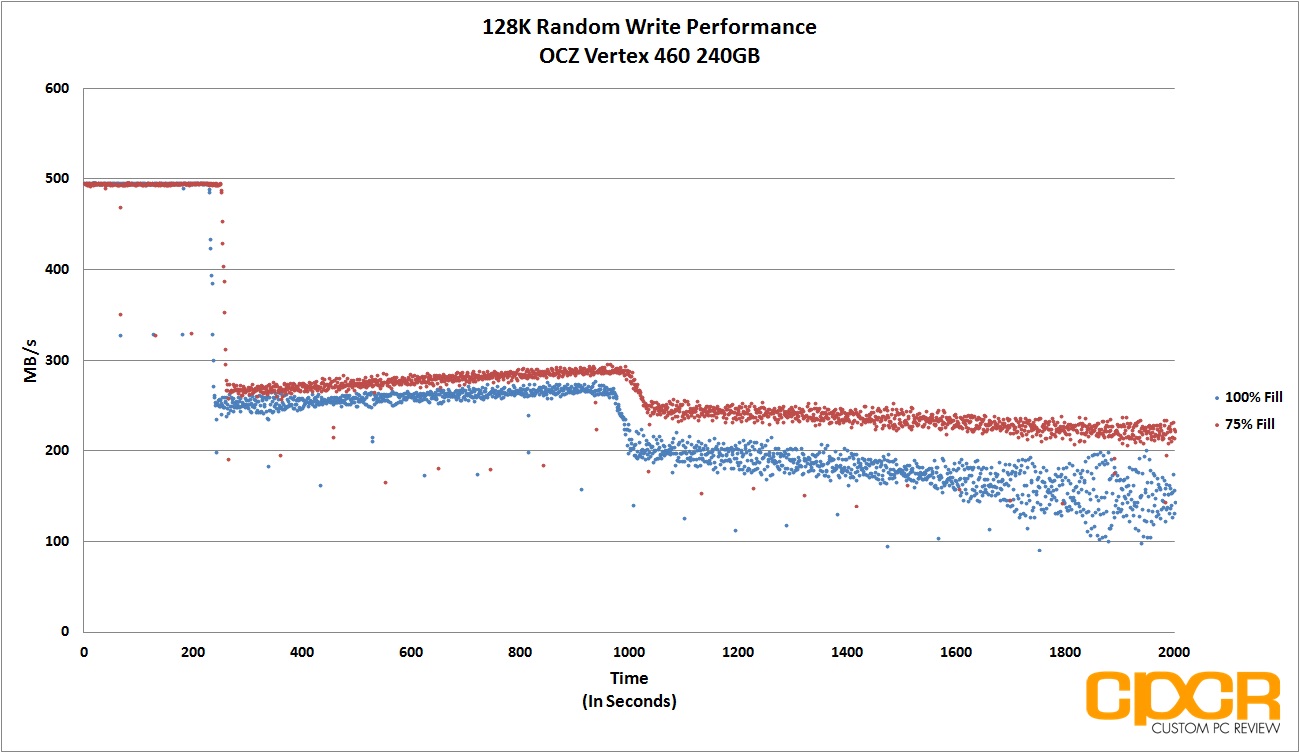
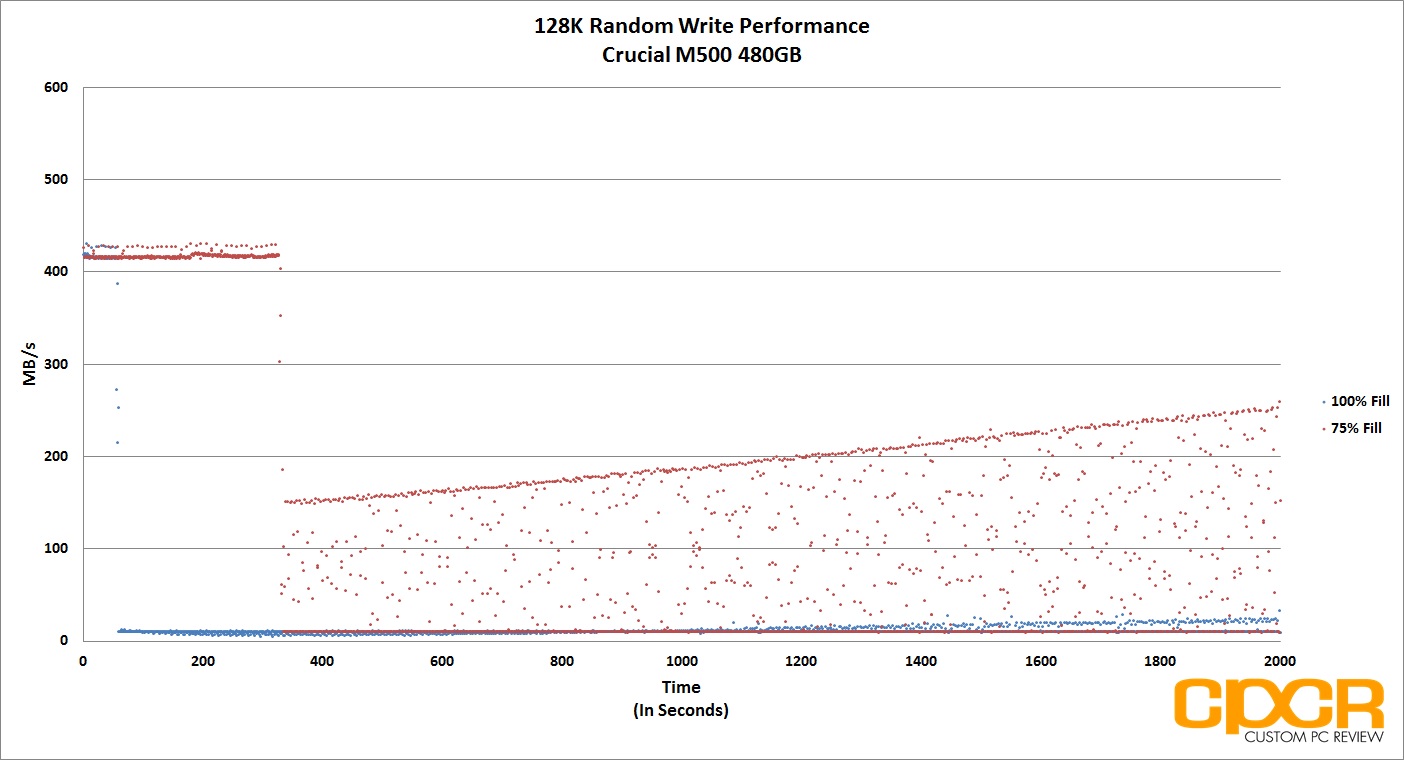
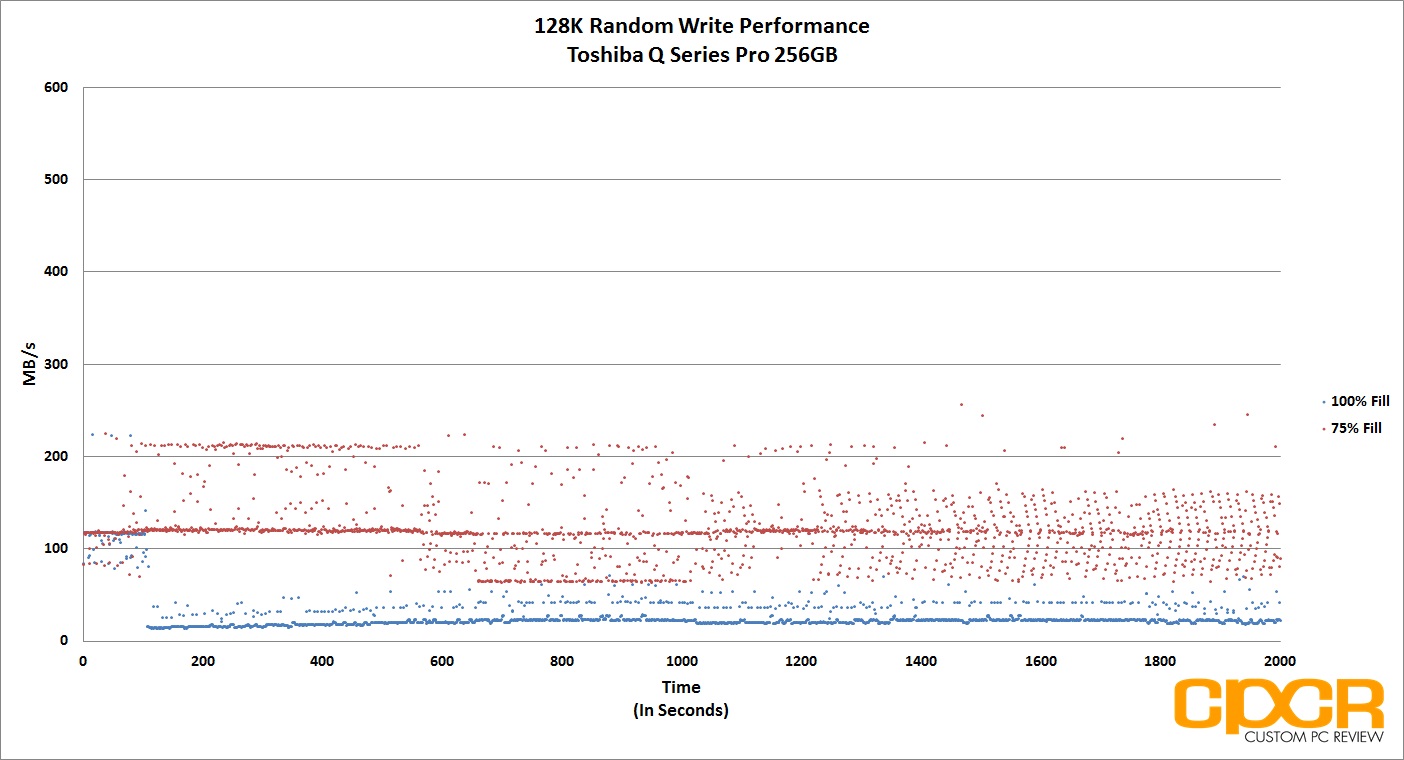
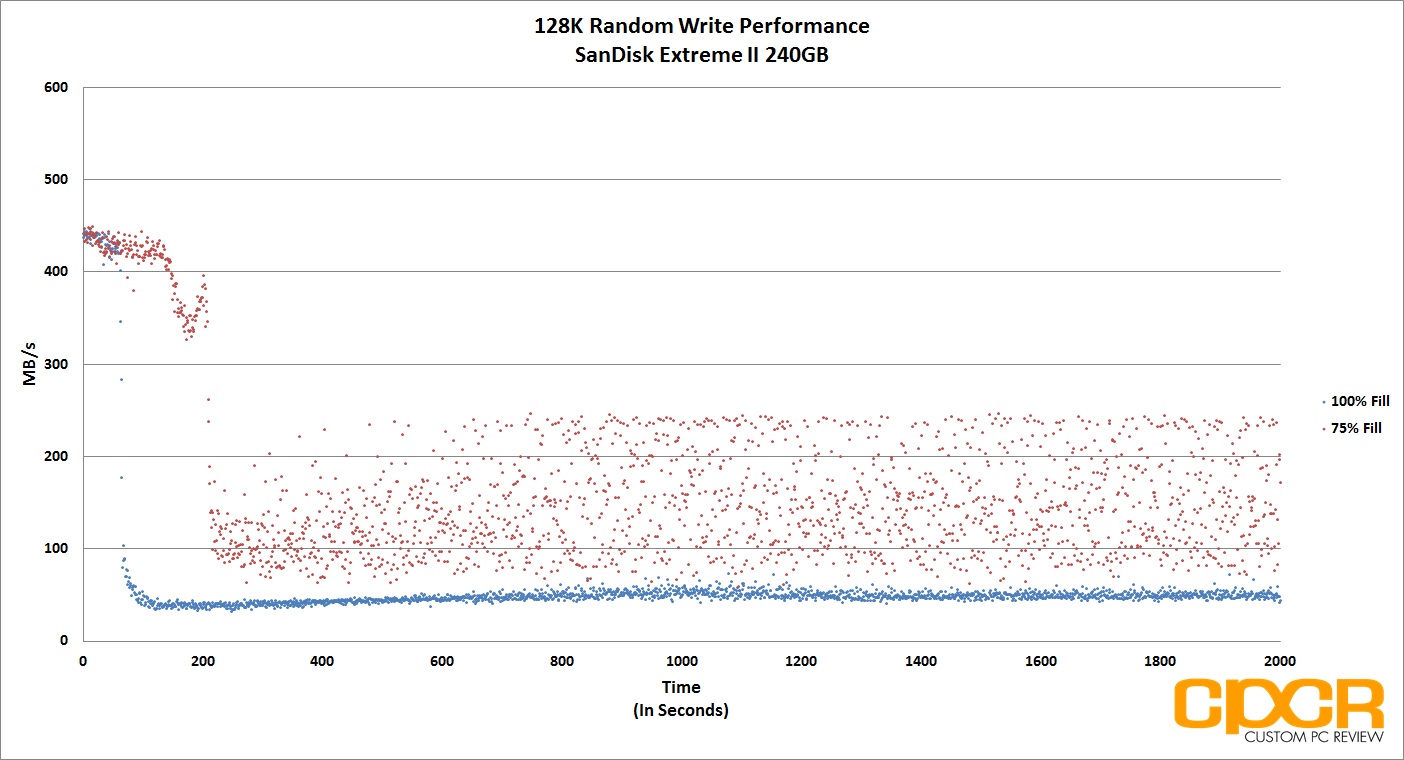
Performance Analysis
Like 4K random writes, 128K random write consistency isn’t very good either. Write performance varied from as low as 7MB/s to as much as 520MB/s.
[section label=”11. Power Consumption”]
Patriot Ignite 480GB Power Consumption
Previously, our power consumption analysis only tested for idle and maximum load power consumption, but we felt that this was a bad way to accurately measure power consumption. The reason for this is because SSDs tend to be bursty while in operation and will spike in power usage, but only for very short periods of time. As such, many of our SSDs appeared to have even higher power consumption than traditional hard drives, which is untrue.
In order to better represent a drive’s power consumption, our solution was to run a test closer to the real-world and record a trace of the exact power consumption during testing. Since PC Mark 7 has been recognized by the industry as a fantastic real-world benchmark, we’ll be recording the drive’s power consumption while running the benchmark.
All tests below are measured by our B&K Precision 5491B Bench Multimeter tapped directly into the 5v line running from the power supply to the drive. All testing here is conducted with “HIPM (Host Initiated Power Management)/DIPM (Device Initiated Power Management)” enabled and “AHCI Link Power Management – Adaptive” set to 0 milliseconds for maximum power efficiency.
[tabgroup]
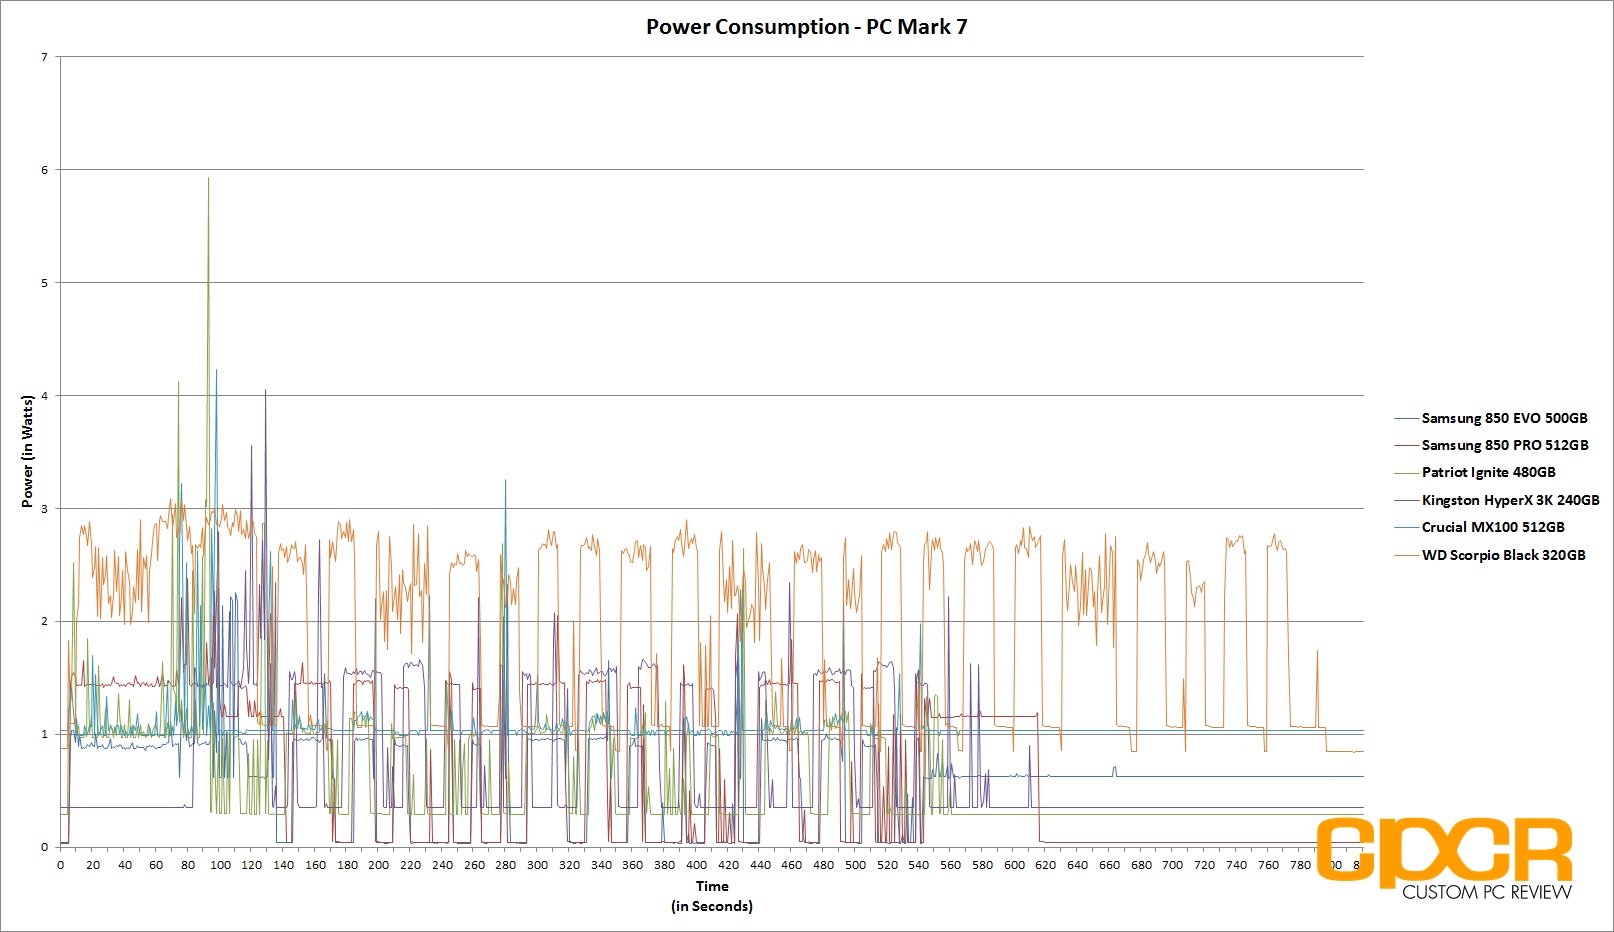
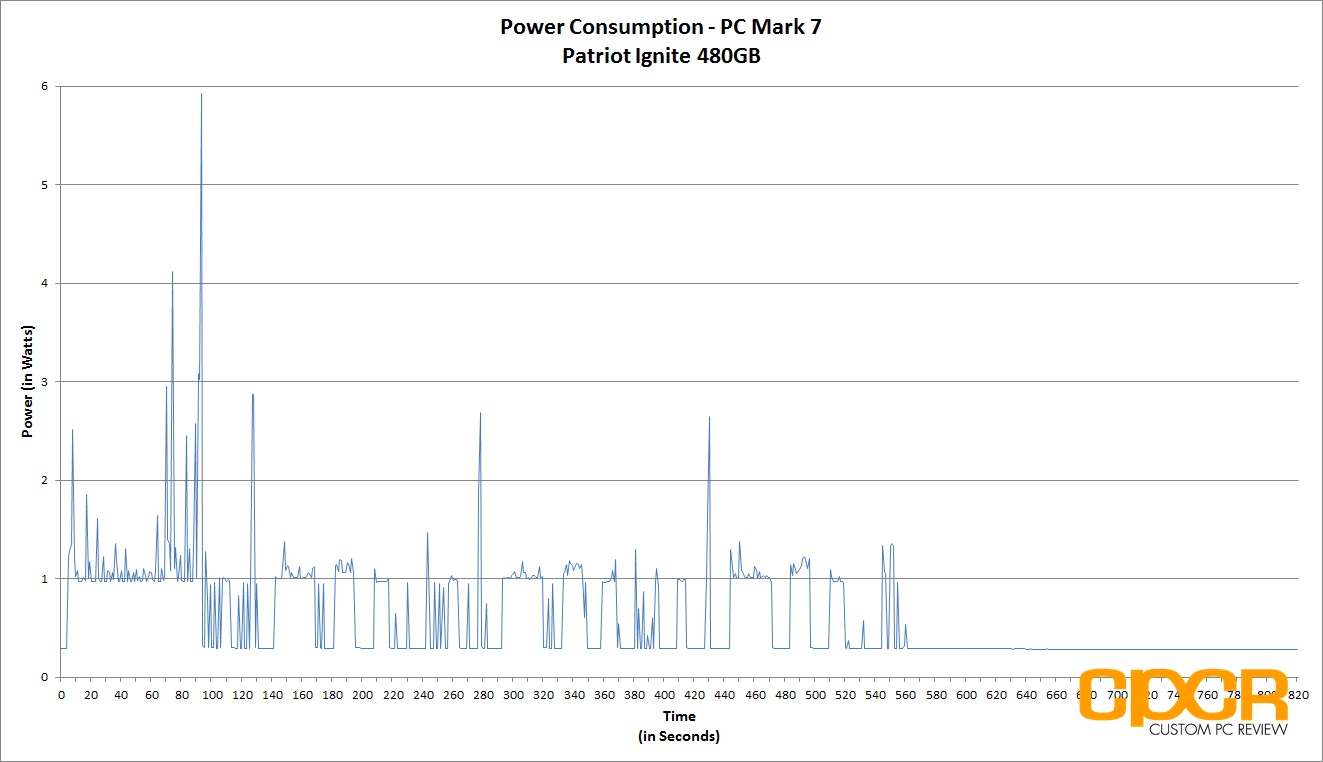
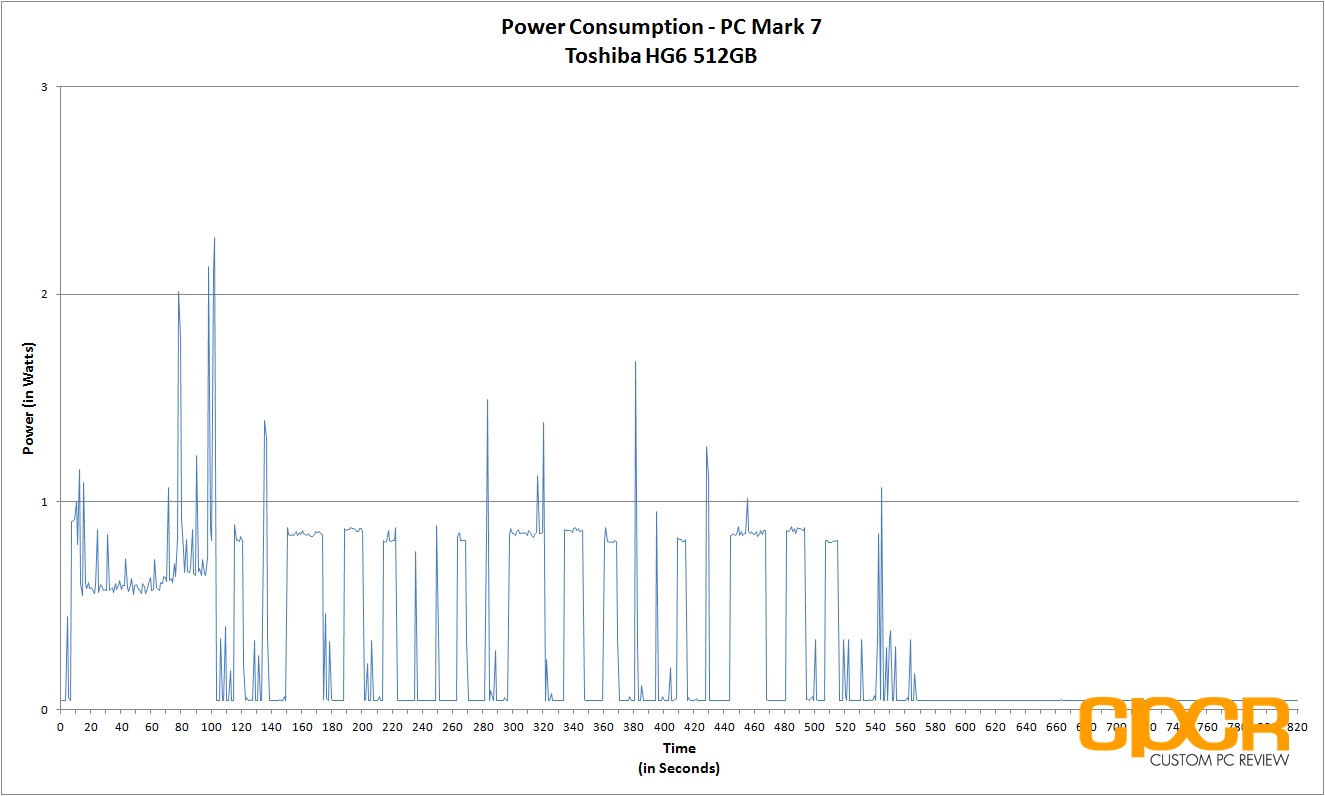

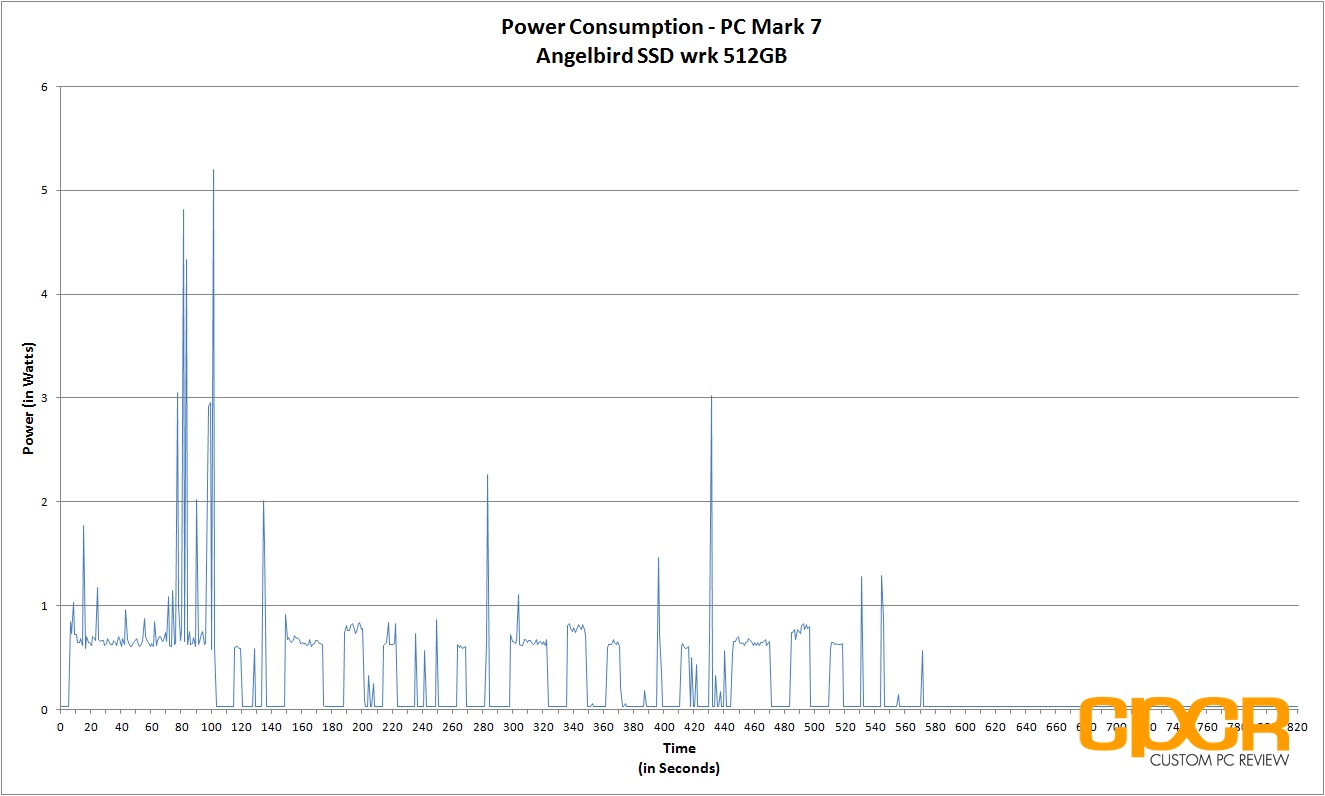
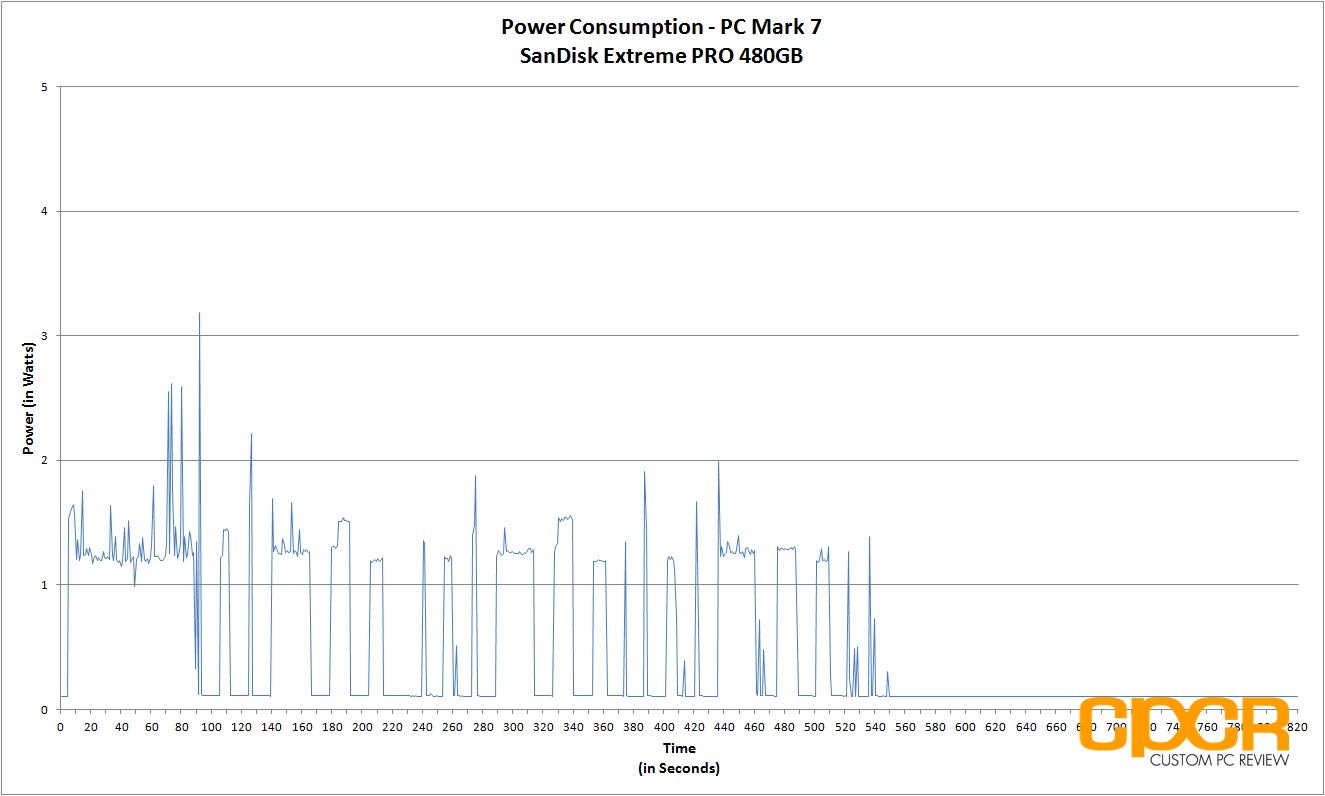
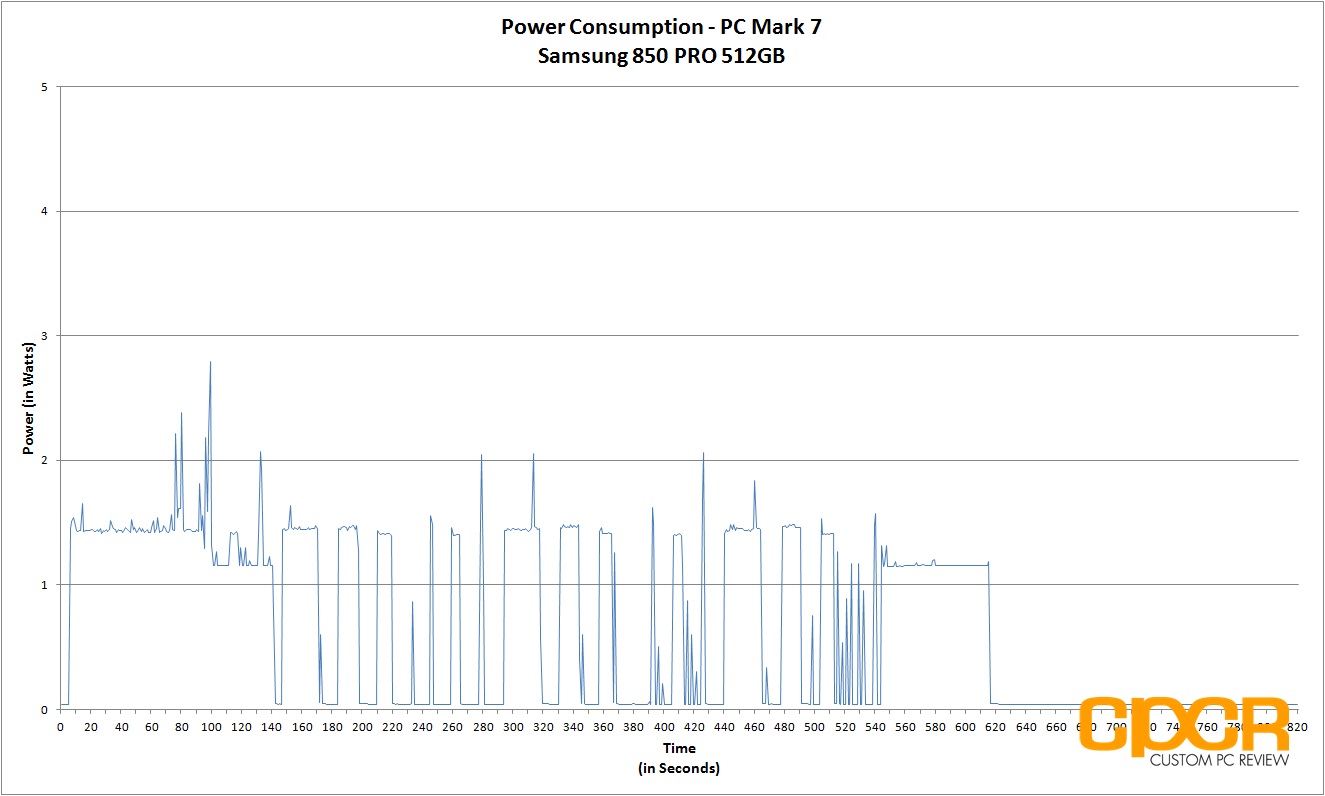
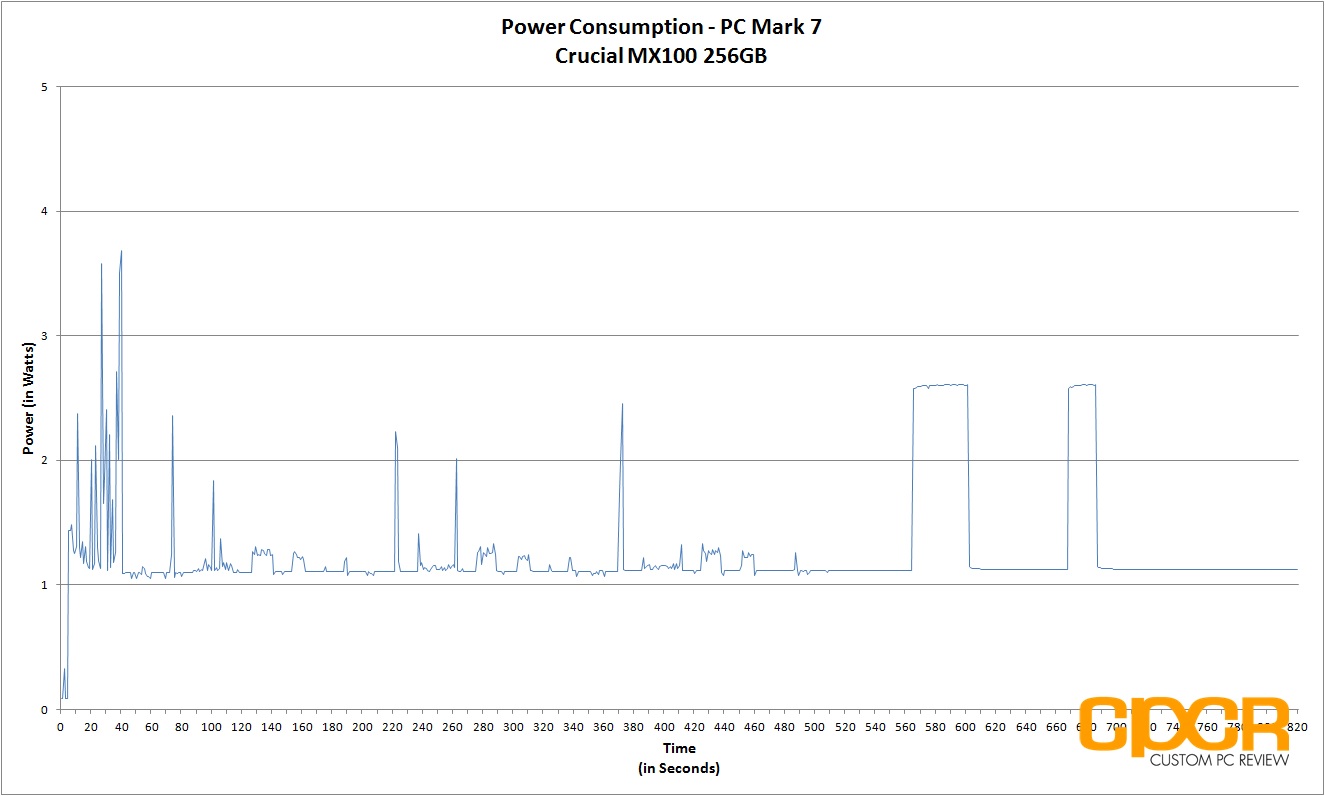
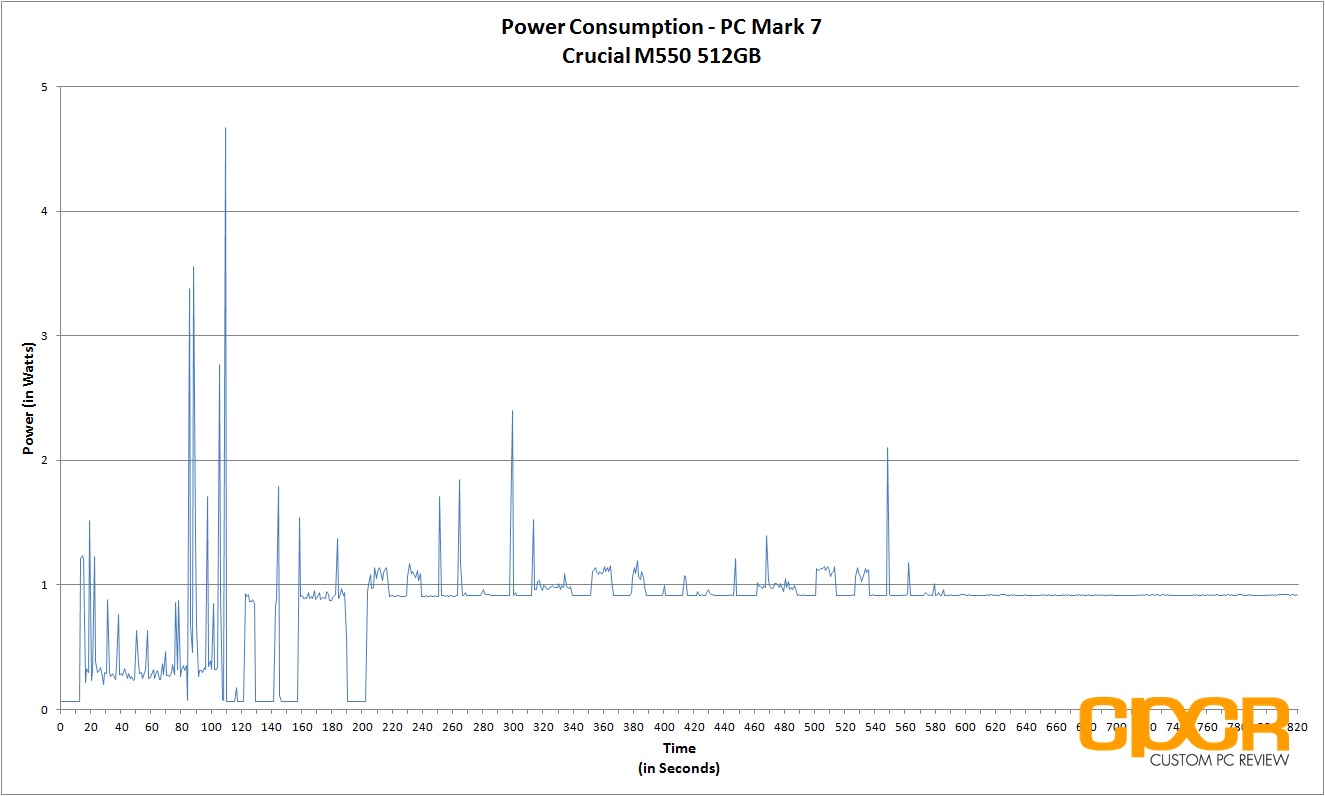
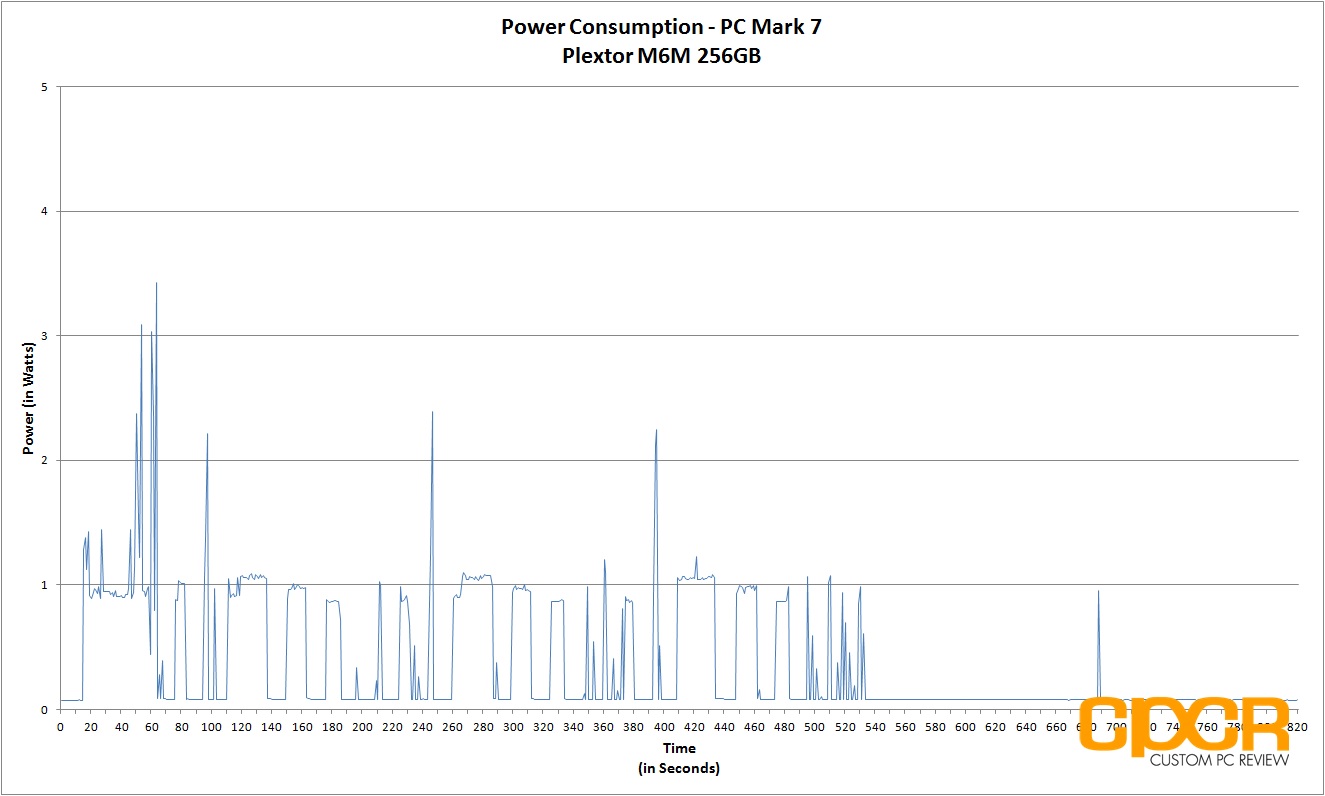
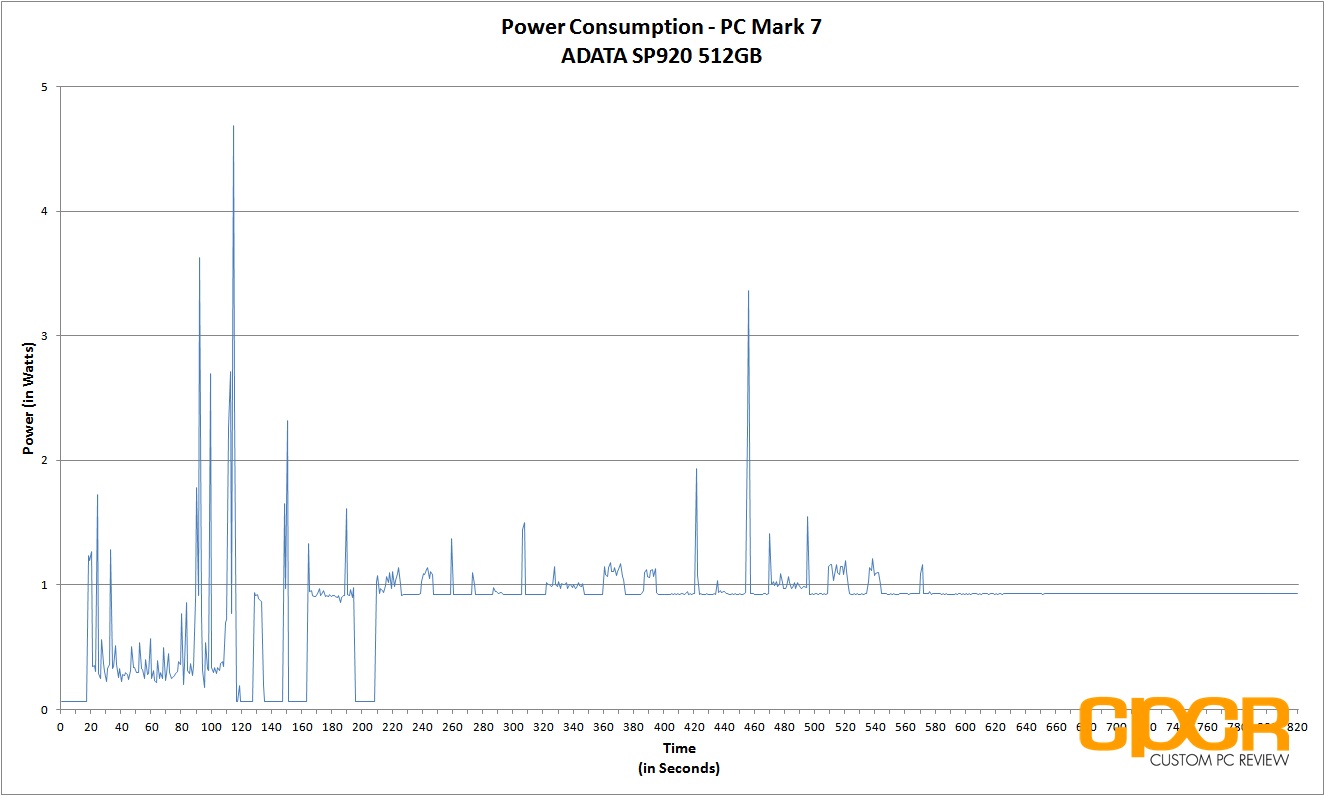
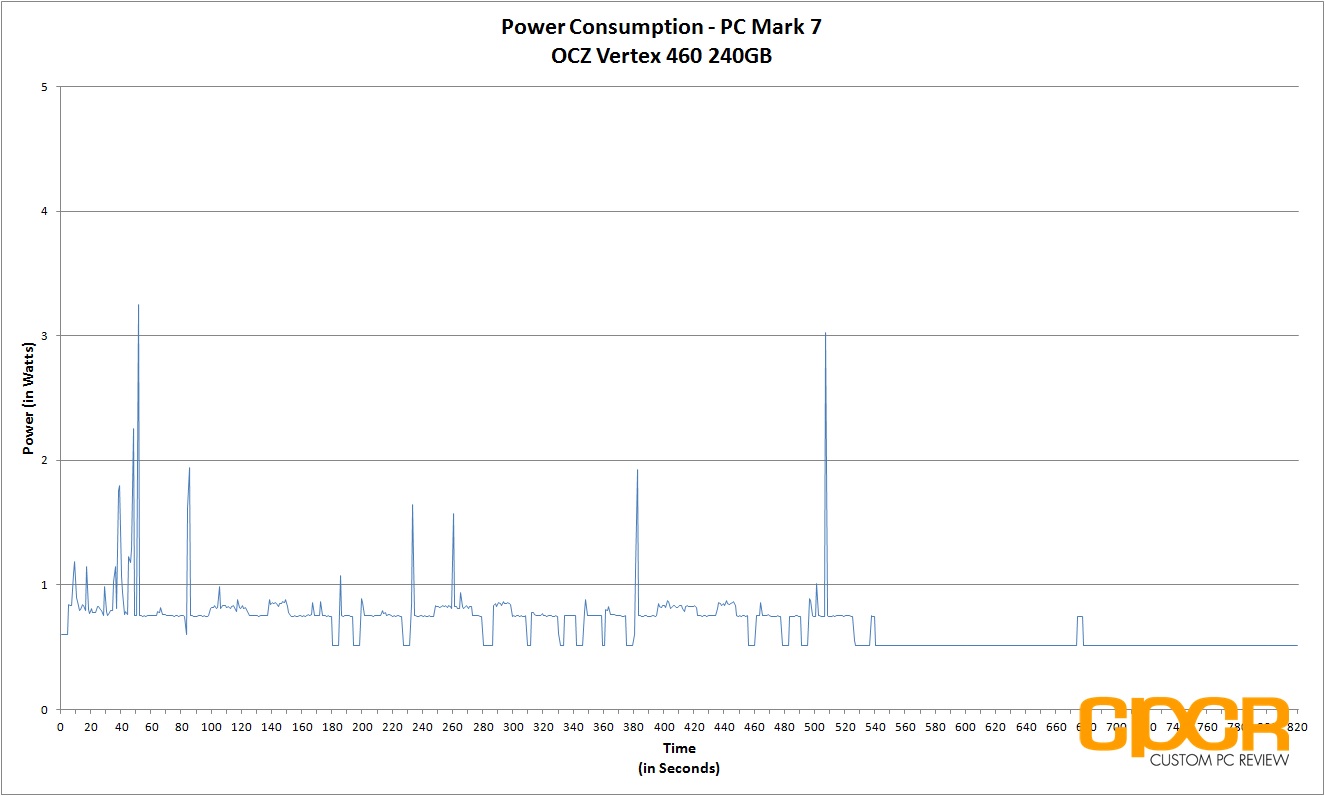
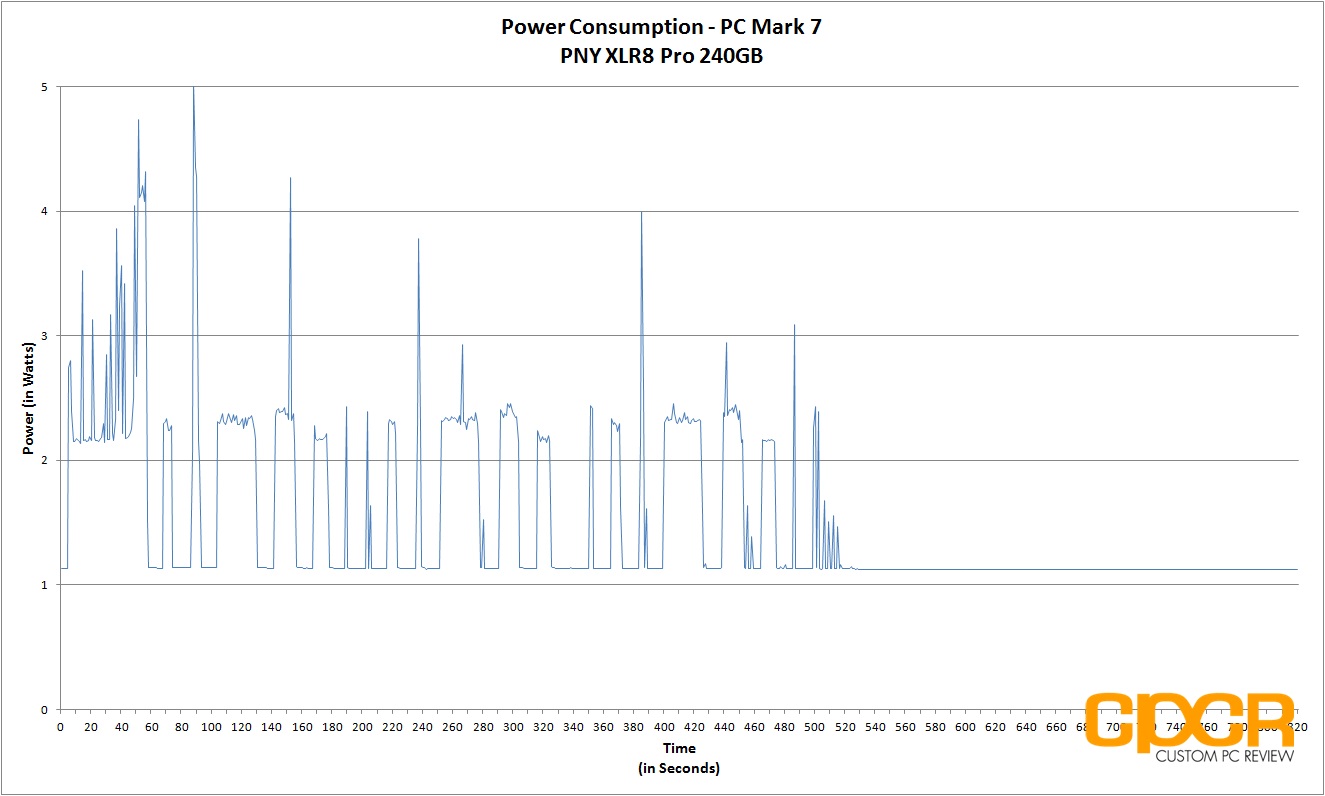
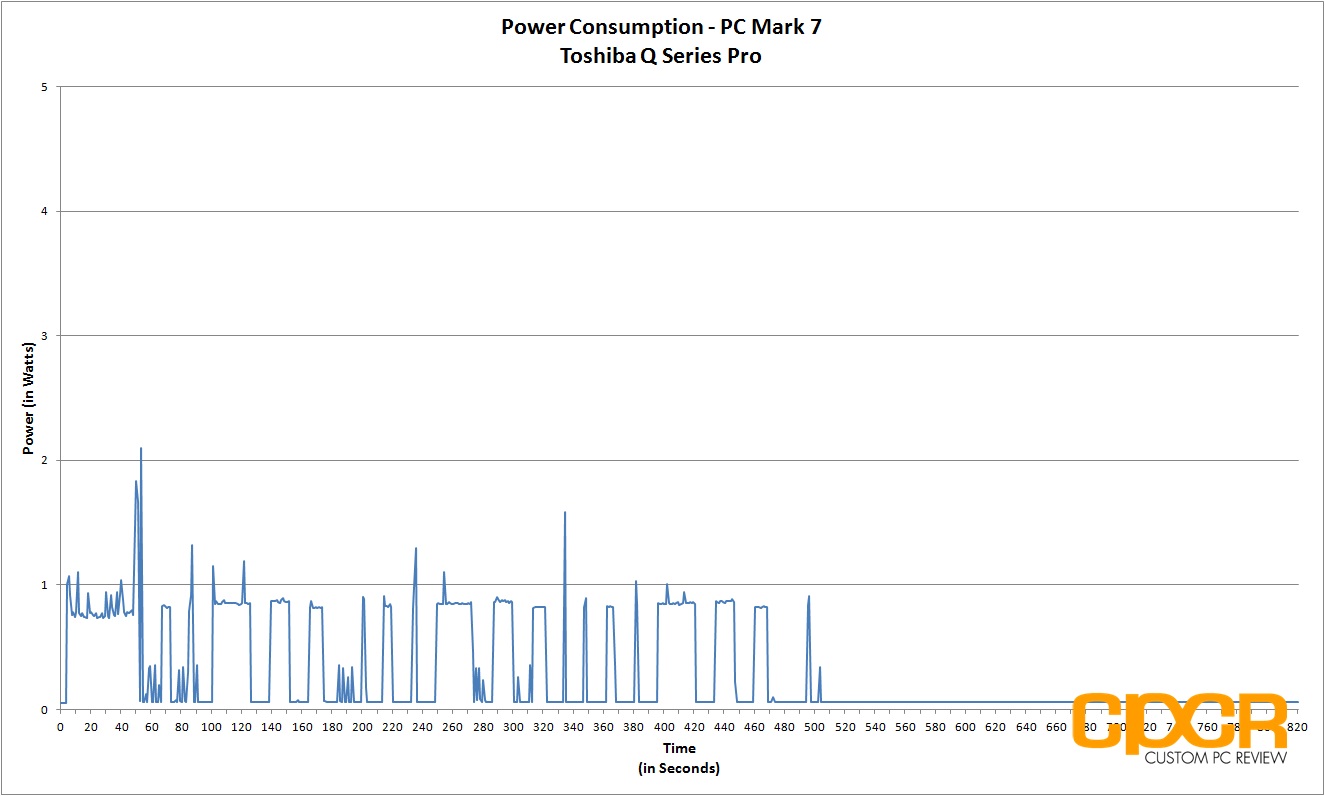
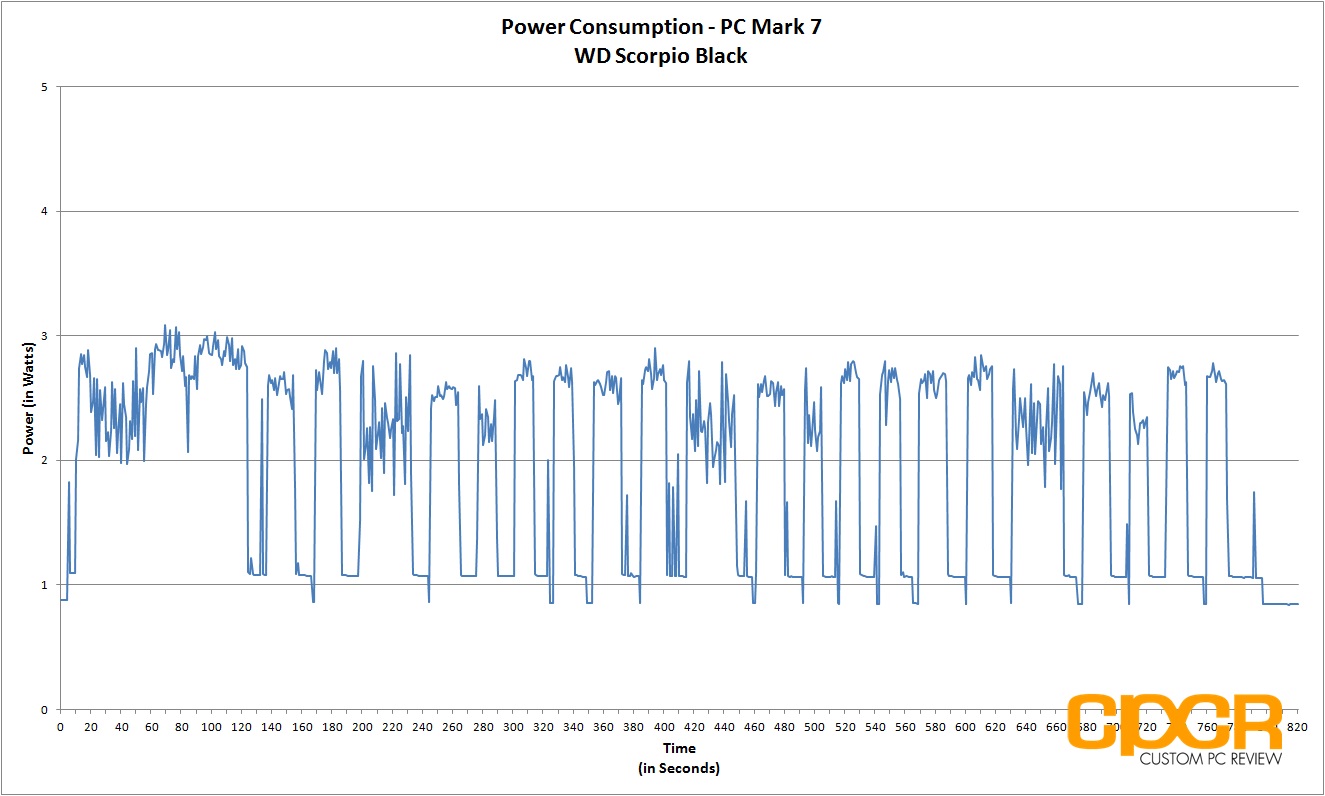
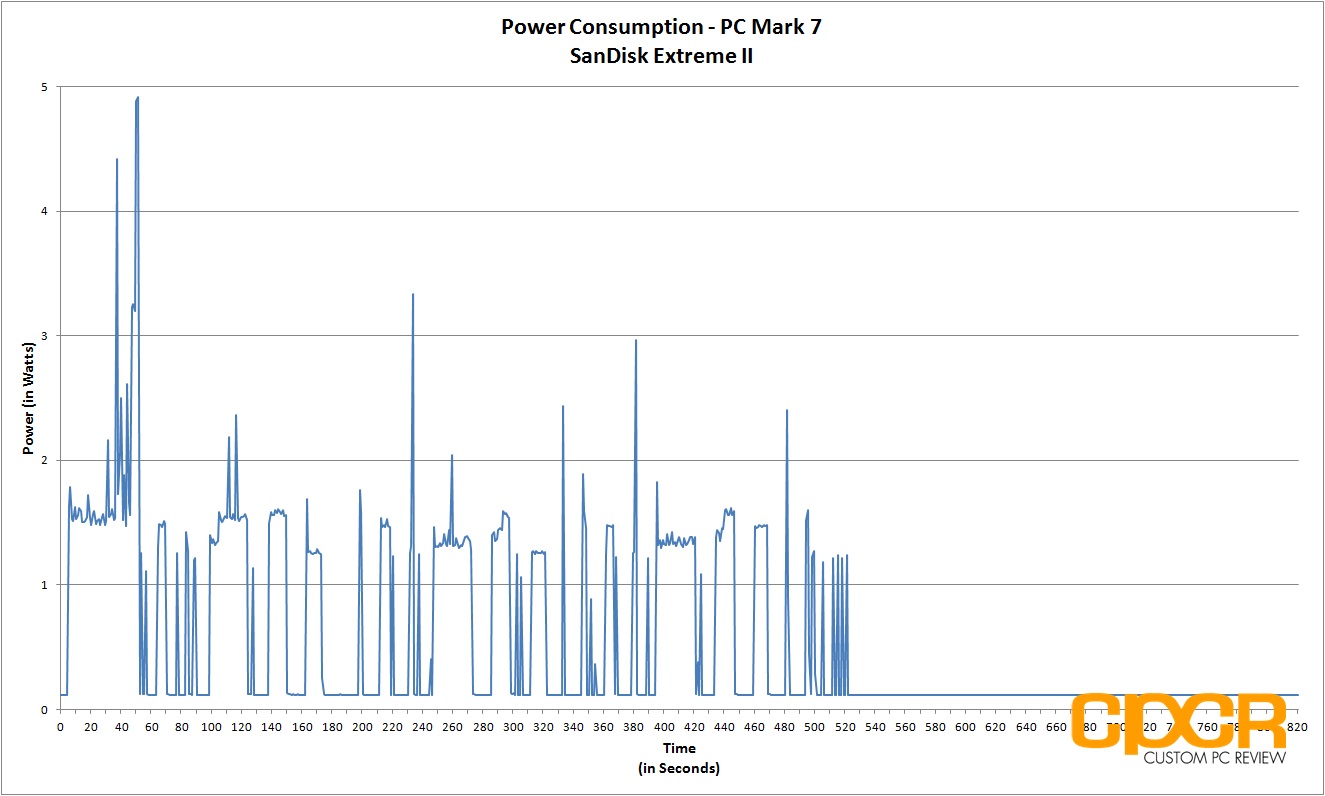
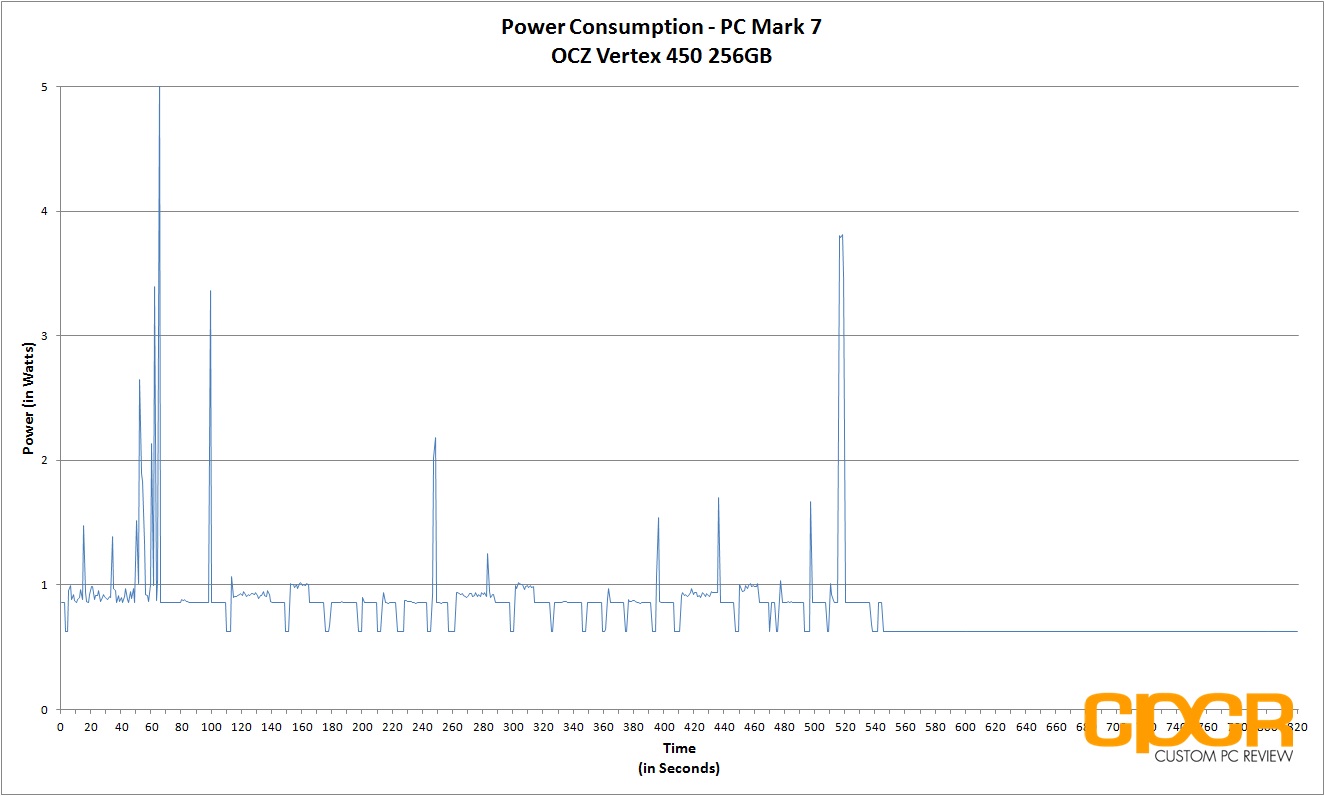
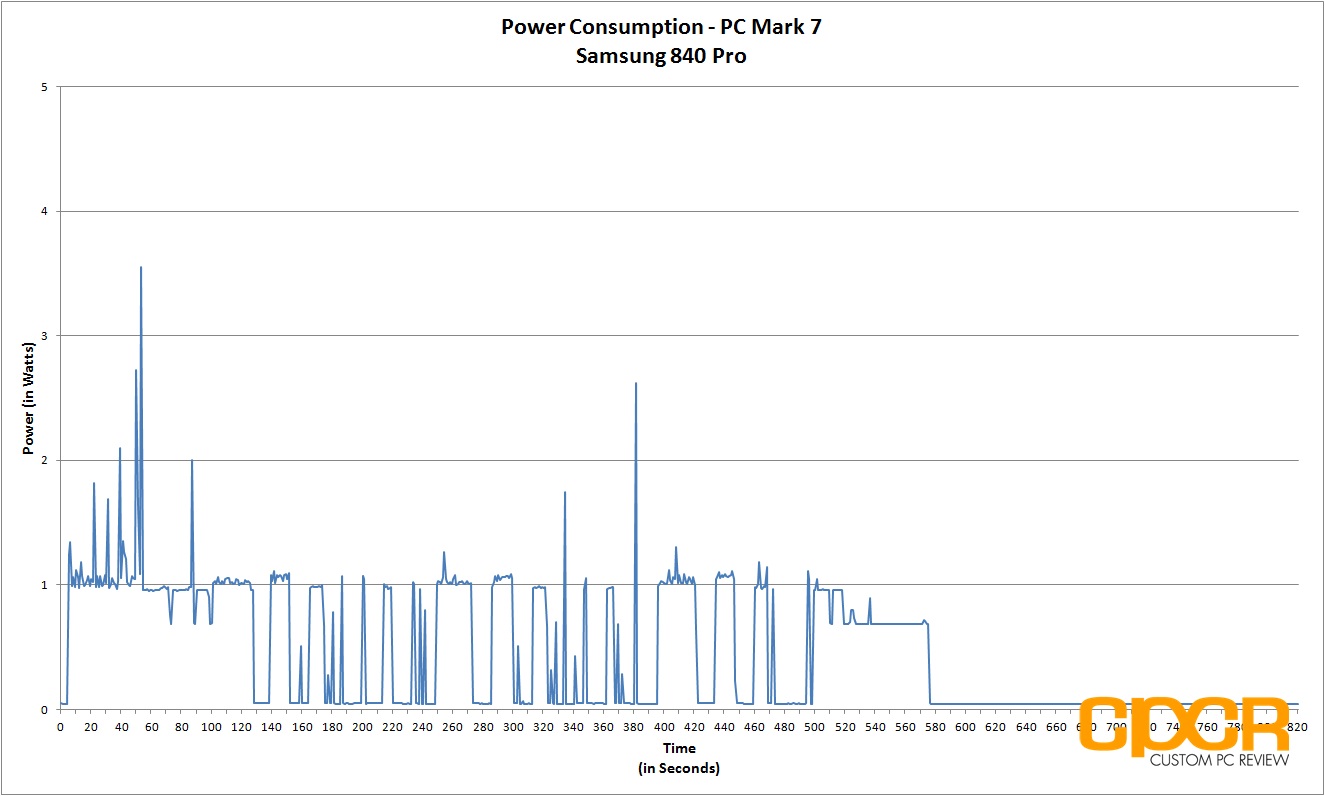
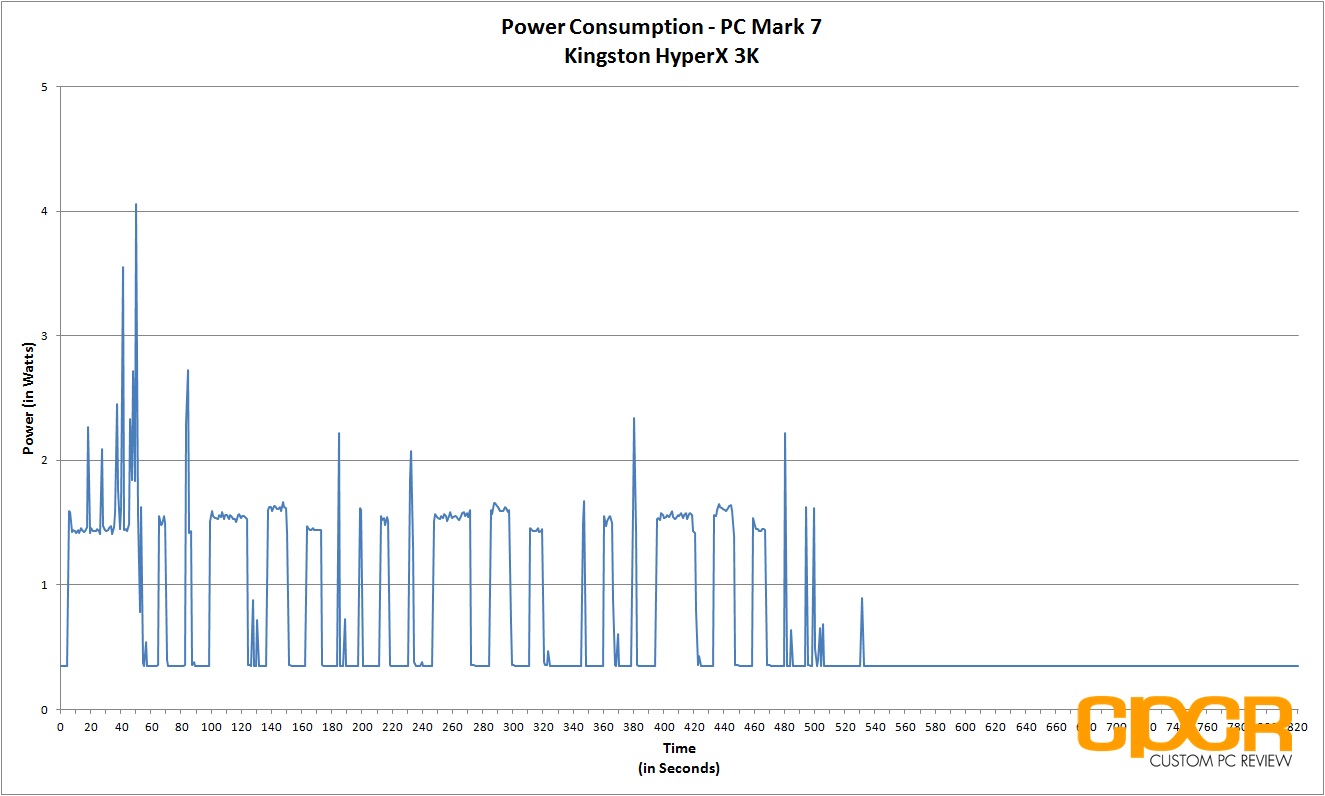
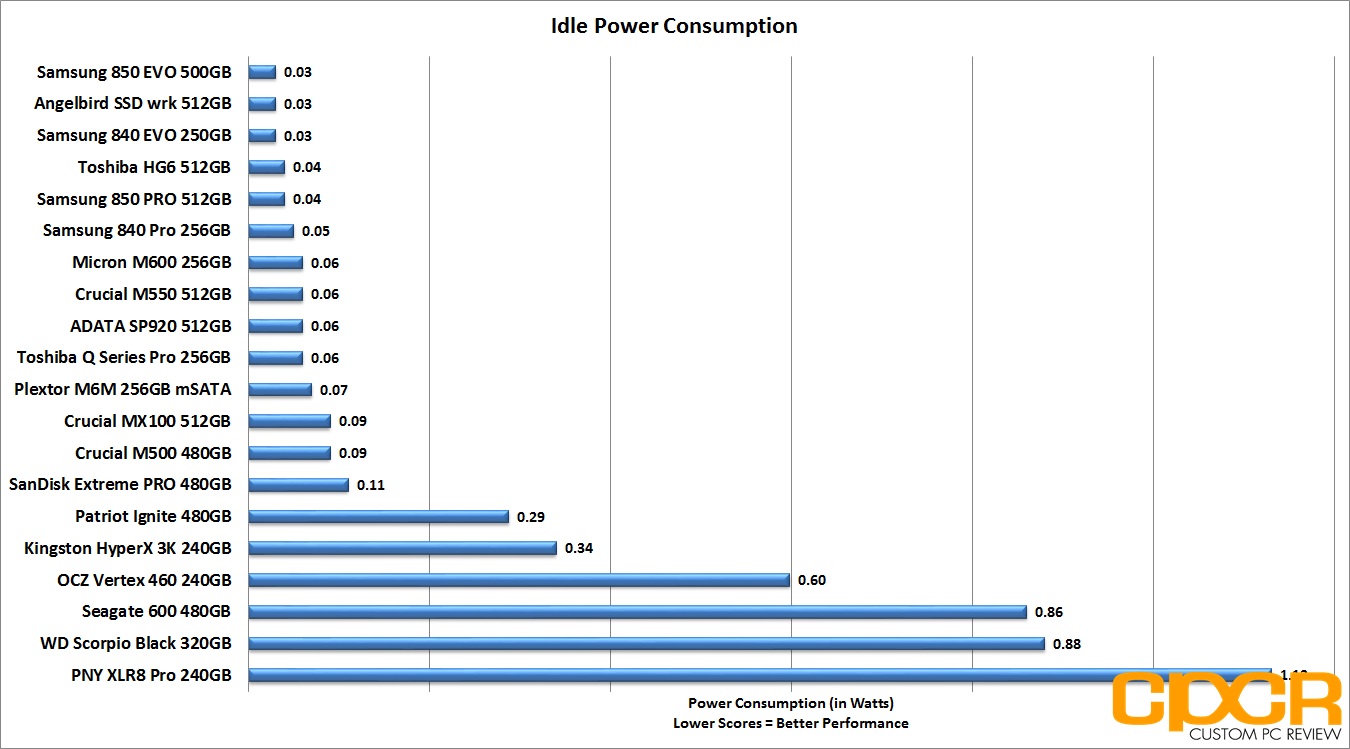
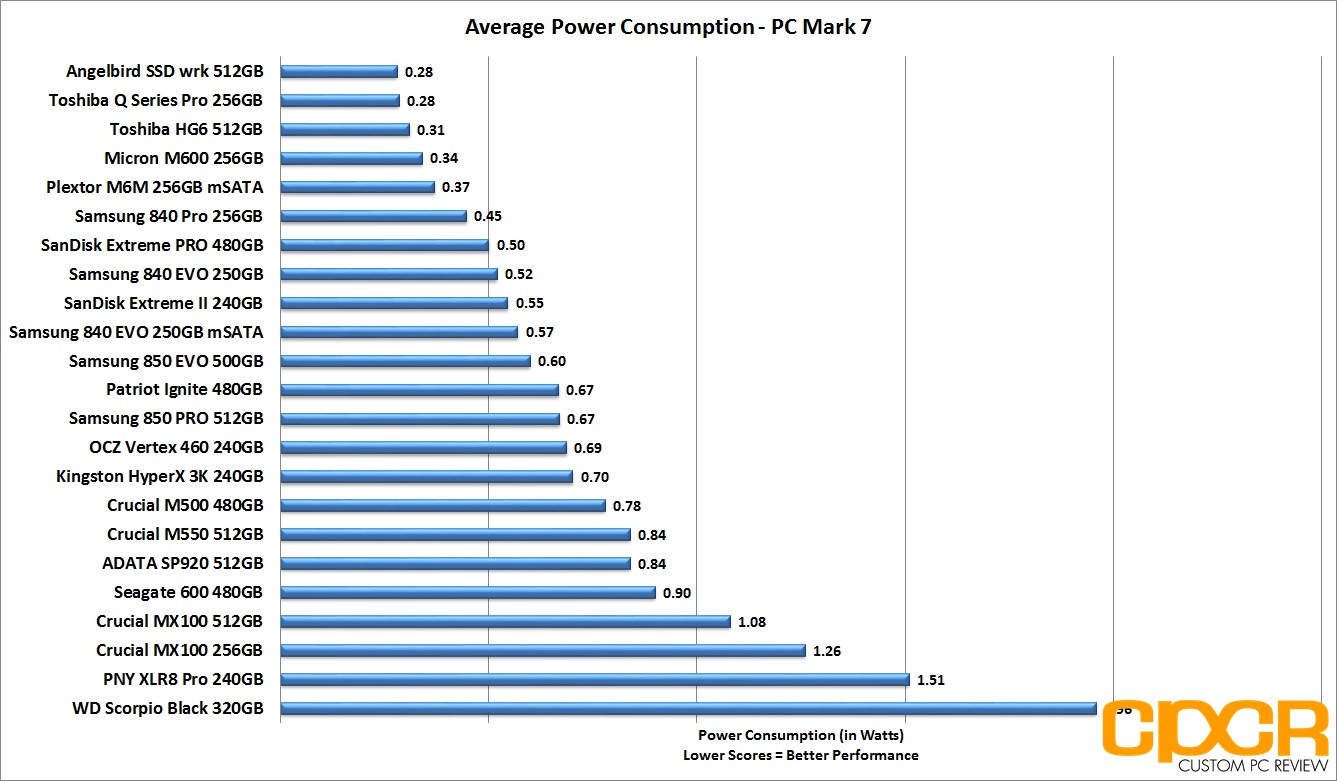
Performance Analysis
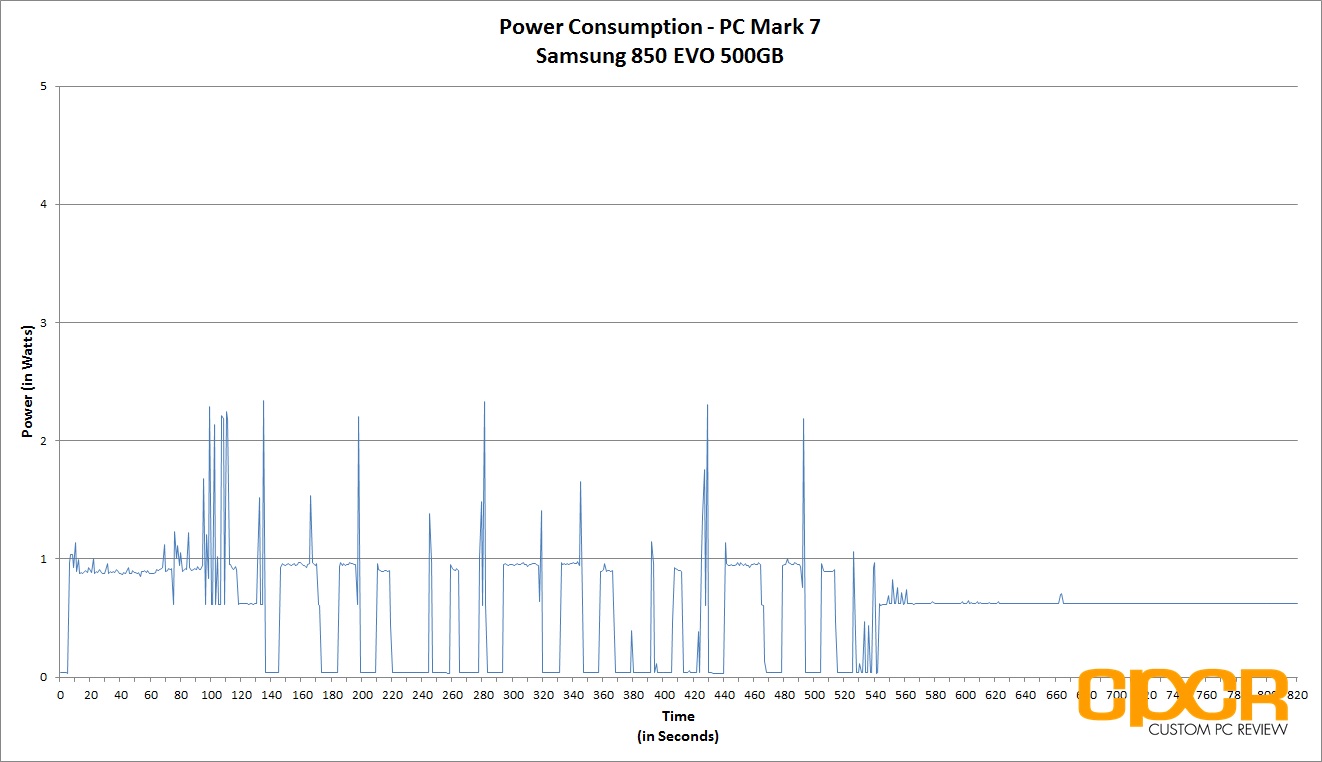
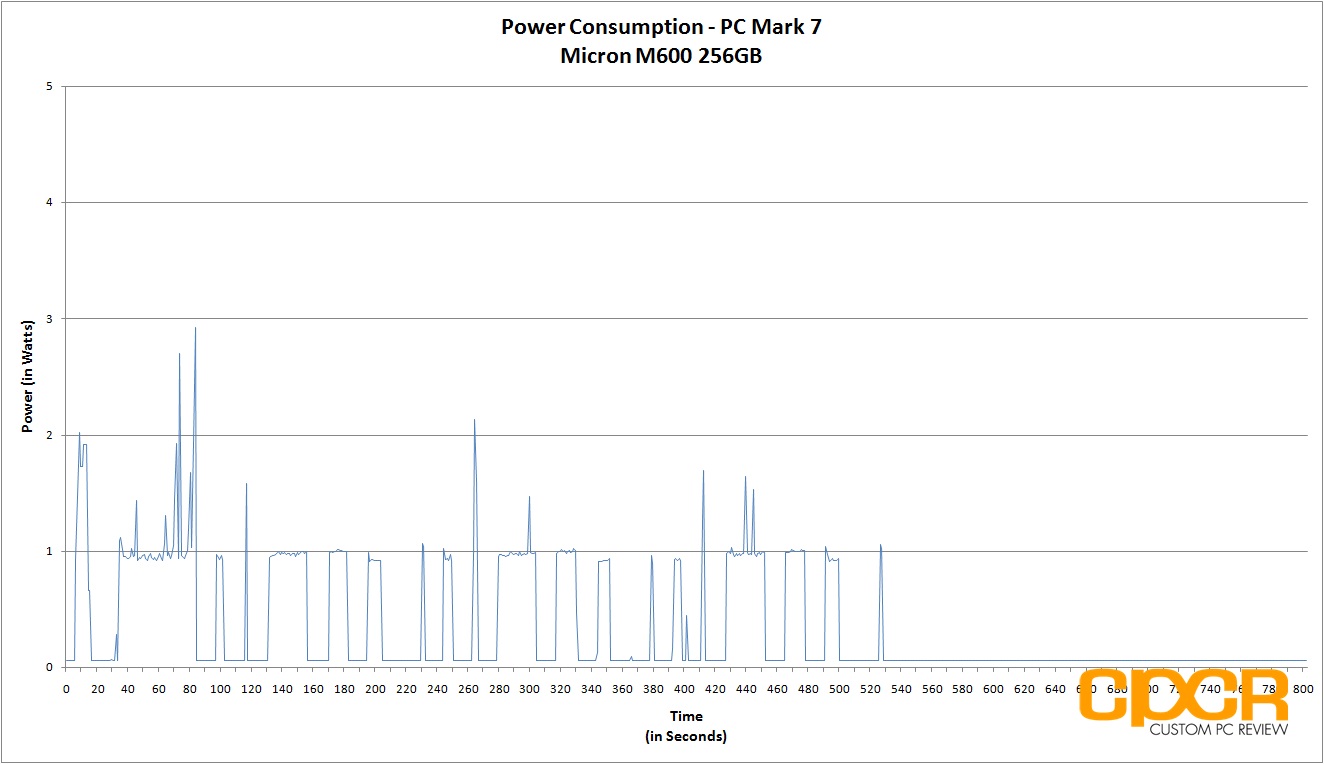
Power consumption on the Patriot Ignite is very much middle of the road. Idle power consumption was measured at ~0.29w which is higher than most modern SSDs which typically draw ~0.11w or less. Average power consumption in our PC Mark 7 run was fairly good with the Patriot Ignite drawing an average of 0.67w.
[section label=12. Conclusion]
Patriot Ignite 480GB Conclusions
 With testing out of the way, let’s talk a little bit more about our results. The Patriot Ignite is a unique SSD with an interesting mix of a high performance controller and relatively slow NAND. Because of this combination, the Patriot Ignite is able to achieve significantly higher performance than anything else I’ve seen using asynchronous MLC. It’s still slightly slower than most entry level MLC or toggle NAND based SSDs, but I think this is still a huge win for Phison being able to achieve this level of performance using asynchronous NAND. As for the drive as a whole, the Patriot Ignite is perfectly acceptable for most read heavy client workloads.
Power consumption on the Patriot Ignite is decent, but it’s overshadowed by slightly more power efficient drives using Samsung, Toshiba, Silicon Motion, and Marvell controllers. While it’s still a fairly power efficient drive for mobile applications, my first choice for those looking for something for mobile applications would definitely be SSDs powered by Samsung, Toshiba, or Silicon Motion controllers.
| Manufacturer | Patriot | Patriot |
|---|---|---|
| Model | Ignite | Ignite |
| SKU | PI480GS25SSDR | PI960GS25SSDR |
| Capacity | 480 GB | 960 GB |
| Street Price | $199.99 | $547.99 |
| Price/GB | ~$0.42 | ~$0.57 |
| Check Price | Click Here | Click Here |
Pricing on the Patriot Ignite 480GB is ~$199.99 (~$0.42/GB) at various online retailers and comes with a relatively standard 3 year warranty. However, with drives from first tier manufacturers such as the Samsung 850 EVO, Crucial BX100, and SanDisk Ultra II regularly retailing at under $0.40/GB, the Patriot Ignite just isn’t all that competitive.
Overall the Patriot Ignite is a decent SSD for users just looking to jump into the SSD for the first time, but it really needs to be priced more aggressively, or it needs to offer a bit more to be competitive. If you can find one for $0.35/GB or less, it’s worth a shot, but otherwise there are cheaper, faster, and more compelling entry level offerings instead.

Sample provided by: Patriot Memory
Availability: Amazon
