[section label=1. Introduction]
OCZ Forays into TLC
 When we look at the SSD market today, there’s two distinct group of consumers. On one hand are the enthusiasts who are willing to pay for the highest performance drives ever produced. These are the guys looking into high end SATA and PCIe drives, but aren’t really a huge part of the total consumer SSD market. On the other hand is the bulk of the SSD market which is filled with entry level and mainstream consumers who just want a cost effective product that can give them a SSD user experience. These are the guys looking for the most cost effective solution possible as most of their time spent on a computer simply revolves around starting up a computer, running Microsoft Word, watching a bit of YouTube, and reading some e-mail. Because the biggest concern for this market is cost, TLC NAND, products using TLC NAND, and controllers that support TLC NAND have become some of the hottest topics in the storage industry.
Last month, I visited the OCZ Storage Solutions booth at Computex 2015 and while they did show off an upcoming high end PCIe SSD, they also showed off an upcoming TLC NAND based SSD, the OCZ Trion 100. Speaking with OCZ representatives, I was told that the Trion 100 would be OCZ’s most entry level SSD and it would be their first product to leverage both Toshiba’s NAND and controller technology. Since I’ve had some great experiences with Toshiba drives in the past, it’s safe to say that I was excited.
OCZ Trion 100 Specifications
| Manufacturer | OCZ | OCZ | OCZ | OCZ |
|---|---|---|---|---|
| Model | Trion 100 | Trion 100 | Trion 100 | Trion 100 |
| Model Number | TRN100-25SAT3-120G | TRN100-25SAT3-240G | TRN100-25SAT3-480G | TRN100-25SAT3-960G |
| Form Factor | 7mm, 2.5″ | 7mm, 2.5″ | 7mm, 2.5″ | 7mm, 2.5″ |
| Capacity | 120GB | 240GB | 480GB | 960GB |
| Controller | Toshiba TC58 | Toshiba TC58 | Toshiba TC58 | Toshiba TC58 |
| NAND | Toshiba A19nm Toggle mode TLC | Toshiba A19nm Toggle mode TLC | Toshiba A19nm Toggle mode TLC | Toshiba A19nm Toggle mode TLC |
| DRAM Cache | 256MB DDR3 | 256MB DDR3 | 512MB DDR3 | 1GB DDR3 |
| Sequential Reads | 550MB/s | 550MB/s | 550MB/s | 550MB/s |
| Sequential Writes | 450MB/s | 520MB/s | 530MB/s | 530MB/s |
| 4K Random Read | 79,000 | 90,000 | 90,000 | 90,000 |
| 4K Random Write | 25,000 | 43,000 | 54,000 | 64,000 |
| Interface | SATA 6Gb/s | SATA 6Gb/s | SATA 6Gb/s | SATA 6Gb/s |
| Warranty | 3 Years, 30TB | 3 Years, 60TB | 3 Years, 120TB | 3 Years, 240TB |
The OCZ Trion 100 will be available in capacities of 120GB, 240GB, 480GB, and 960GB in the 7mm, 2.5″ SATA form factor. Internally, the Trion 100 is essentially a Toshiba drive validated, tweaked, and re-marketed by OCZ. It’s powered by a Toshiba TC58 controller along with Toshiba’s latest A19nm Toggle Mode TLC. As far as I know, this will be the first SSD on the retail market using Toshiba’s A19nm Toggle Mode TLC. Toshiba did show off a TLC NAND based drive at FMS last year (Toshiba SG4), but that drive never did end up coming to the US retail market.
As TLC NAND has significantly slower write performance compared to MLC or SLC, performance on the Trion 100 is geared towards read intensive client workloads. While performance varies by capacity, the top tier Trion 100 960GB is rated for performance up to 550/530 MB/s sequential read/writes and 90,000/64,000 IOPS 4K random reads/writes.
Let’s take a closer look.
[section label=2. A Closer Look]
A Closer Look at the OCZ Trion 100 480GB
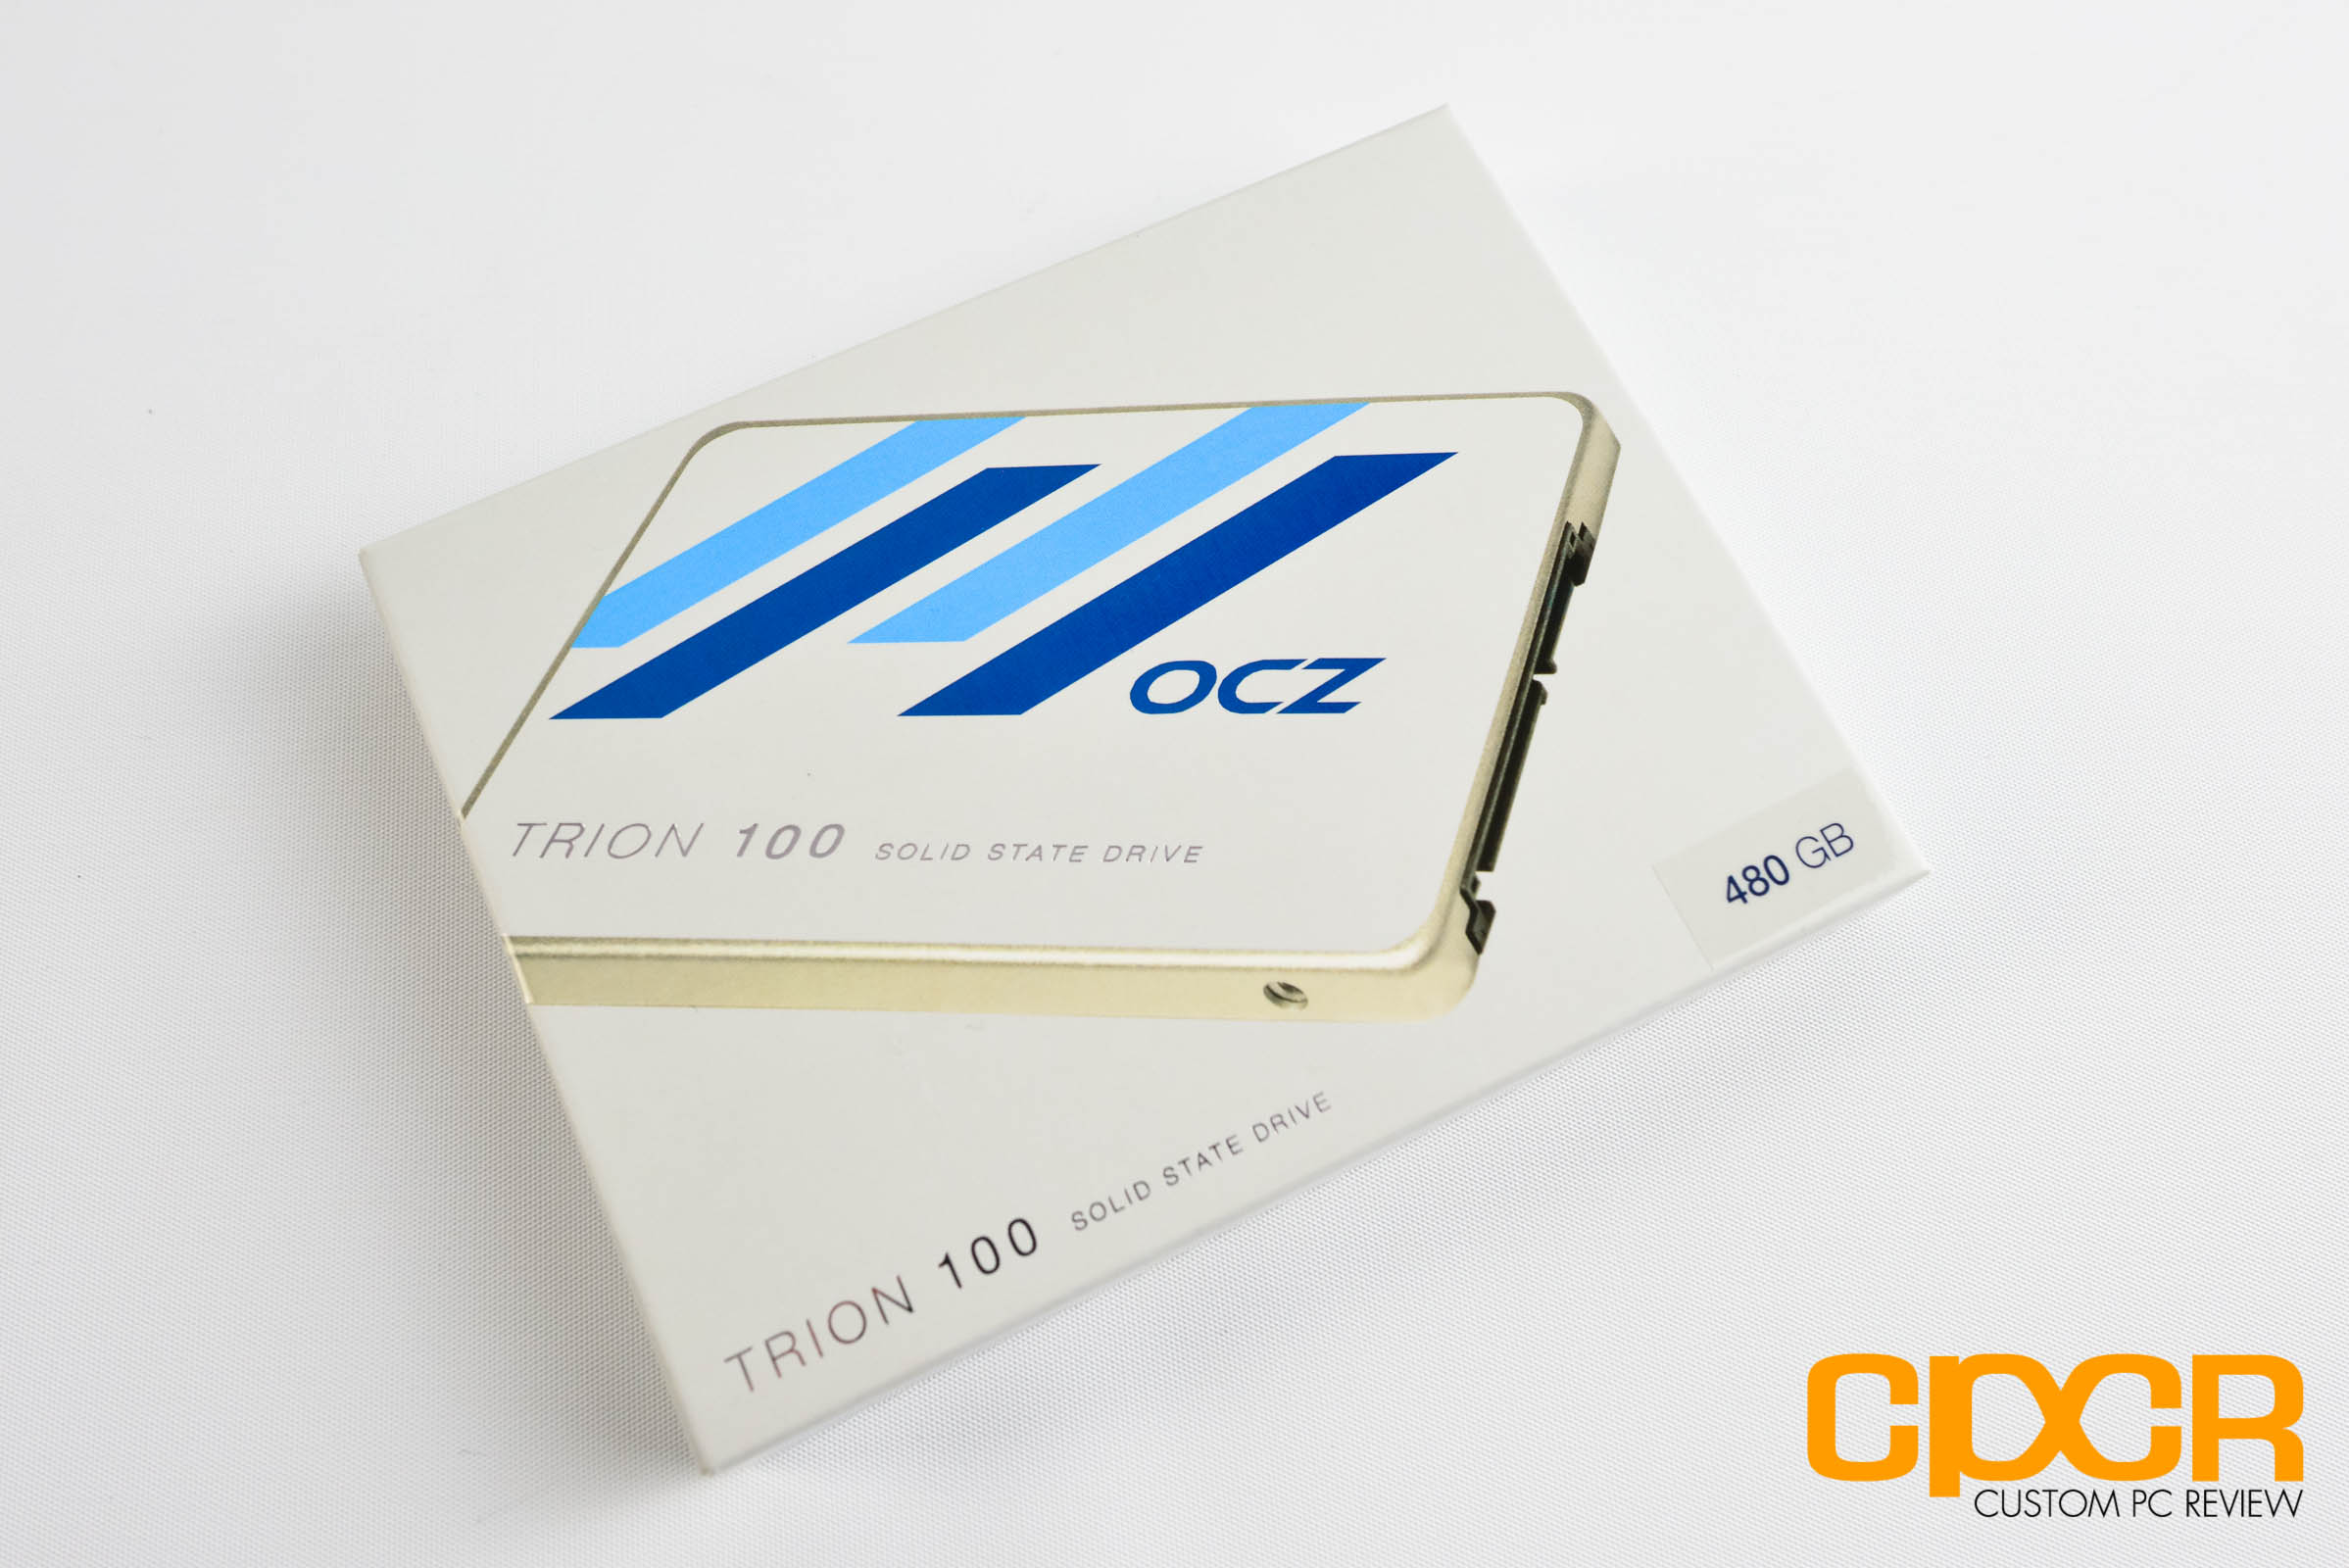
Here’s a look at the packaging for the OCZ Trion 100 480GB SSD.
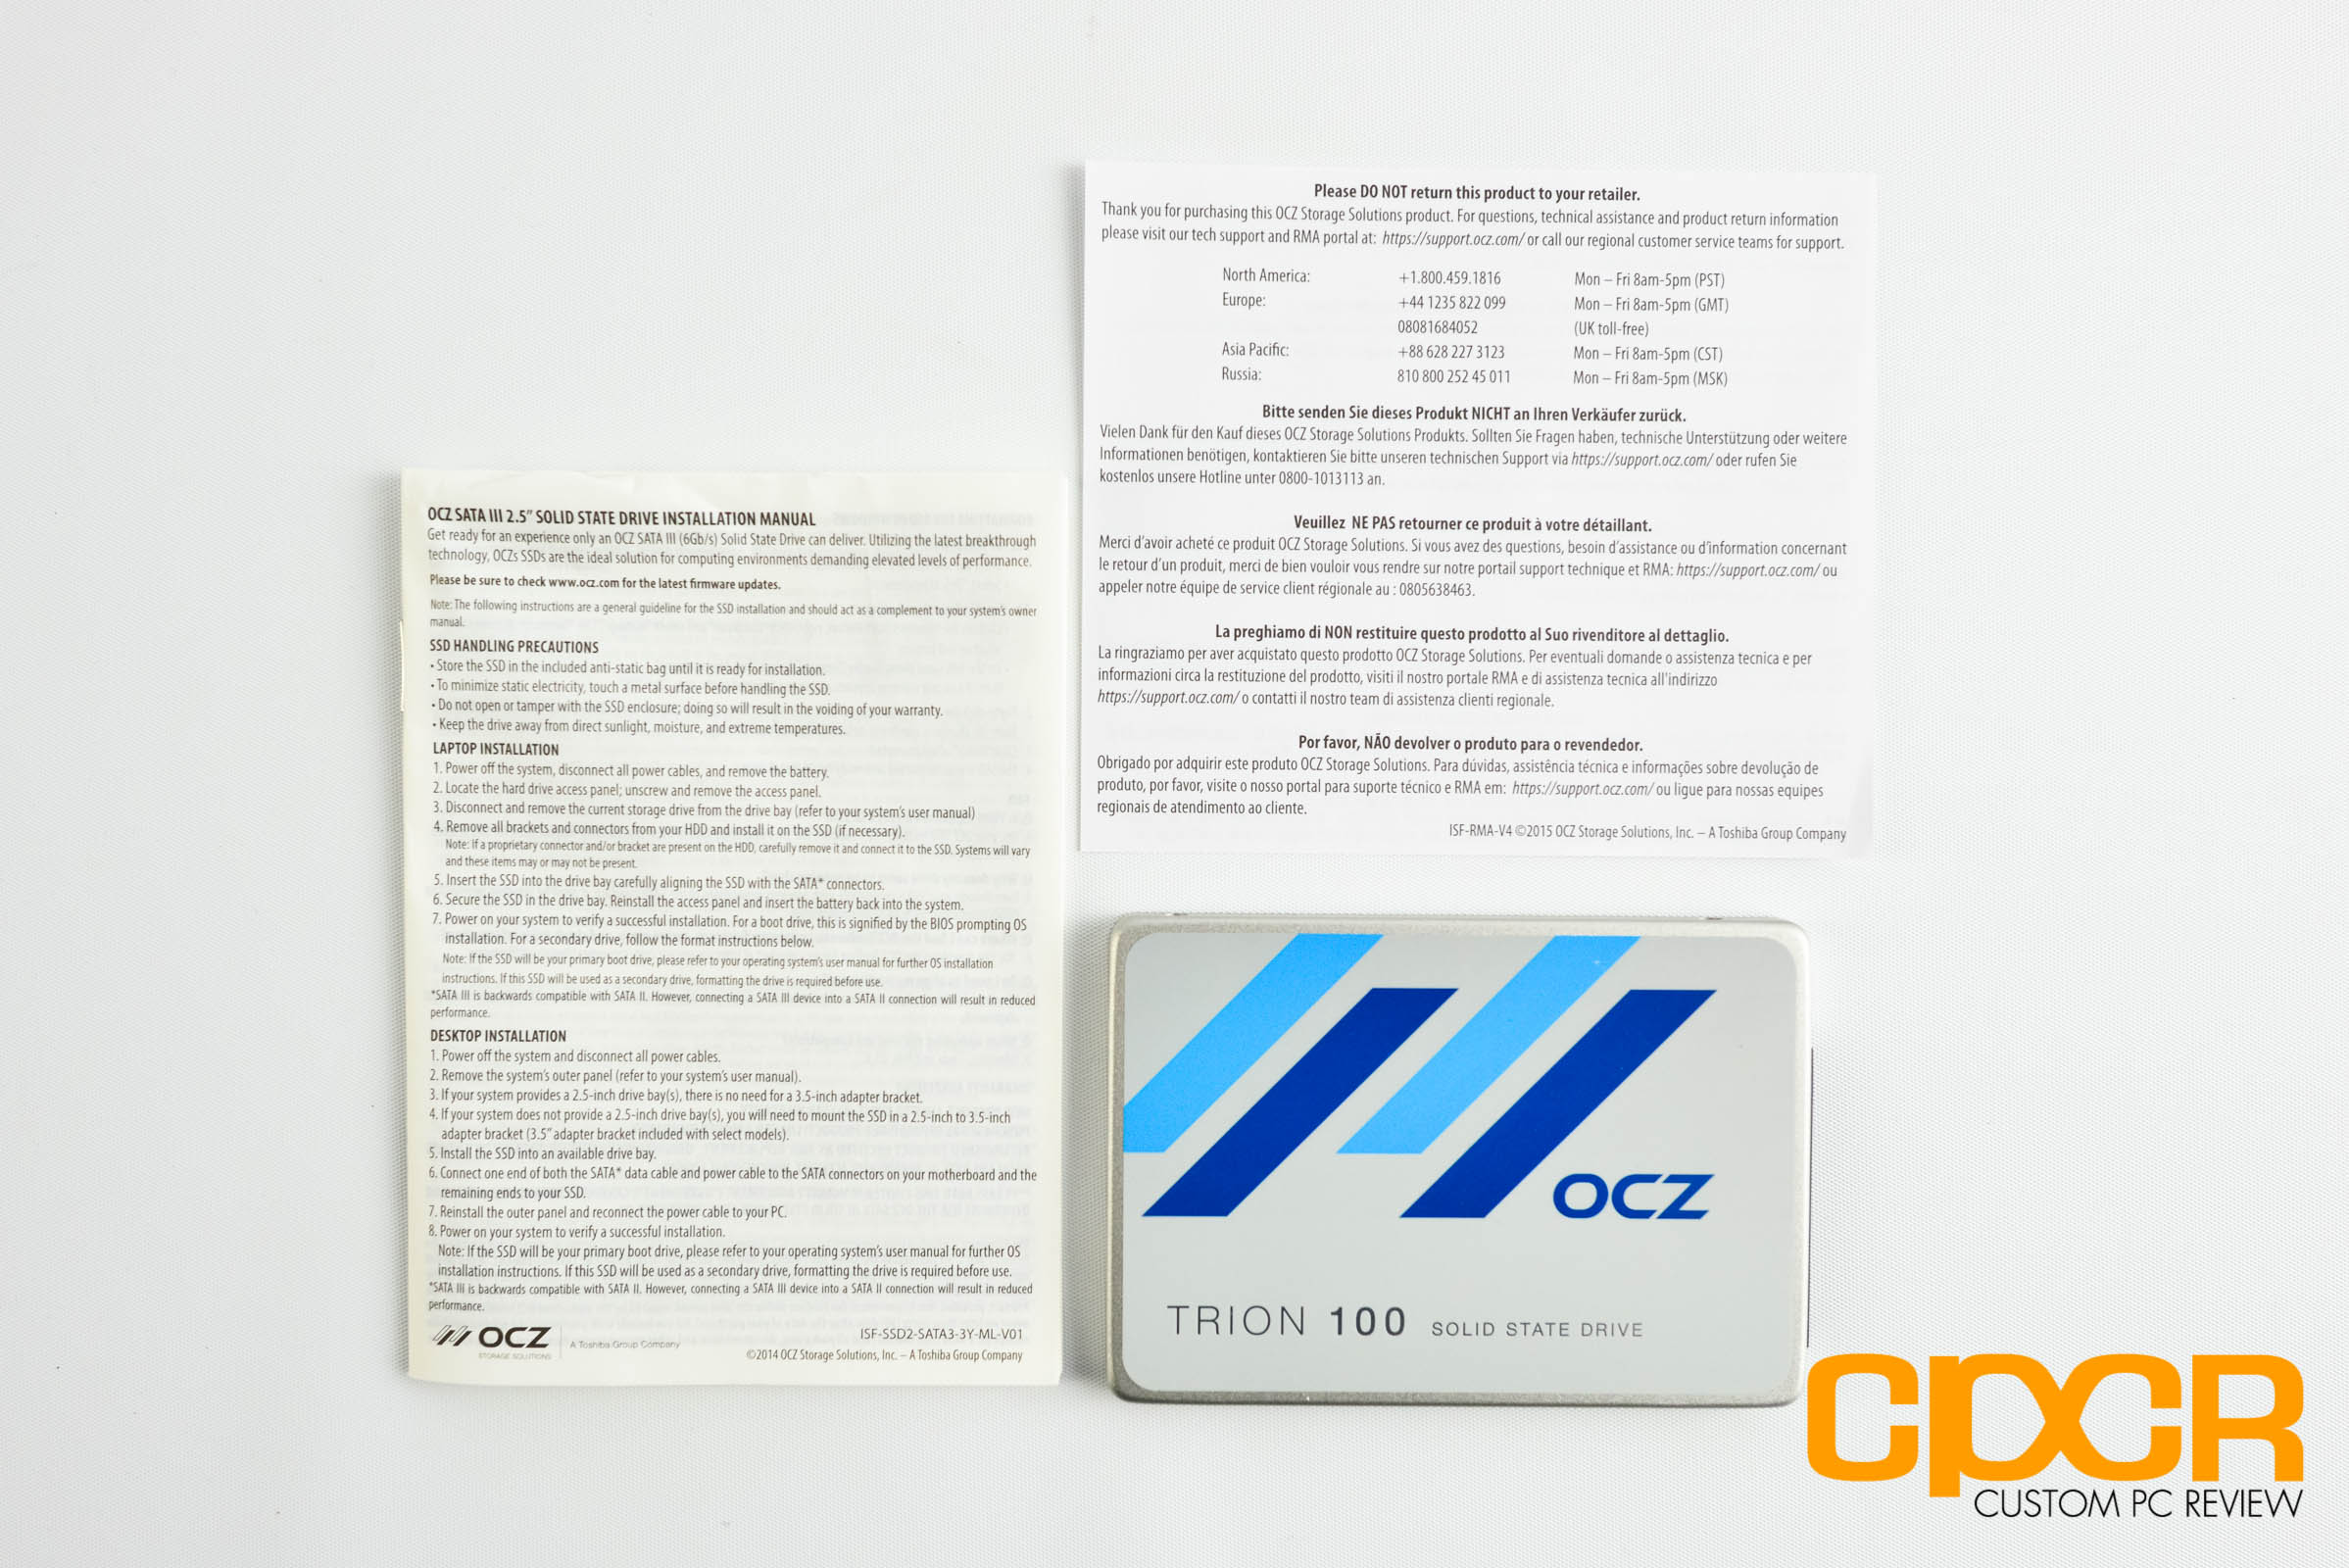
Since it’s a value drive, there really isn’t all that much in the packaging. Simply some documentation along with the drive itself.
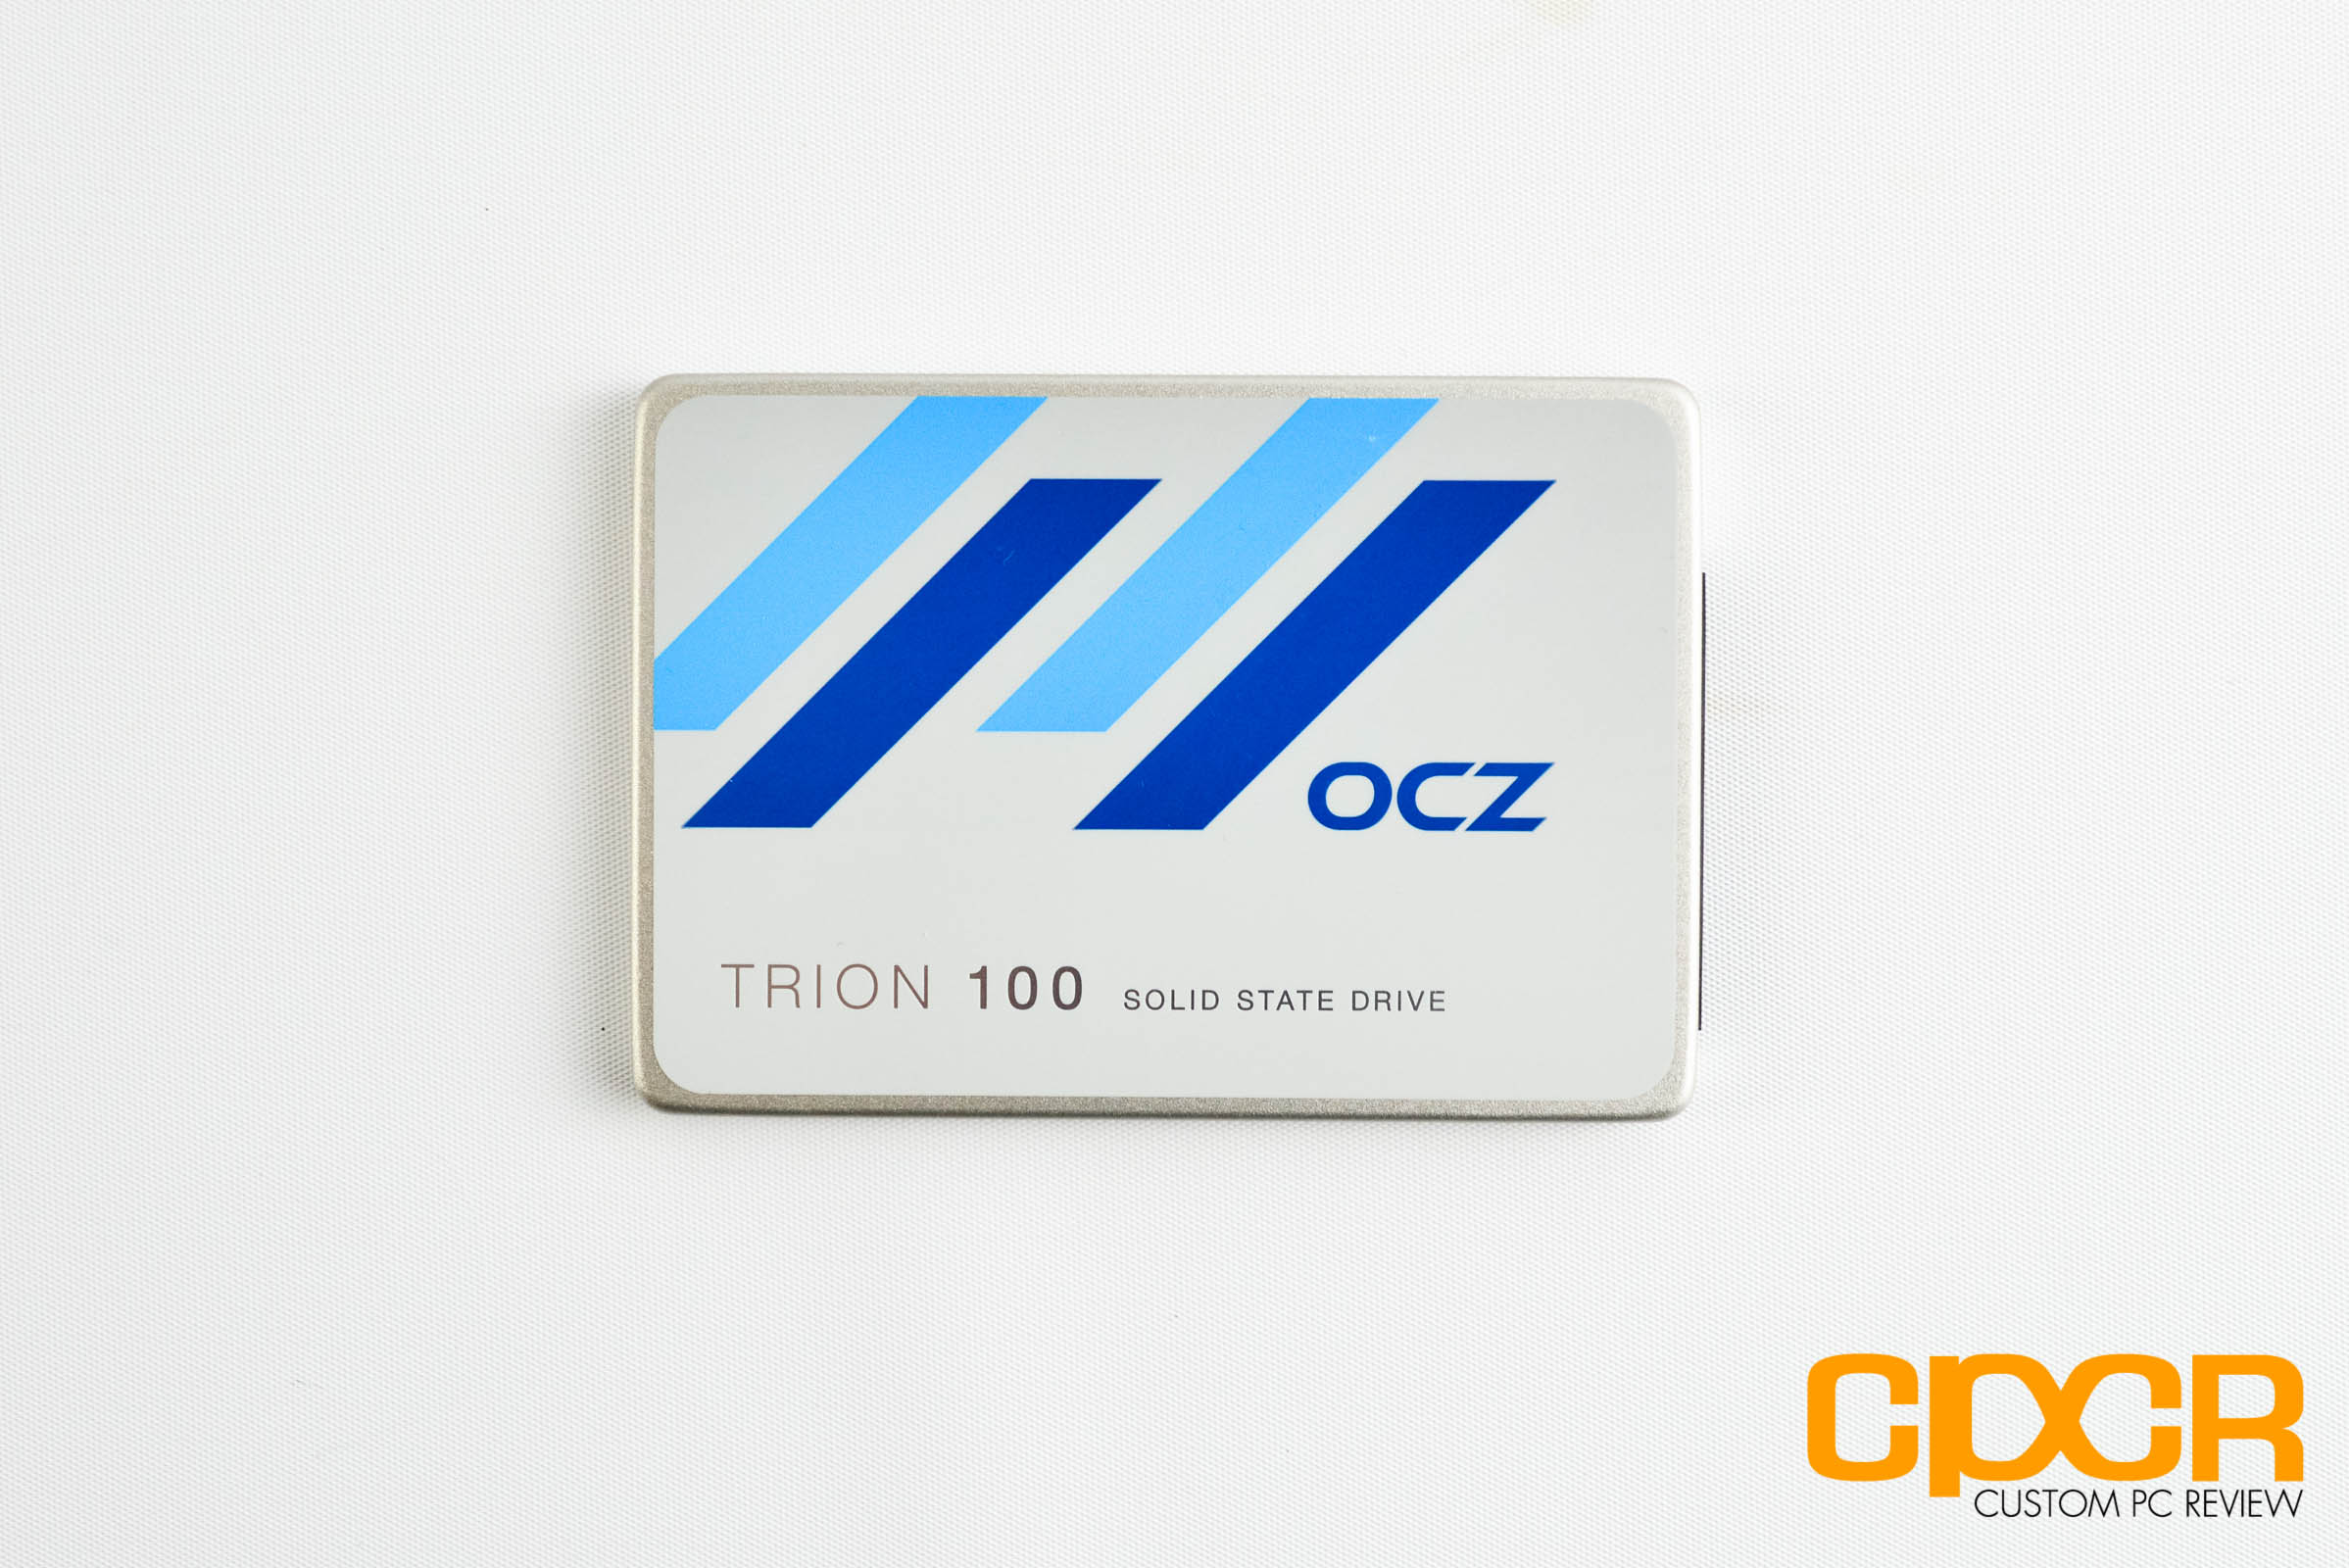
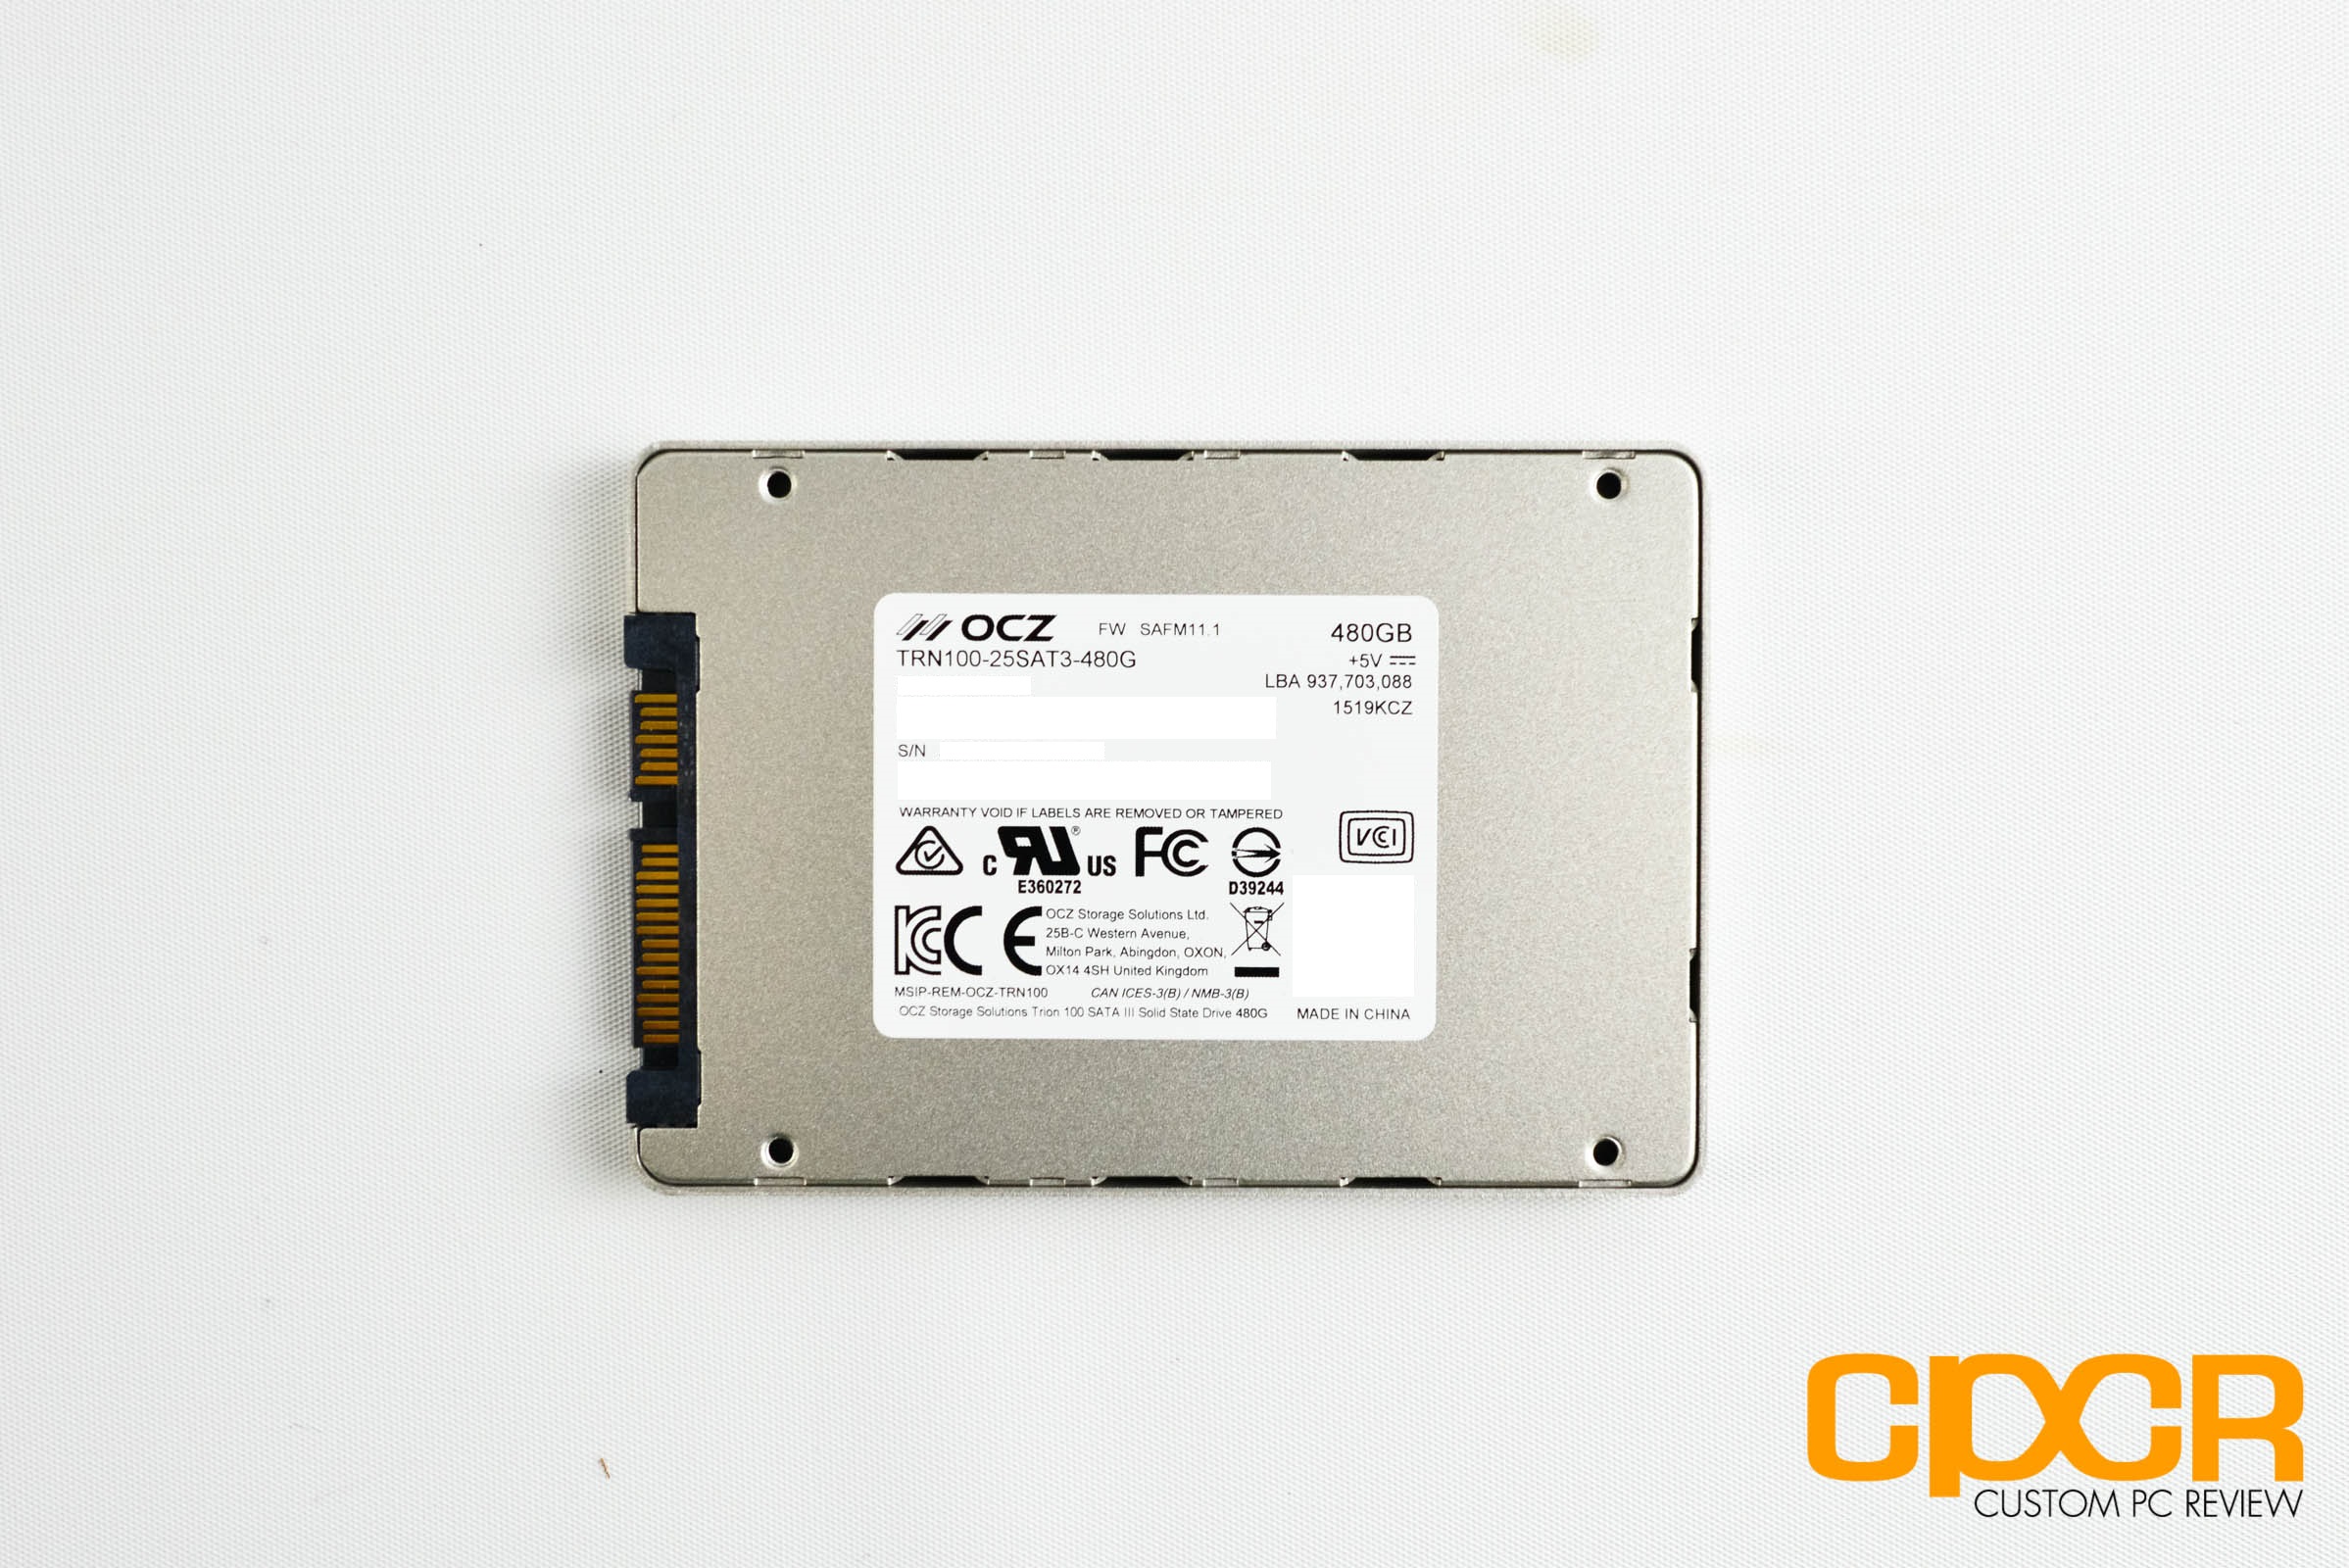
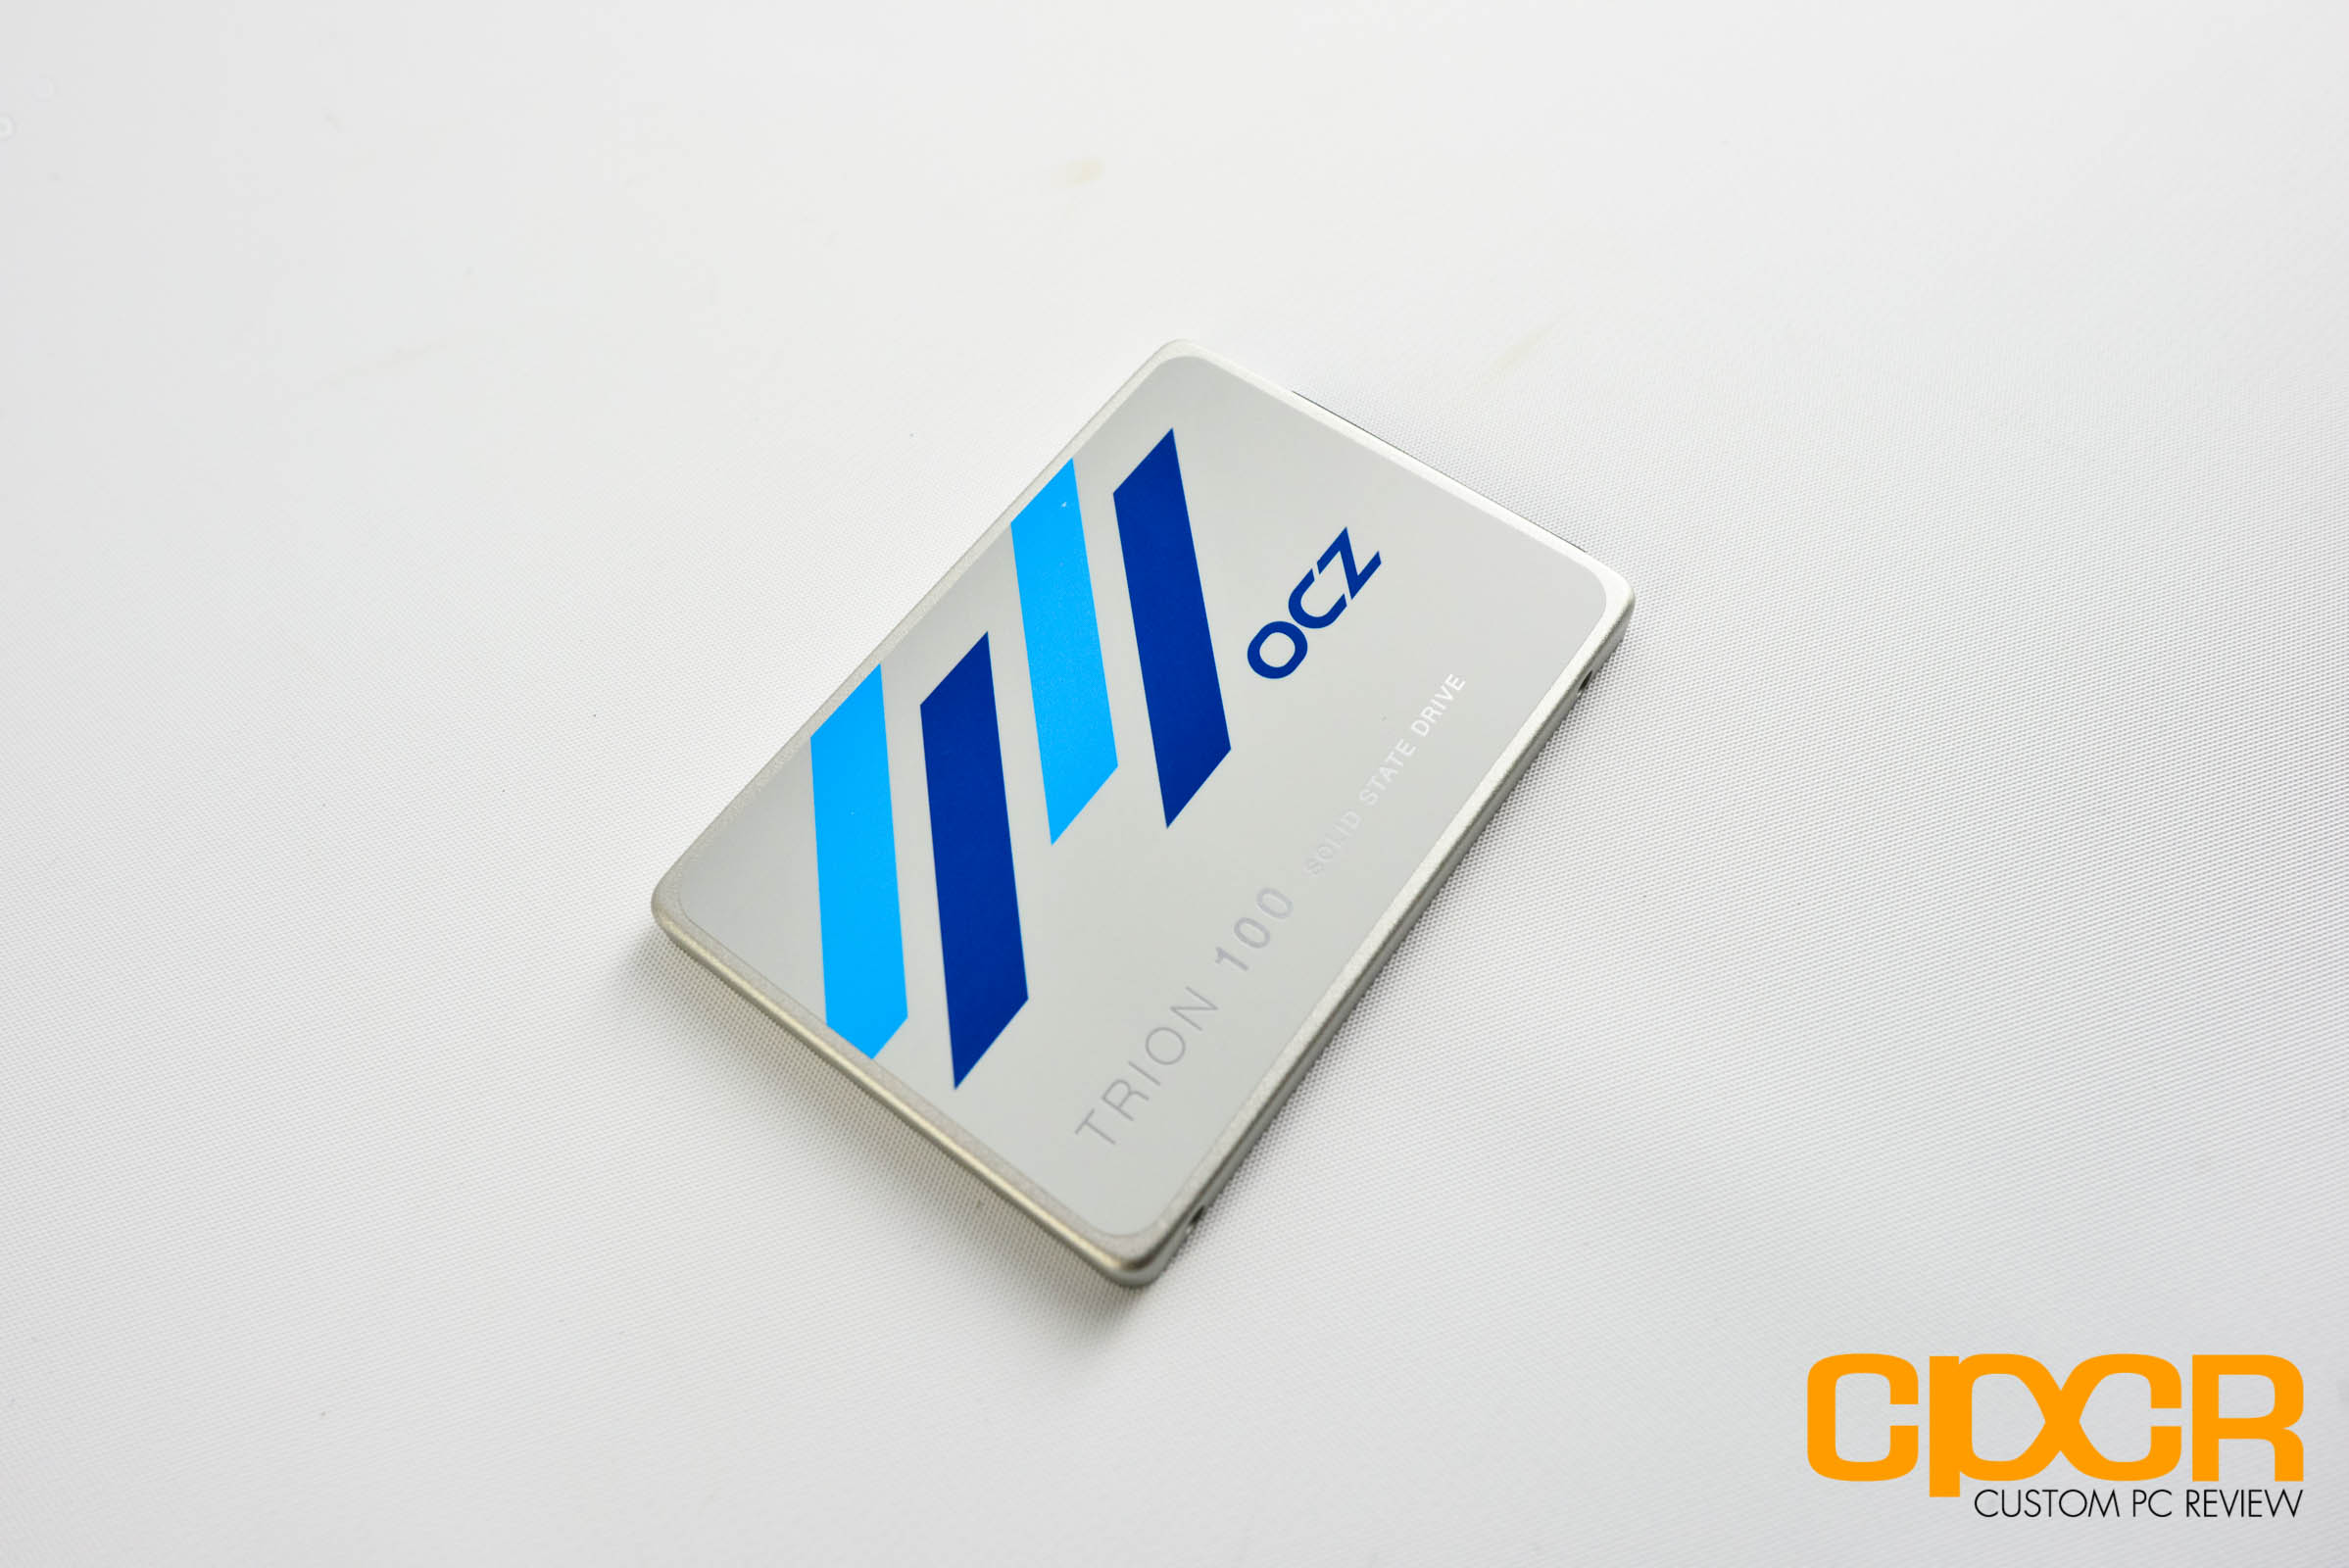
The metal chassis and the graphics design of the Trion 100 is very similar to other drives in OCZ’s SSD lineup. The drive utilizes a 7mm, 2.5″ SATA form factor.
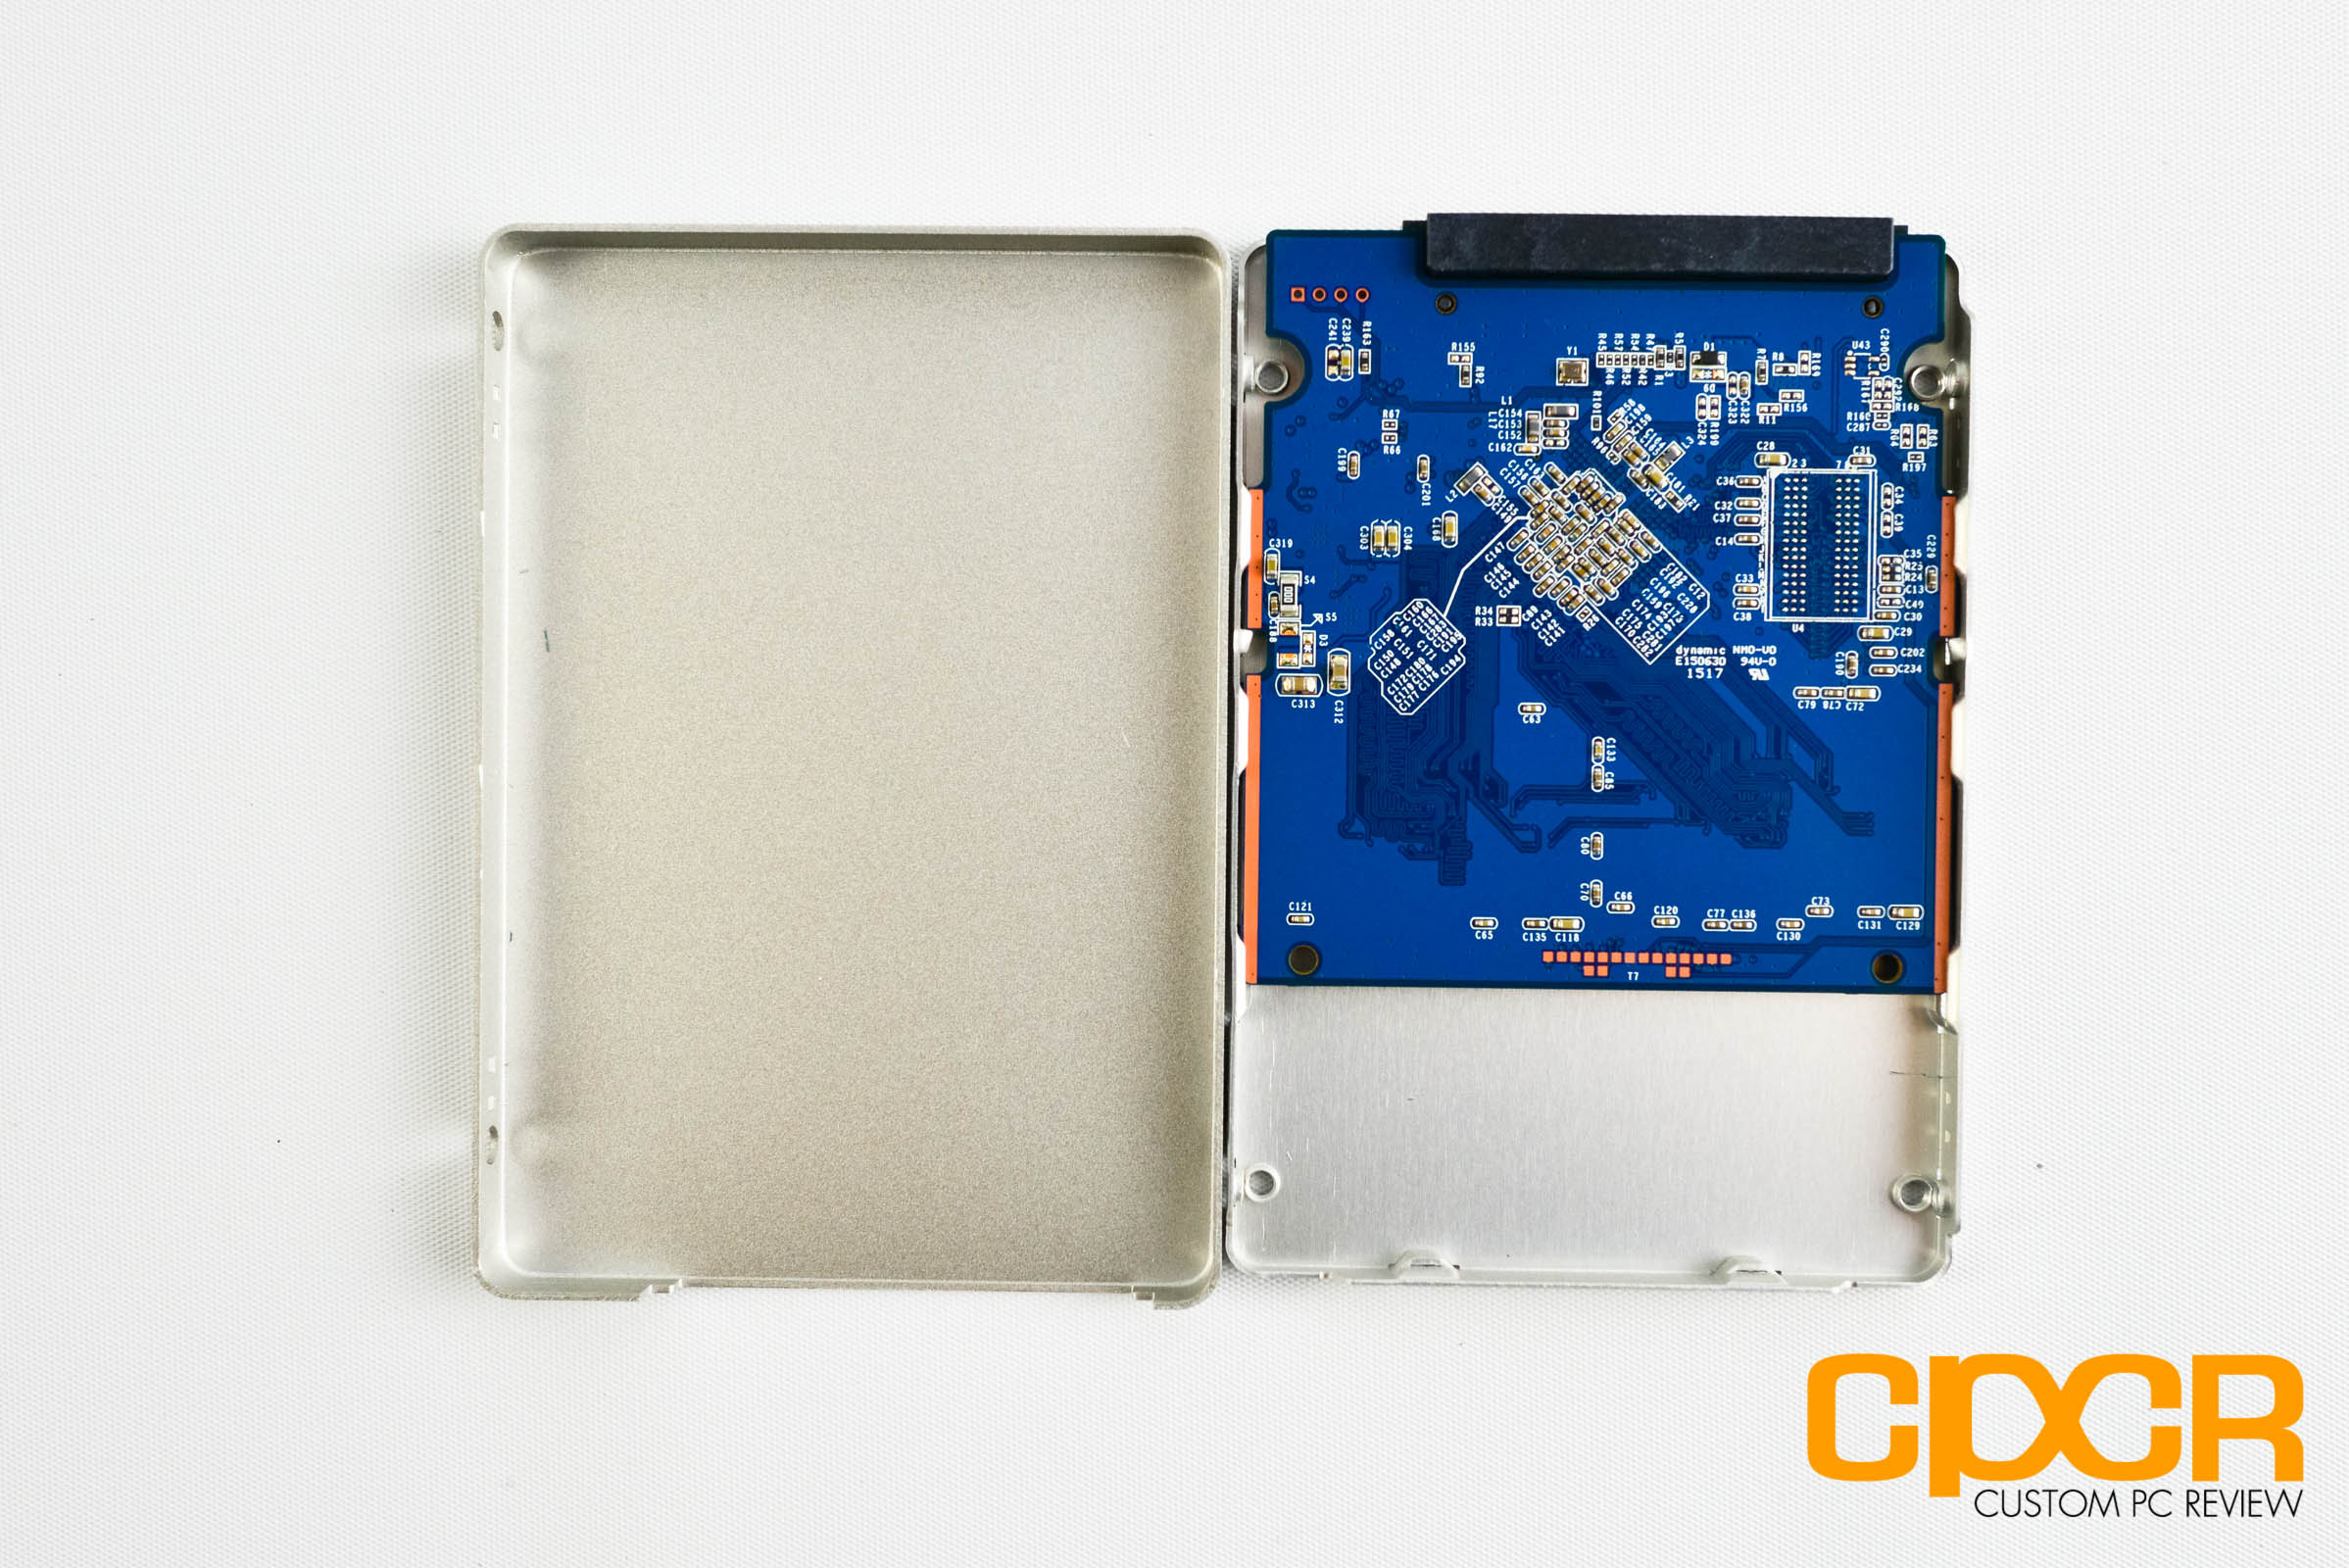
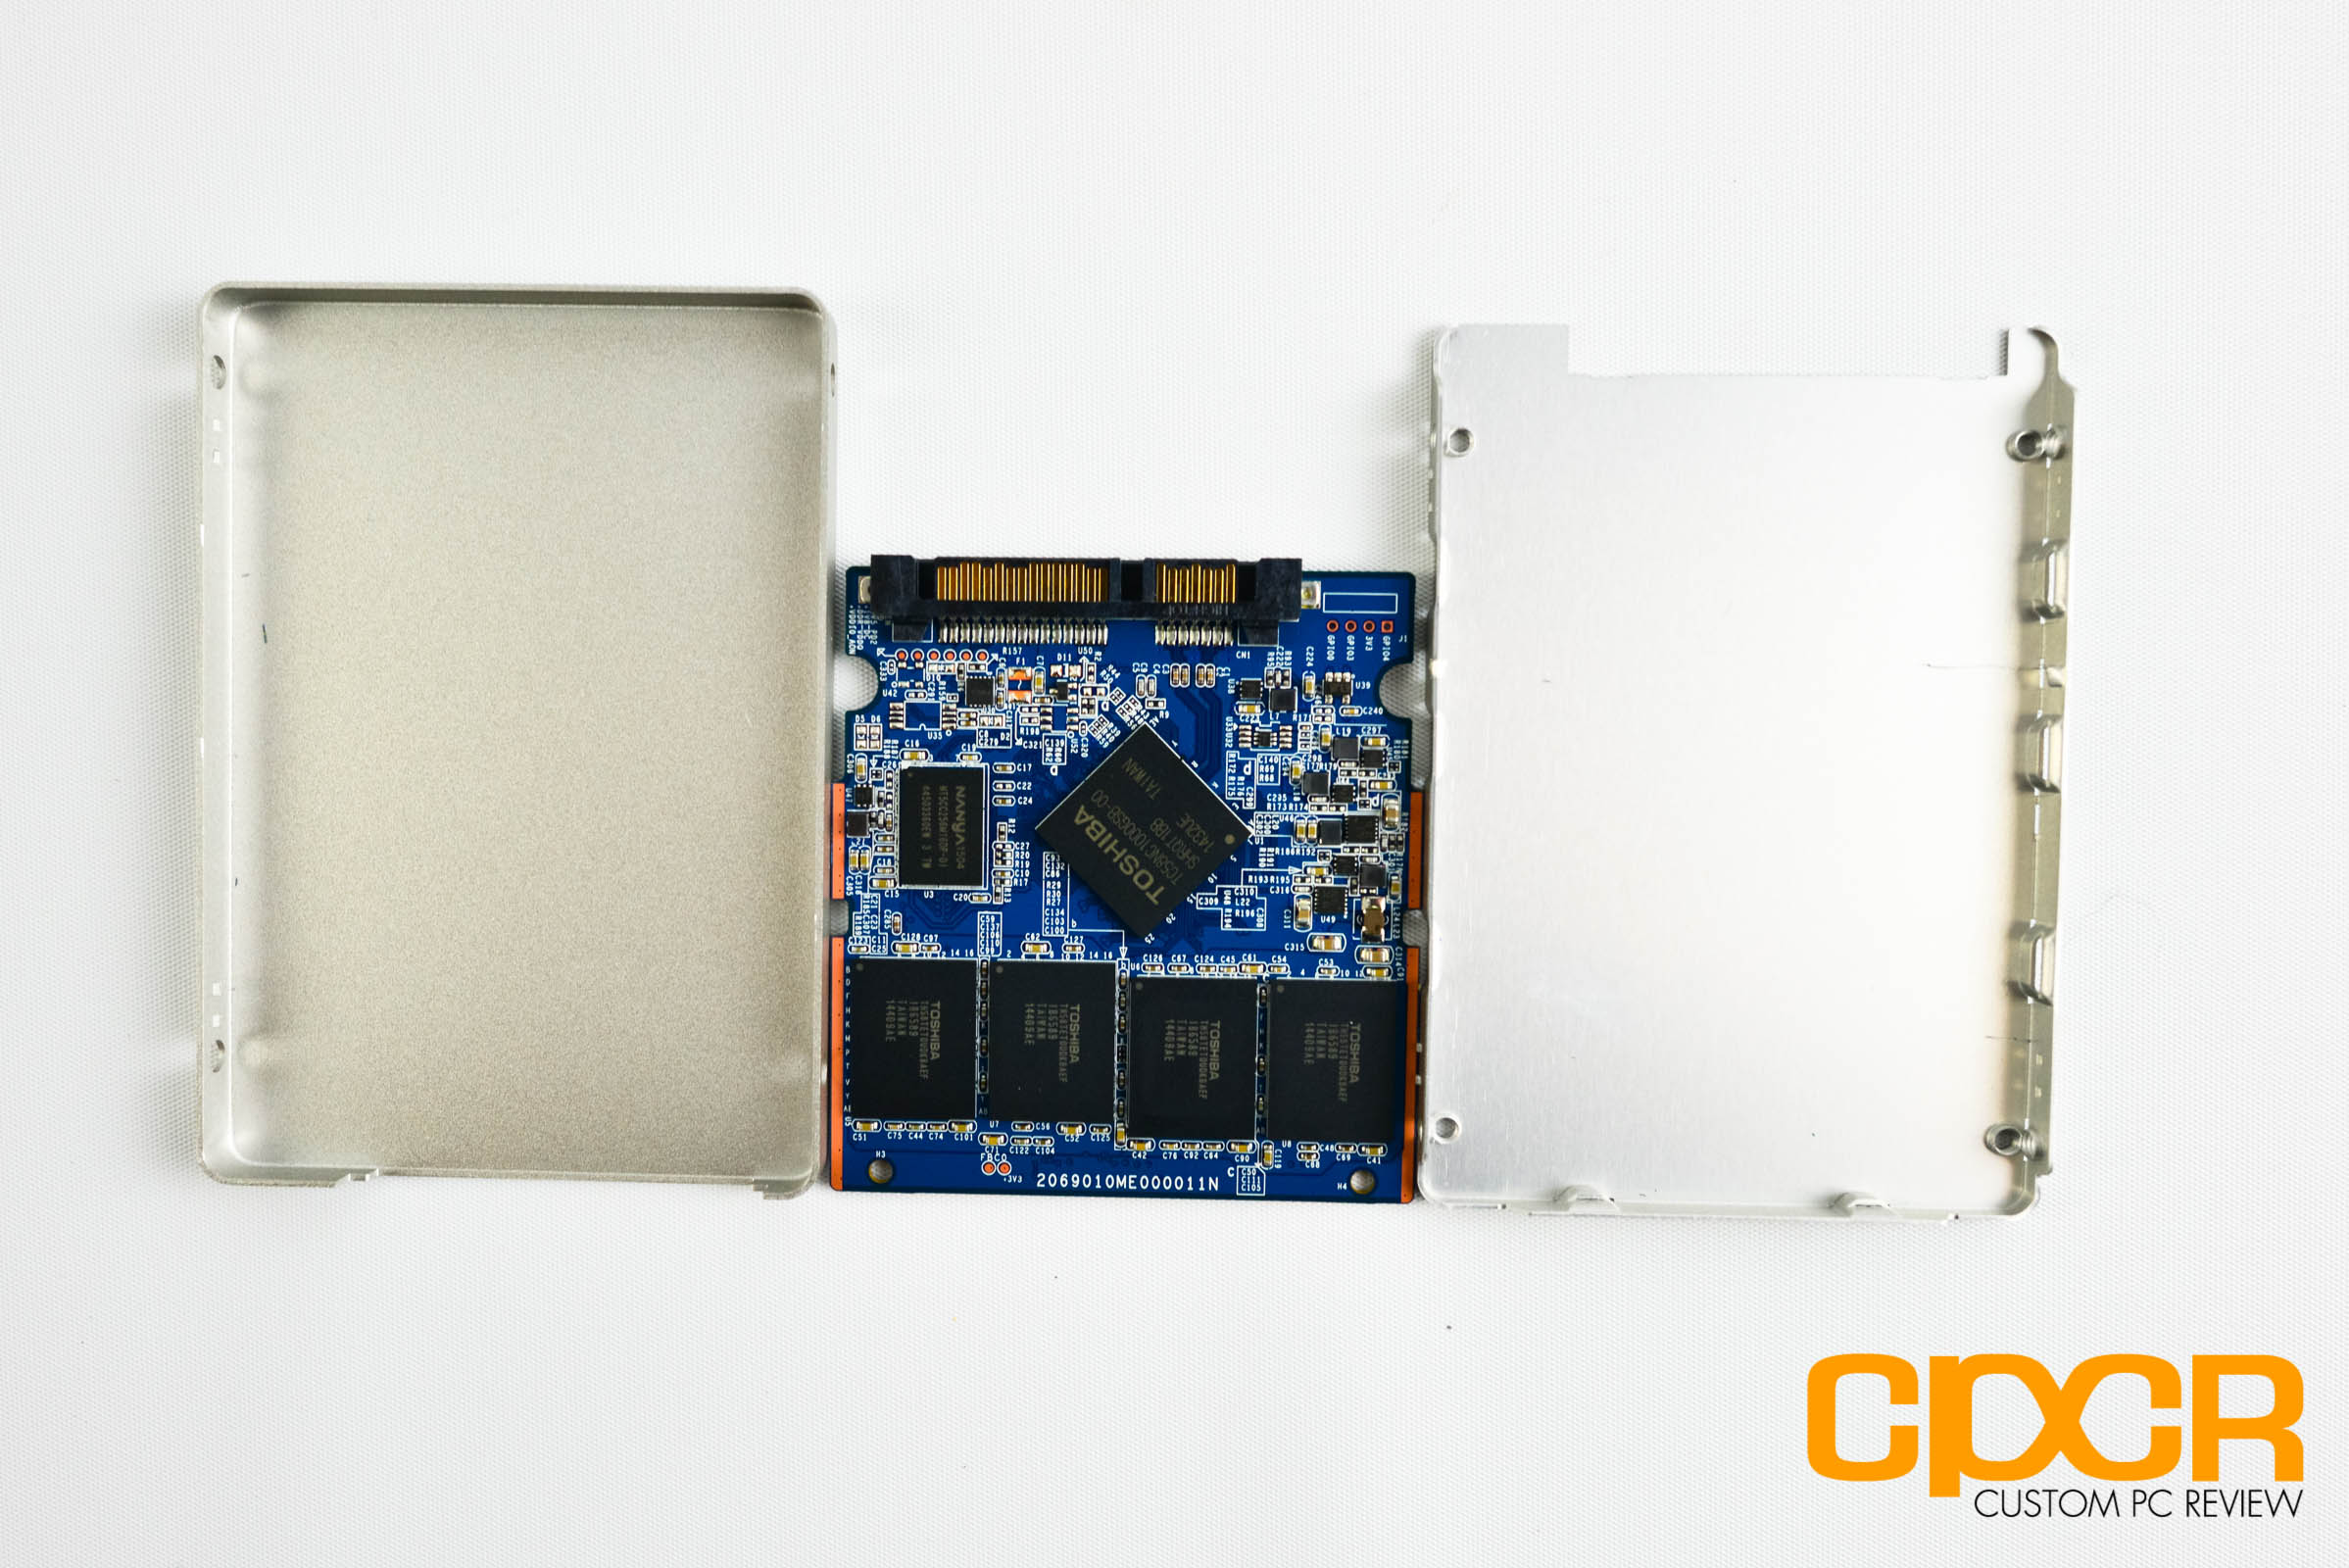
OCZ’s newest drives use a screwless case design, so opening it up simply involves pushing in a couple tabs. For the 480GB Trion 100, OCZ is using a half size PCB with only four NAND packages. Only a single side of the PCB is populated in our sample.
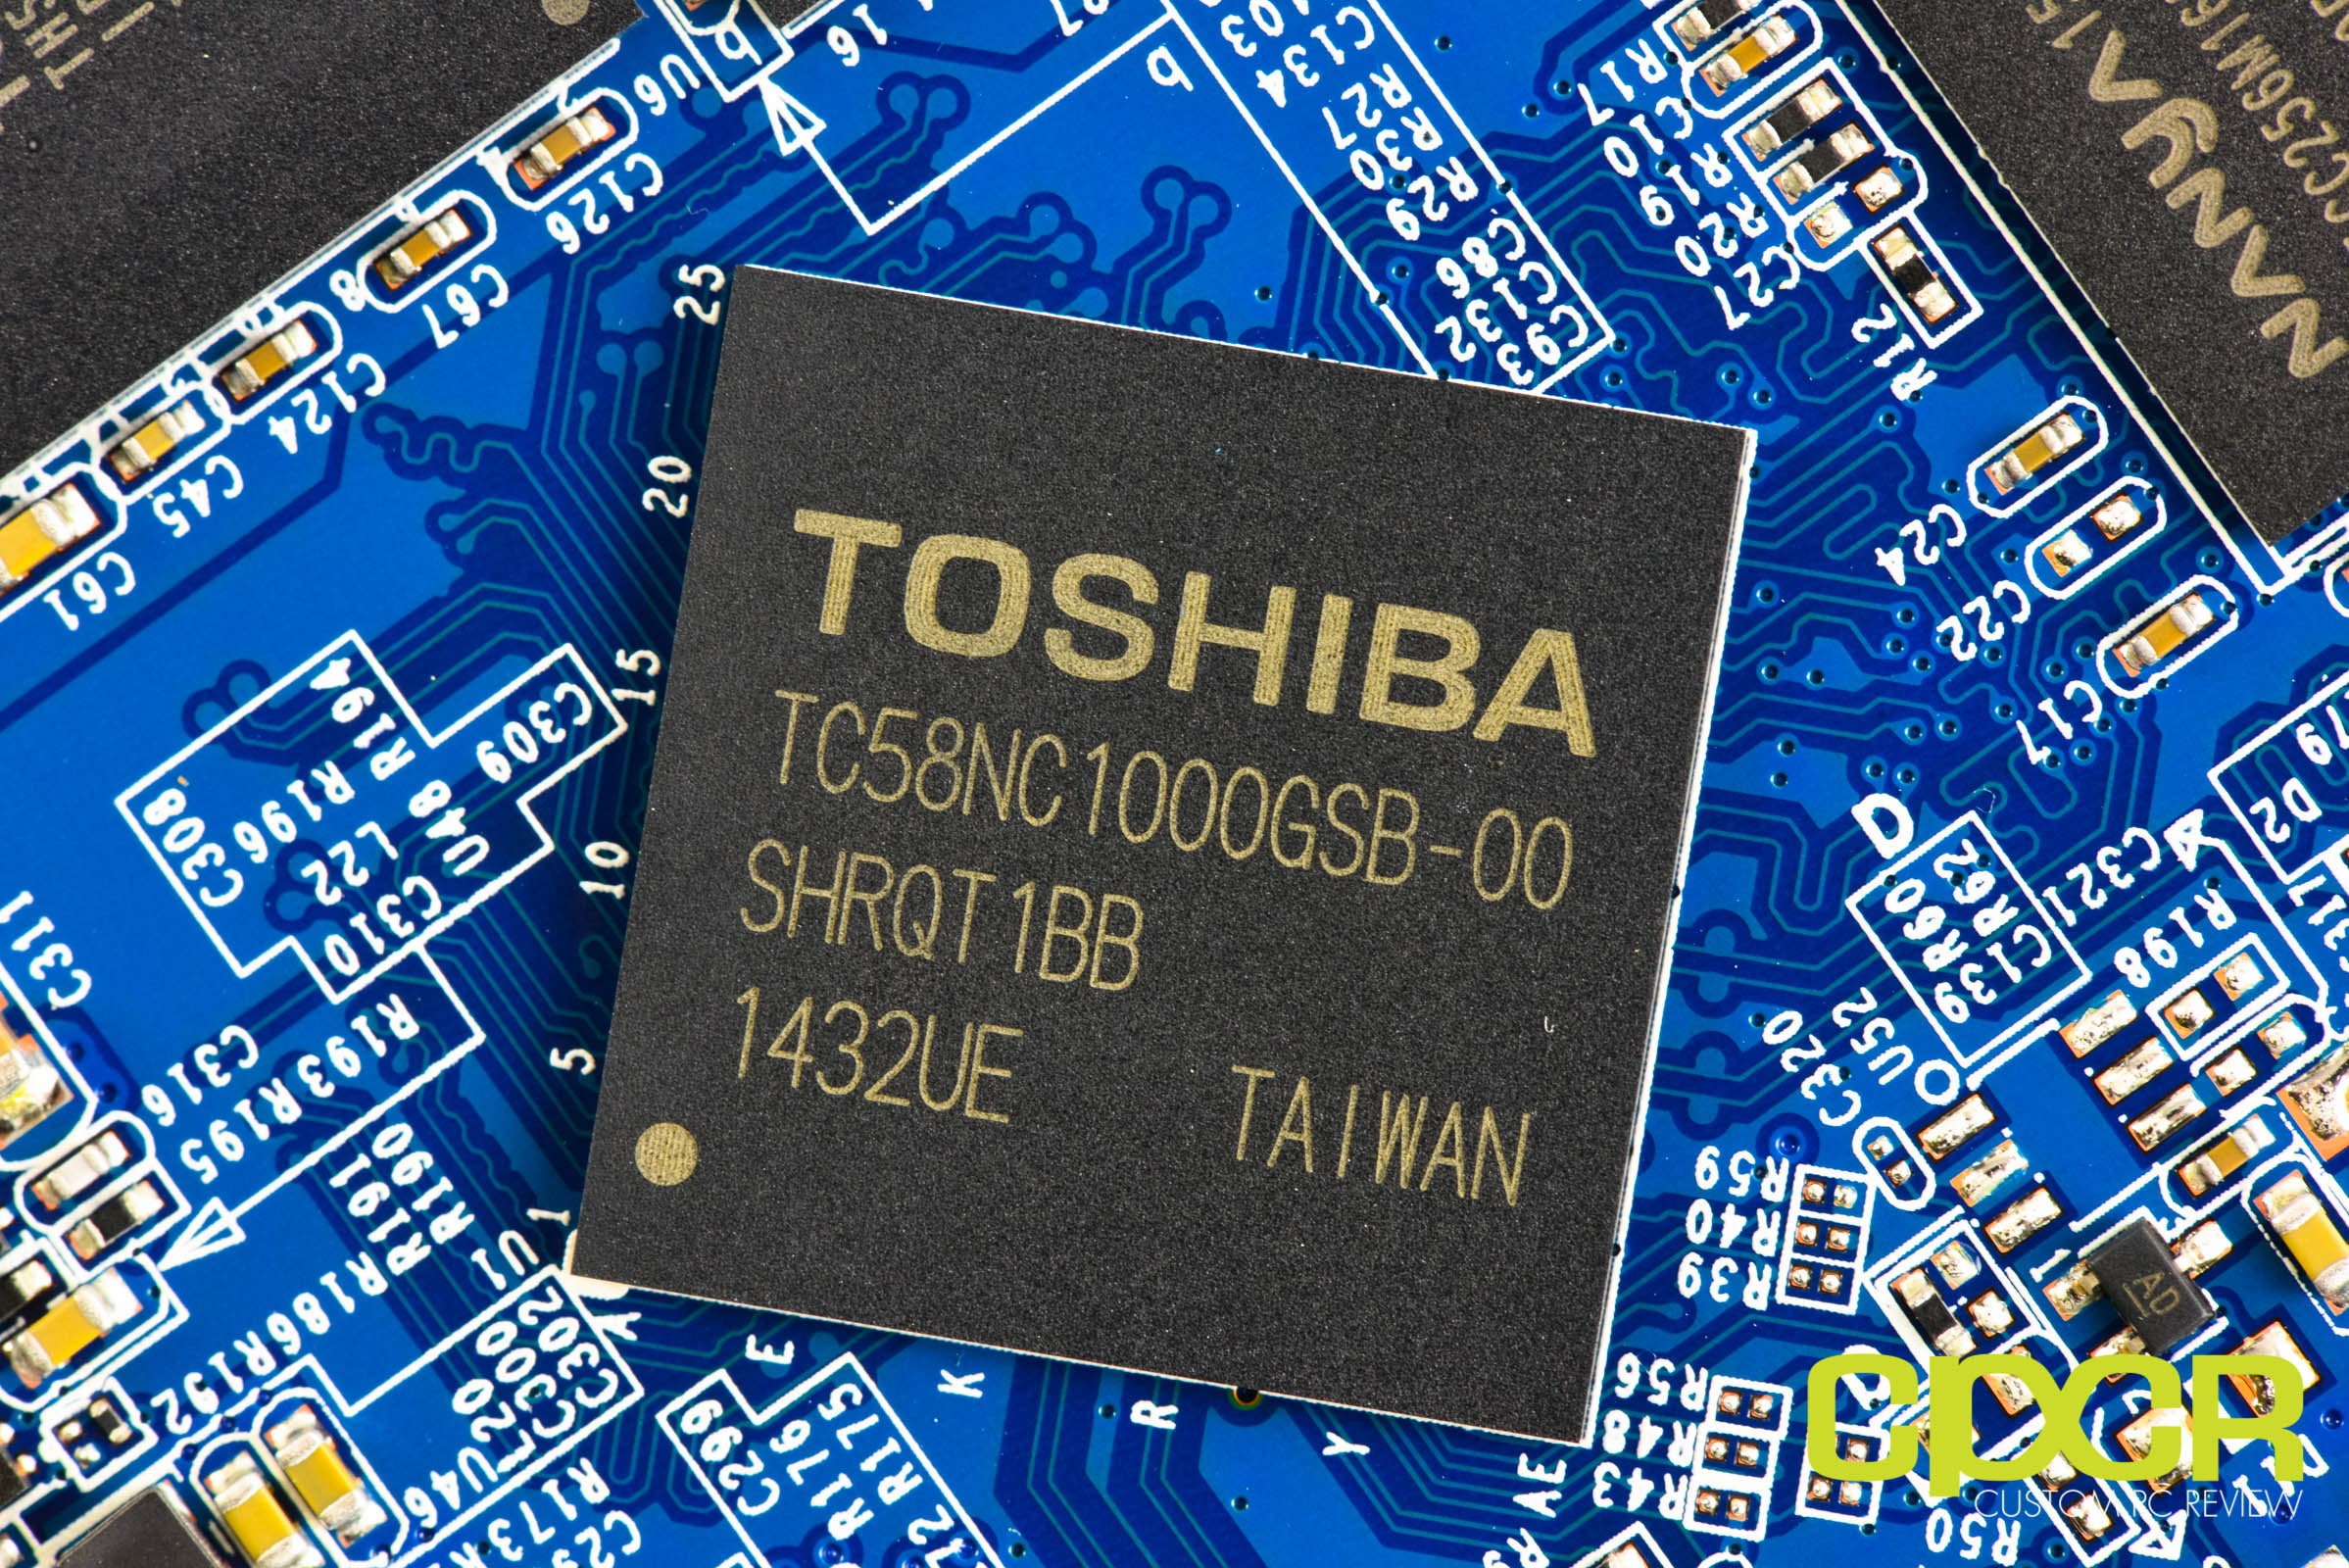
The controller on the OCZ Trion 100 is a Toshiba TC58 controller (Model #TC58NC1000GSB-00). While we’d love to share more details about the controller, Toshiba and OCZ has provided no information at this time.
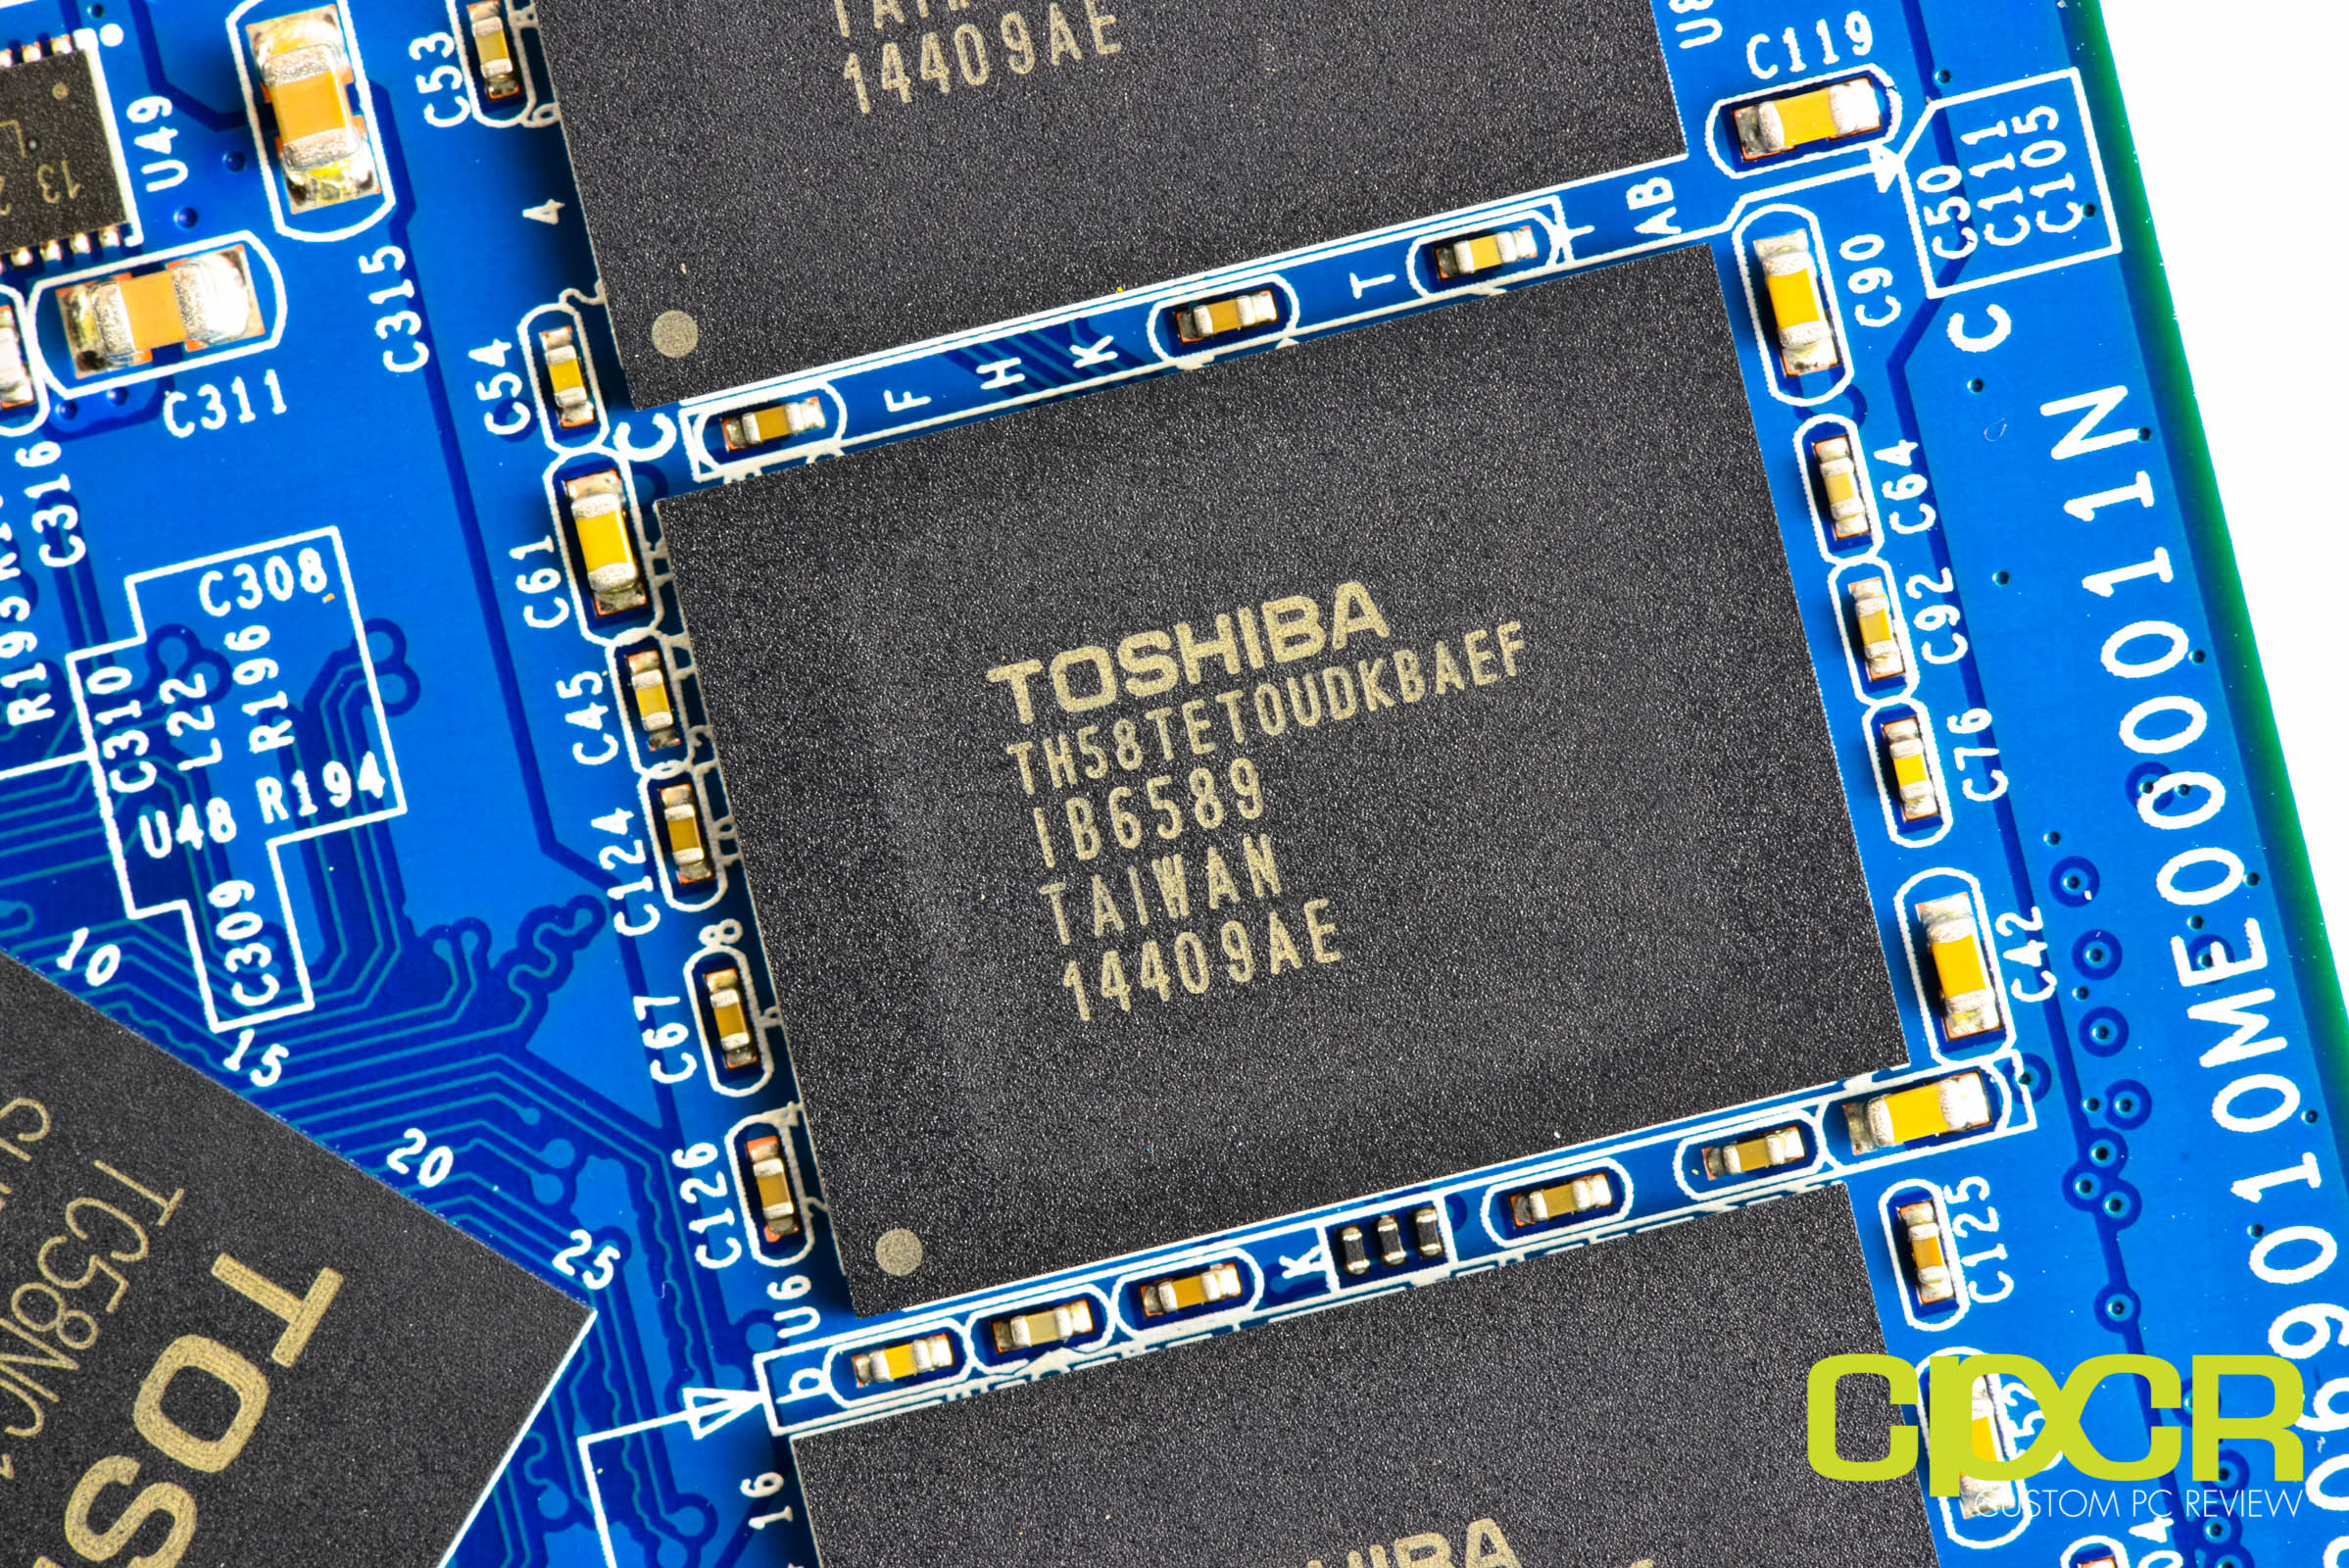
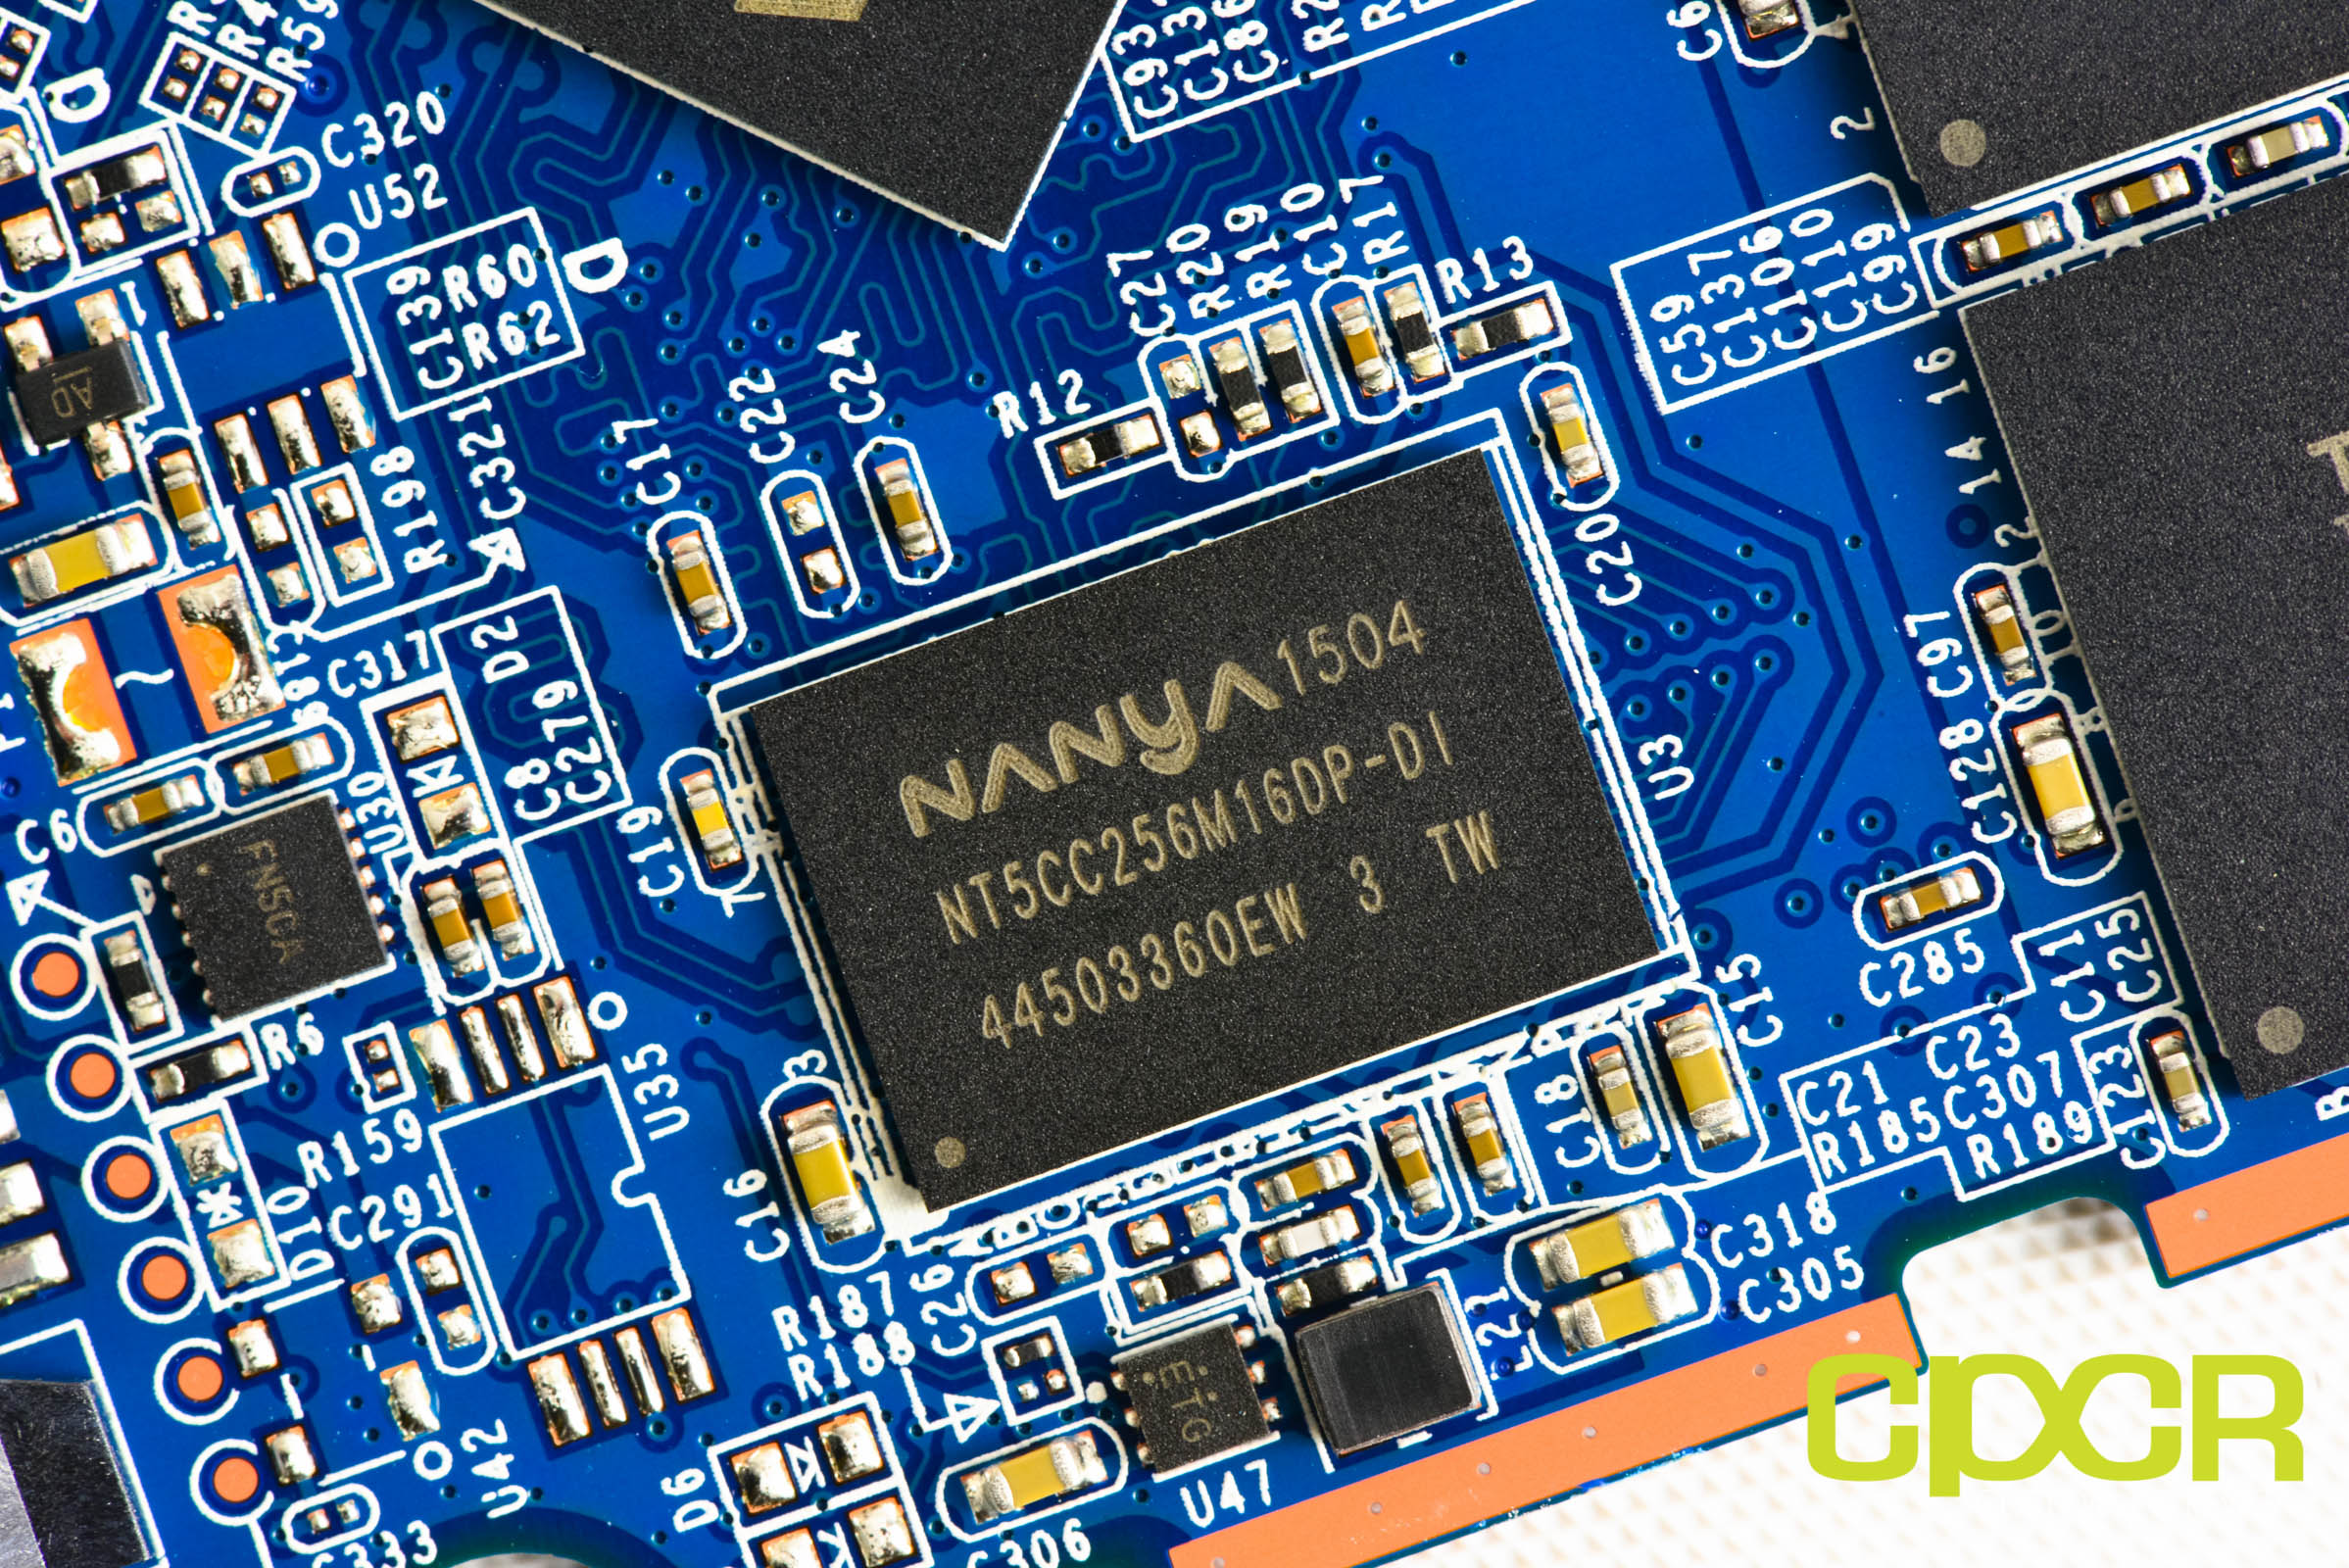
NAND onboard the OCZ Trion 100 is 128Gb Toshiba A19nm Toggle Mode TLC, which is the first time we’re seeing this NAND. There’s four NAND packages with 128GB NAND per package onboard for a total of 512GiB. There’s also a 512MB Nanya DDR3L DRAM buffer onboard.
[section label=3. Testing Setup, Drive Info, Software]
Testing Setup
| System | CyberPowerPC Gamer Xtreme 4200 |
|---|---|
| CPU | Intel Core i7-4770K |
| Motherboard | ASUS Z87-A |
| Memory | Kingston HyperX Genesis 16GB DDR3 2133MHz |
| Graphics | Intel HD4600 Graphics |
| Storage | OCZ Vertex 4 256GB |
| Power Supply | Corsair HX650 |
| Case | HSPC High Speed Tech Station |
| Optical Drive | ASUS OEM DVD Drive |
| Operating System | Windows 8.1 64 bit & CentOS 7 |
Special thanks to CyberPowerPC, Kingston, OCZ Storage Solutions and HSPC for sponsoring our test bench!
Crystal Disk Info
OCZ Trion 100 480GB
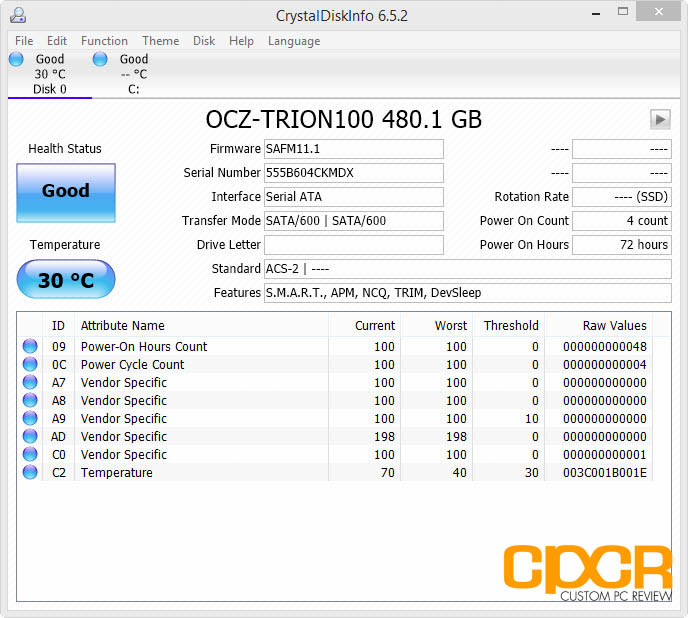
The firmware on our OCZ Trion 100 480GB SSD is SAFM11.1.
Curiously, a similar firmware naming convention was used in two of the drives we reviewed recently, the Kingston HyperX Savage and the Patriot Ignite. The Phison S10 powered HyperX Savage had firmware version SAFM00.r while the Phison S10 powered Patriot Ignite had firmware SAFM01.3. As such it’s very likely that the Phison S10 and Toshiba TC58 may in fact be the same controller.
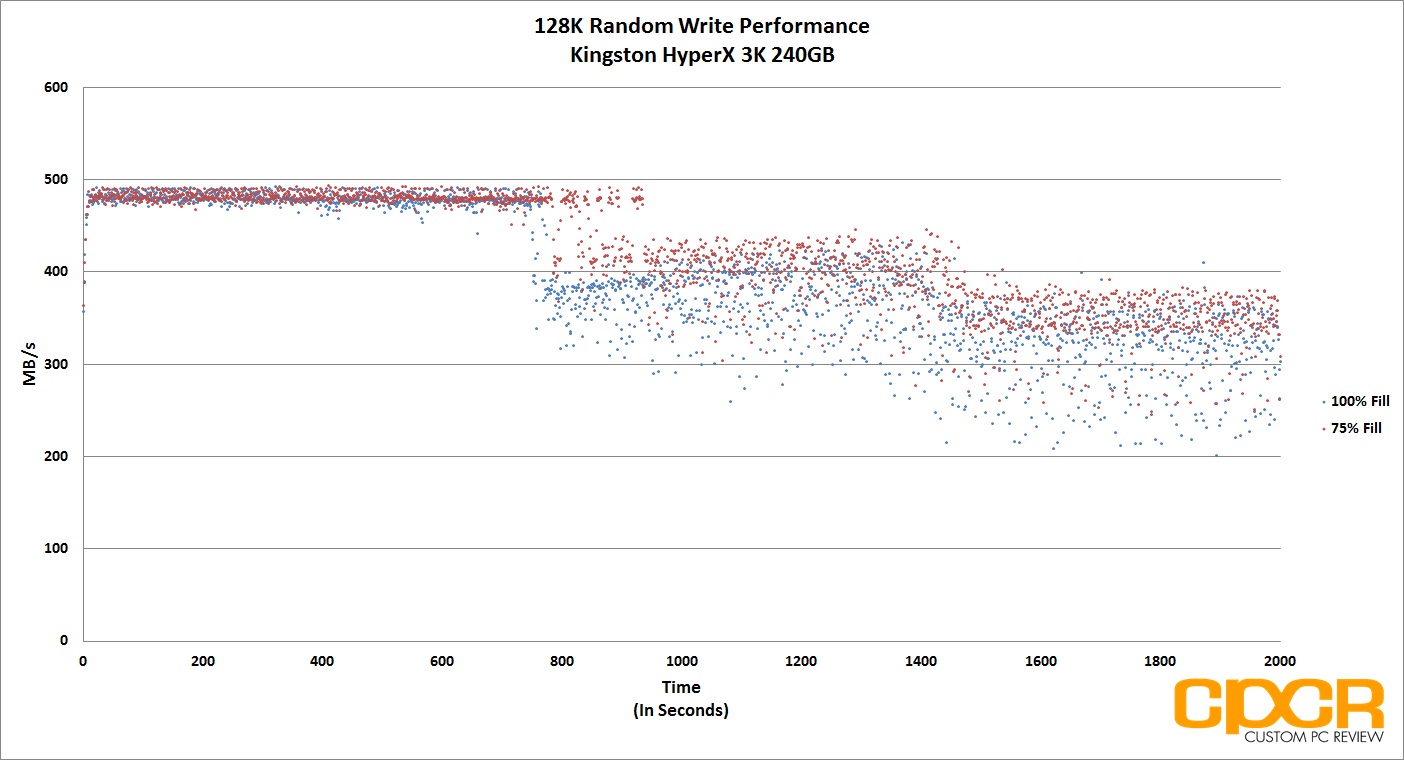
pSLC Cache
One of the problems with using TLC NAND is that it has substantially slower write performance compared to the much more common MLC NAND. As such, most TLC SSD makers use a pSLC (Pseudo SLC) caches in order to mask the slower write performance of the drives.
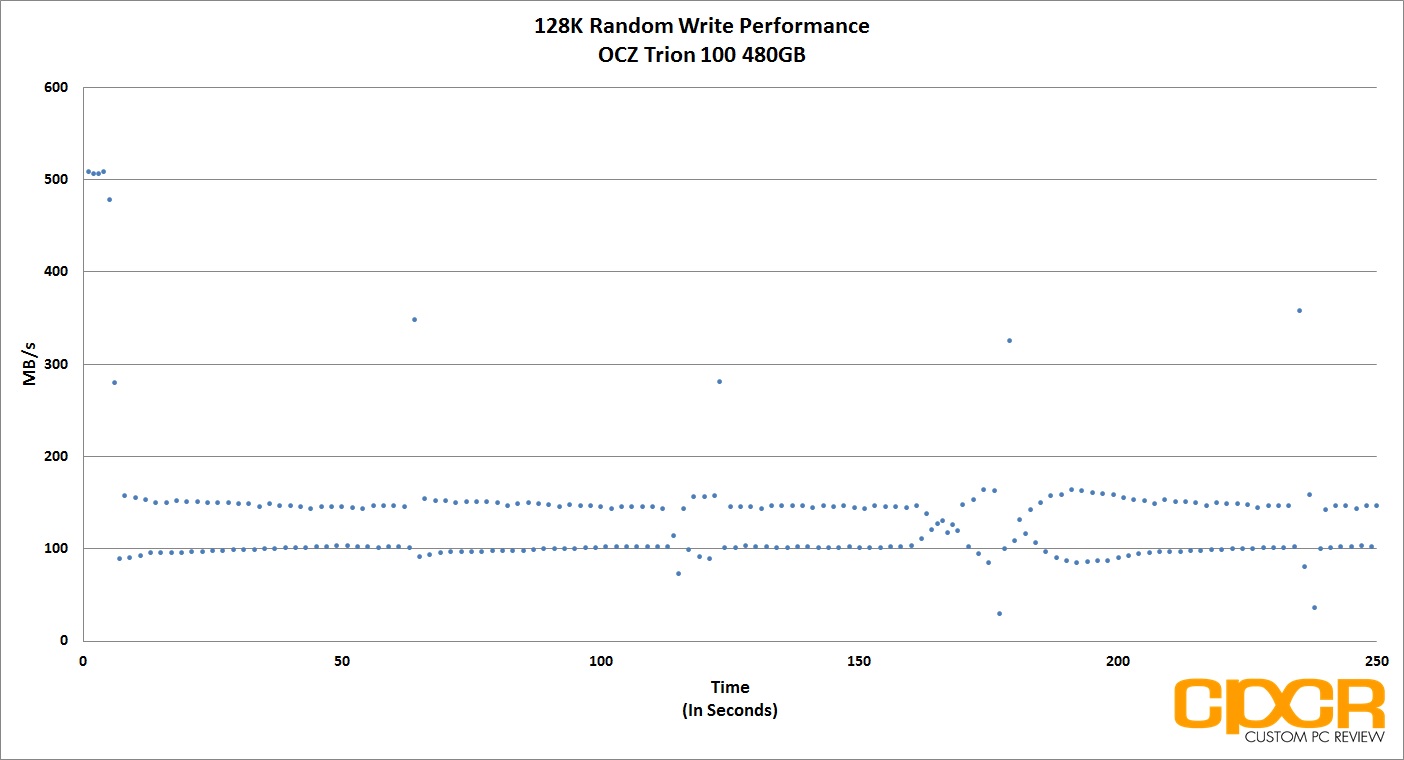
In order to test for this, we ran a trace on 128K random writes without preconditioning the drive. Here we can see that the drive is capable of up to 510MB/s sequential write speeds for a couple seconds as data hits the pSLC cache prior to hitting the TLC NAND. Once the data hits TLC NAND, performance slows down substantially. While OCZ didn’t reveal the exact pSLC cache size on the Trion 100, we’re guessing it’s somewhere between 6-9GB.
[section label=4. ATTO Disk Benchmark / AS SSD / Crystal Disk Mark]
OCZ Trion 100 480GB Performance
ATTO Disk Benchmark v2.46
ATTO Disk Benchmark is one of the industry’s oldest and most popular benchmarks for testing disk read/write speeds. This benchmarks allows read and write testing using predefined block sizes and gives us a good idea of read/write speeds with different sized files. Most SSD manufacturers prefer using this benchmark when advertising SSDs as it tests using compressible data, which tends to yield best performance.
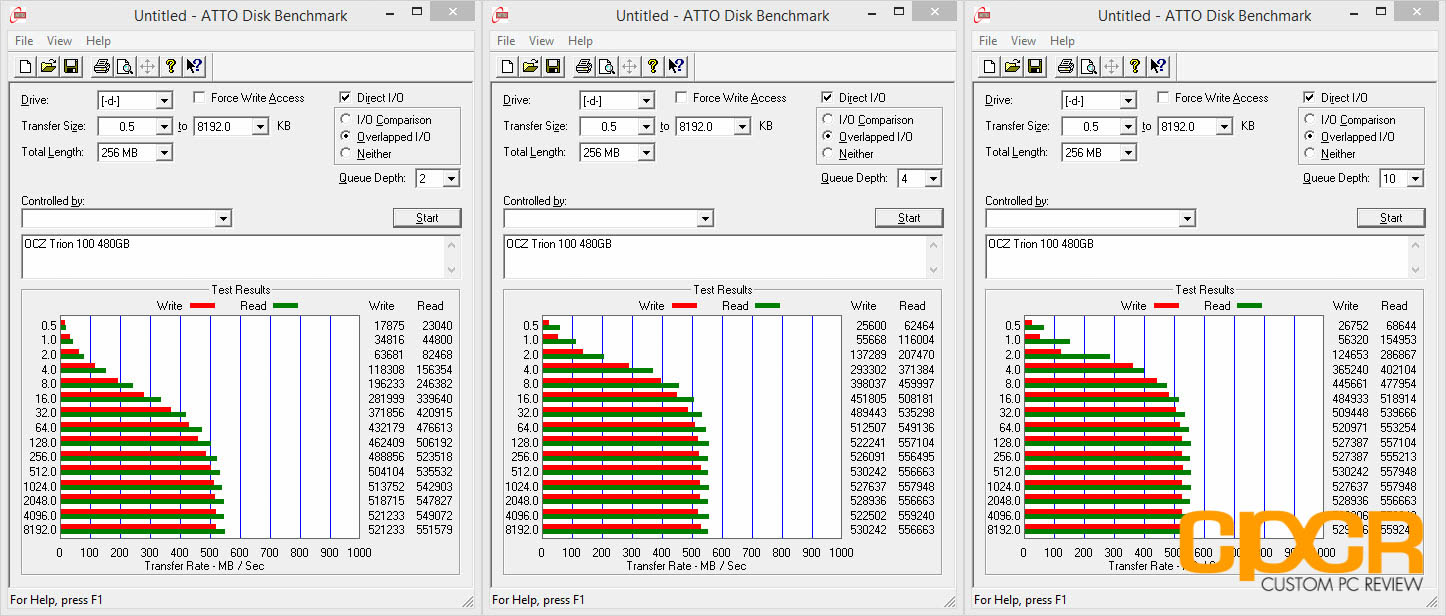
Performance Analysis
In ATTO Disk Benchmark, performance from the Trion 100 is quite impressive. It was able to reach 559MB/s sequential reads and 530MB/s sequential writes, which is basically the limits of the SATA 6Gb/s interface.
AS SSD Benchmark
AS SSD is a very commonly used benchmark used to measure SSD performance in sequential, 4K, 4K QD64 and latency. Tests are run using 100% incompressible data. AS SSD also outputs a final score at the conclusion of the test based off the overall performance of the drive.
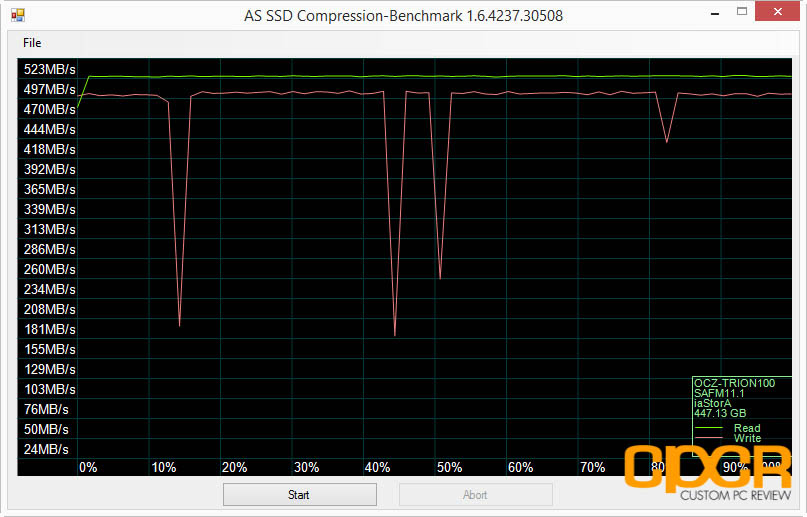
Additionally, we also run AS SSD’s included compression benchmark which tests the drive using data of varying compressibility. Some SSDs such as SandForce based SSDs tend to perform significantly better when the data is compressible.
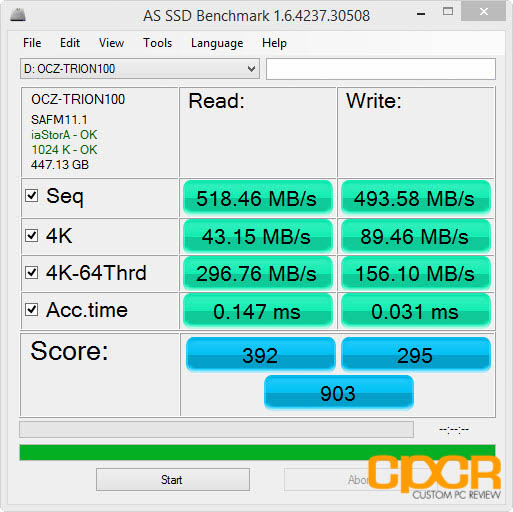
Performance Analysis
AS SSD performance is fairly decent as well. 4K random writes and 4K QD64 performance however does seem slightly slower than what I’d typically expect from a modern MLC NAND based SSD.
Crystal Disk Mark 3.0.1 x64
Crystal Disk Mark is another popular benchmark which allows us to measure both sequential read/write speeds as well as random read/write speeds. With this benchmark, tests can be run using both random fill (incompressible data) and 0 fill (compressible data). Realistically in typical computer usage scenarios, data being transferred will consist of a mixture of both incompressible and compressible data.
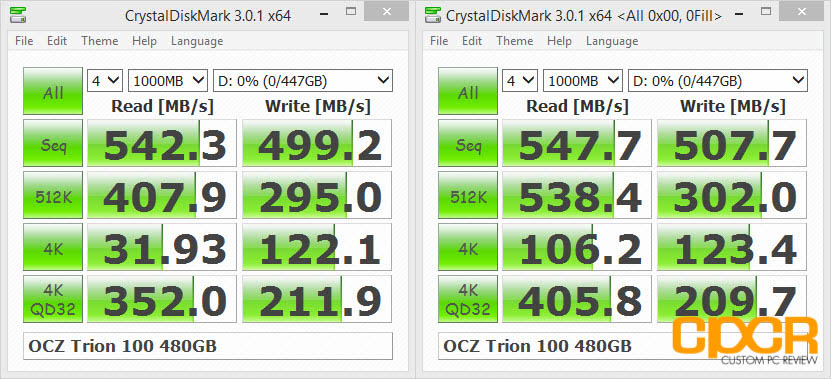
Performance Analysis
Performance in Crystal Disk Mark look decent for a entry level SSD, especially in reader performance. Write performance however is again slightly slower than what you’d expect from a MLC SSD.
[section label=5. PC Mark 7 / PC Mark 8]
OCZ Trion 100 480GB Performance
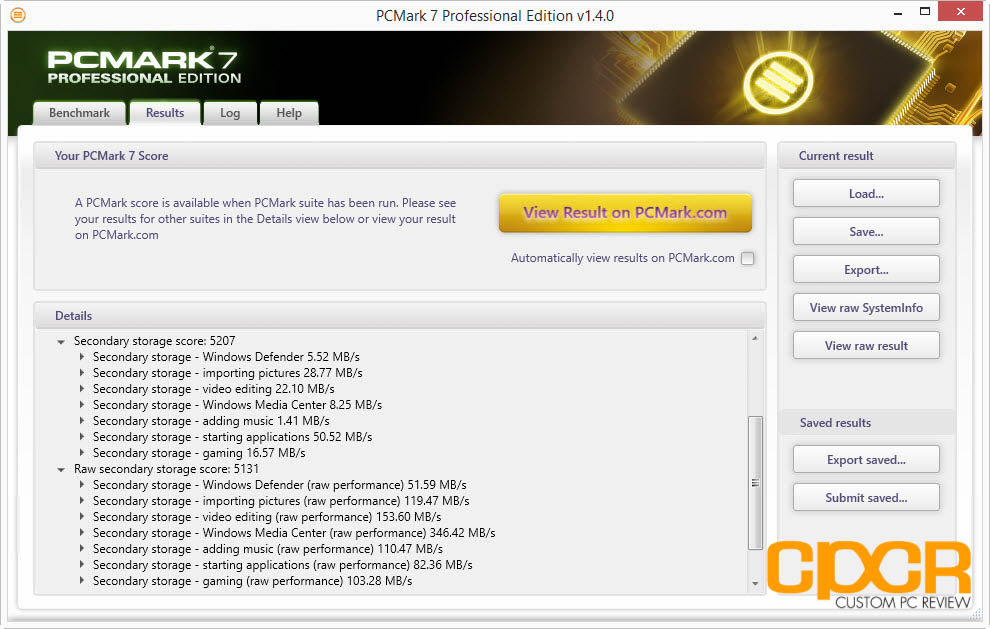
PC Mark 7 Storage Benchmark
The PC Mark 7 storage benchmark is a trace based benchmark that evaluates the SSD under many different real world environments such as gaming, multimedia editing, etc. PC Mark 7 uses a relatively light workload, which represents a typical mainstream client storage sub-system workload.
As of June 2015, we’ve also changed our comparison charts to use the PC Mark 7 Raw Secondary Storage Score. The raw score more effectively highlights performance differences between drives as it discounts idle time between tests.
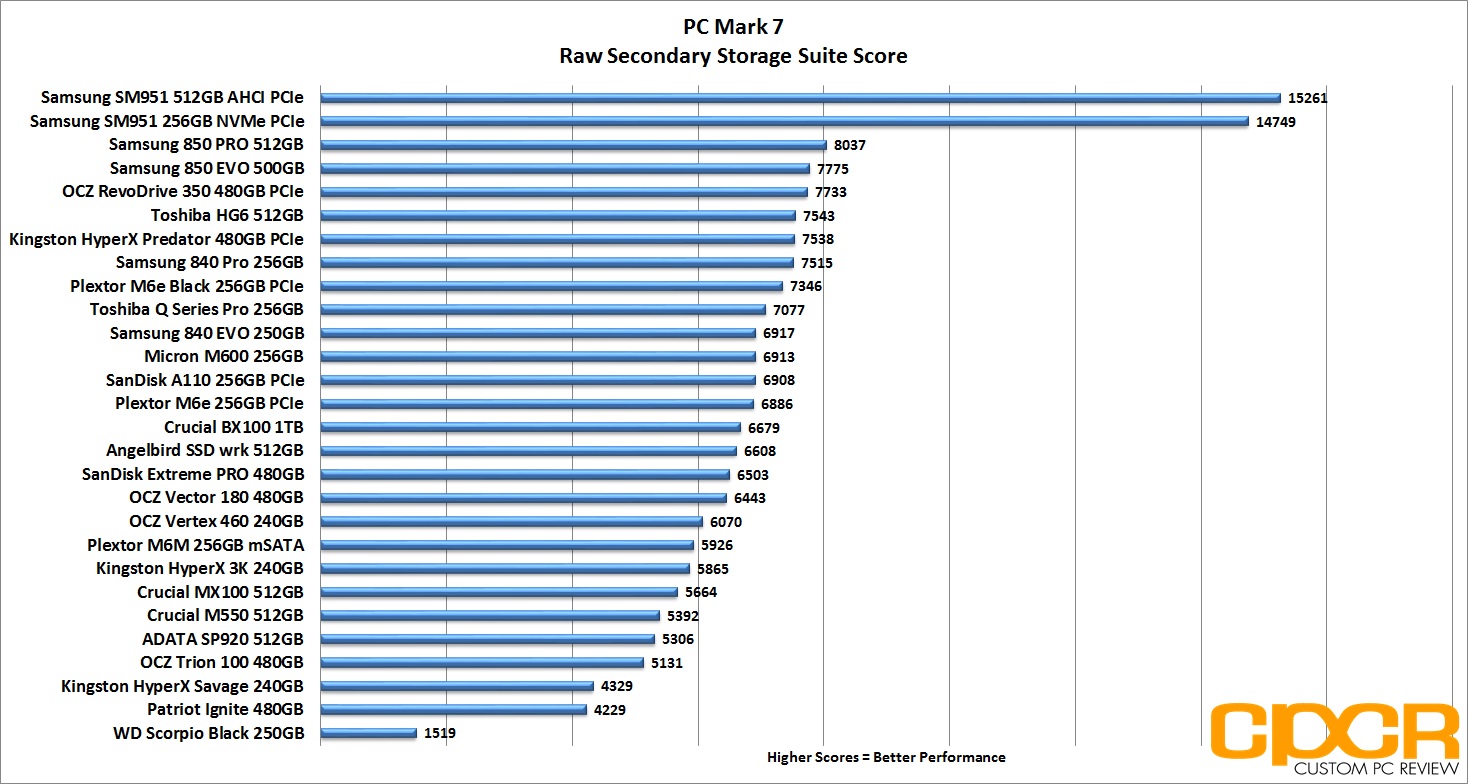
Performance Analysis
In PC Mark 7, the OCZ Trion 100 480GB doesn’t compete very well, coming in right at the bottom of our charts. Again, this isn’t too surprising for an entry level product.
PC Mark 8 Expanded Storage Benchmark
With the introduction of PC Mark 8 2.0.228, Futuremark added the option for an Expanded Storage Benchmark which is literally designed to bring any storage system its absolute limits. The new PC Mark 8 Expanded Storage Benchmark takes around 24 hours to run and for our purposes, we’ll be using the consistency test which measures performance consistency, degradation tendency, and recovery speed of a storage system.
Consistency Test
Full details on the consistency test can be found in the PC Mark 8 Technical Guide here. For the more simplified version, the test is basically a near 24 hour, five phase benchmark – three of which we’ll be reporting on in our results below.
- Phase 1 is a precondition phase designed to “dirty” the drive with random data. The entire drive is filled twice to the capacity of the drive.
- Phase 2 is a degrade phase where the drive is hammered with tons of random data followed by a performance test run. This is done 8 times.
- Phase 3 is the steady state phase where the drive is once again hammered with tons of random data followed by a performance test run. This is done 5 times.
- Phase 4 is the recovery phase where the drive is given 5 minutes to rest followed by a performance test run. This is done 5 times.
- Phase 5 is the clean up phase where the drive is simply secure erased.
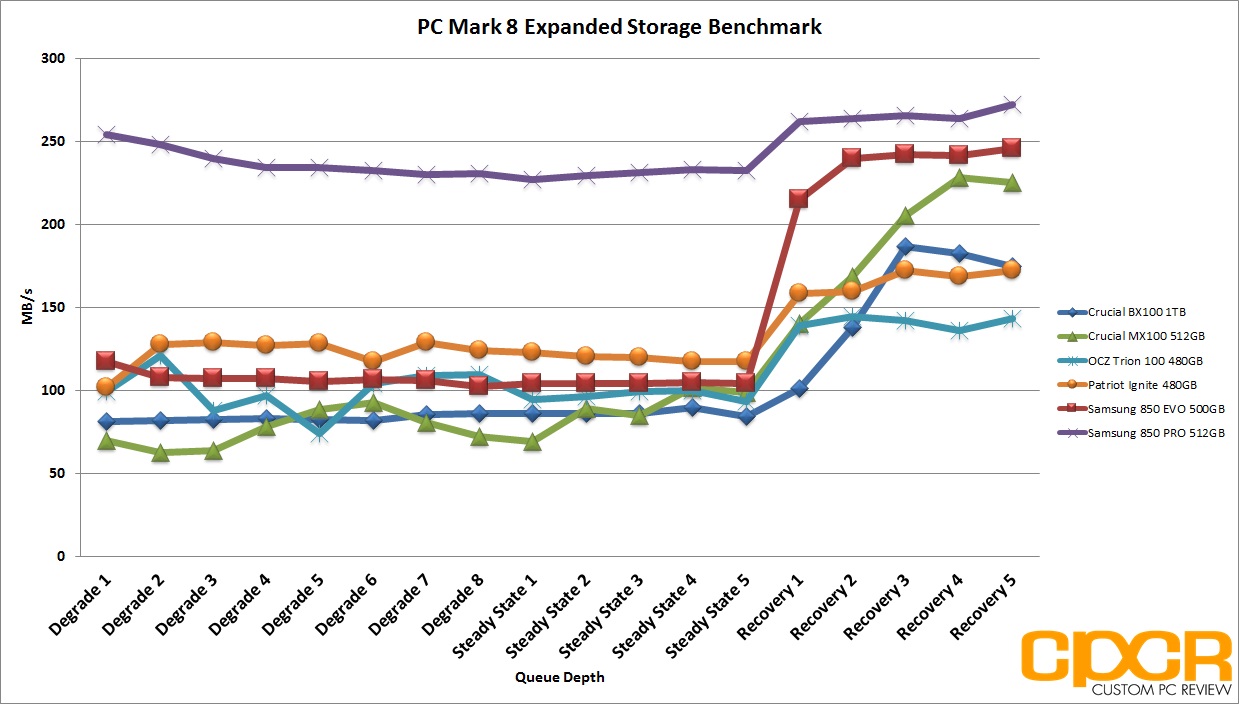
Performance Analysis
In the significantly heavier PC Mark 8 Expanded Storage Benchmark workload, the OCZ Trion 100 performs relatively well against its competitors under heavy load however, it doesn’t seem to be able to compete as well during lighter workloads. For example, compared to the Crucial MX100 or BX100 the OCZ Trion 100 is very competitive in the degrade and steady state phases, but is outpaced by the competition in the recovery phases.
[section label=6. FIO – FOB]
OCZ Trion 100 480GB Performance
FIO (Flexible I/O Tester)
FIO, which stands for Flexible I/O Tester, is basically what its name says – a flexible I/O tester / I/O workload generator. Whereas all the benchmarking tools we’ve used previously are fantastic, easy to use benchmarking tools that provide a good snapshot of SSD performance, they do lack a lot of versatility, especially for more complex and in-depth operations such as custom queue depths, block sizes, test run times, etc. While the testing that follows may not pertain to typical consumer usage, they do help give us a much more in-depth look at each individual product’s strengths and weaknesses when they’re pushed to the limits.
FIO – FOB (Fresh Out of the Box) Testing
When SSDs are brand new and Fresh Out of the Box, they’re generally able to perform at or outperform their advertised speeds, but unlike traditional hard drives, performance on SSDs begin to degrade over time as they become more and more used. This is because while SSDs are new, all bits on the SSD are empty, so they can instantly be programmed with data. However, once data gets programmed in, even if it’s deleted in the filesystem the actual data will still stay programmed on the NAND itself unless some sort of garbage collection routine comes in to wipe the data. Unfortunately, in order to write new data onto “dirty” NAND, the NAND first needs to go through an erase cycle to erase the old data before a program cycle can happen to program new data, which as you may imagine takes more time than just a simple program cycle. As this only happens when writing new data onto the SSD, you’ll generally see less performance degradation on reads and more performance degradation on writes.
For our FOB testing, we run a secure erase on the SSD then run each test sans any preconditioning. This will provide us with the highest level of performance the SSD is capable of and is likely never to be seen ever again once the SSD goes into a used state.
Our testing will include 4K read testing, 4K write testing, and 4K 70/30 read/write mix testing at queue depths of 1,2,4,8,16,32,64,128,256. The reason we’ve also included 4K 70/30 read/write mix testing is simply because most real world workloads will always fall somewhere between 0% write and 100% write rather than one or the other. Since client usage is much more read heavy, we’ll be using the 70/30 read/write mix.
For general client usage, performance will fall somewhere between queue depths of 1-4 whereas servers and other enterprise applications will easily see queue depths of 32 or greater.
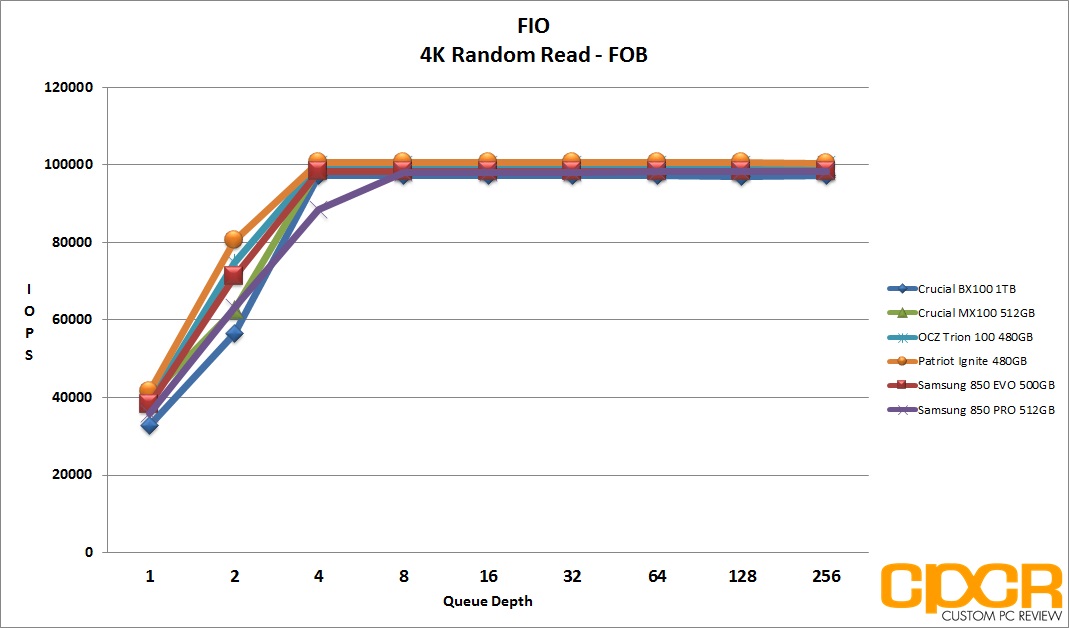
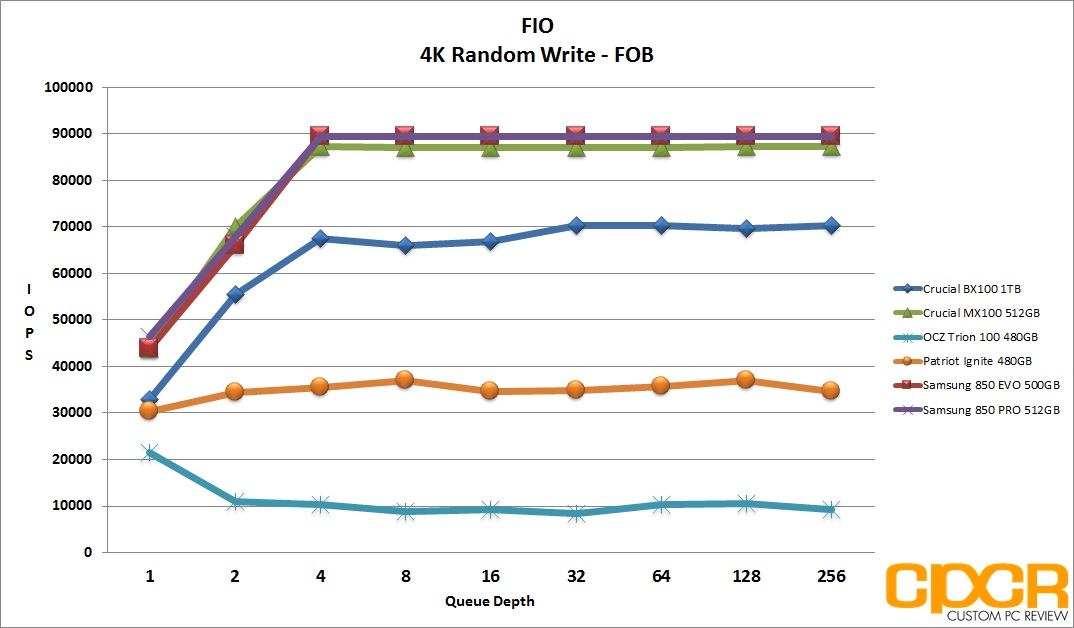
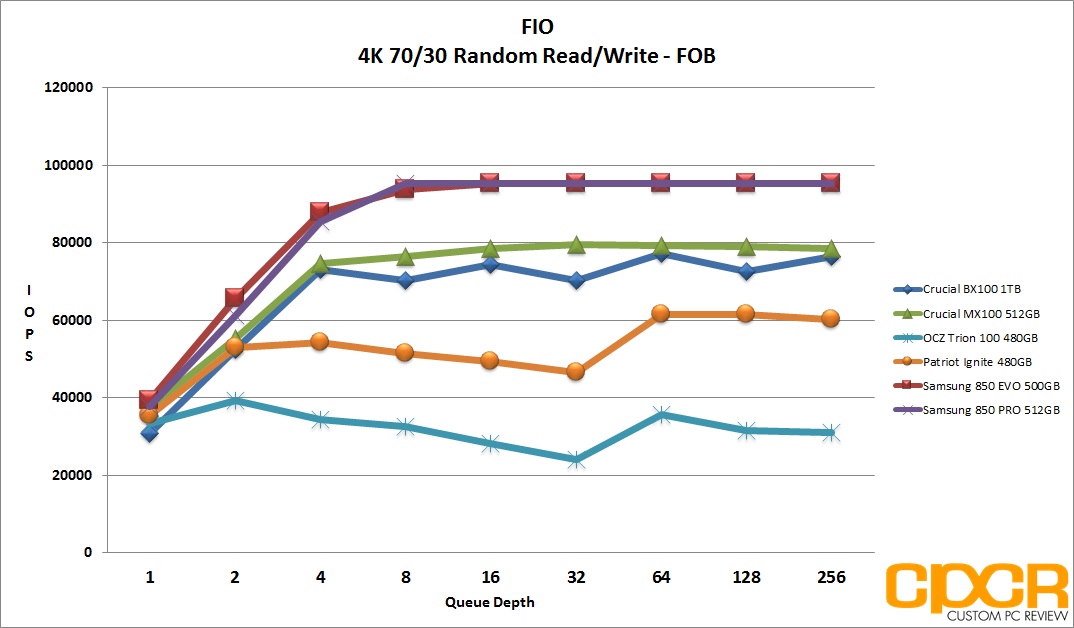
Performance Analysis
Fresh out of the box, 4k random read performance is very good moving quickly from an initial 40,000 IOPS at QD 1 to a respectable 100,000 IOPS by QD4. Unfortunately, performance isn’t so pretty when we start to look at random writes and mixed workloads.
[section label=7. FIO – Steady State]
OCZ Trion 100 480GB Performance
FIO – Steady State Testing
After prolonged use of an SSD, it will reach “steady state” where performance levels off to a minimum level. The FOB state is the “best case scenario” for SSD performance while “steady state” is going to be your worst. Here, we ran the exact same set of benchmarks we just completed in the FOB state; except this time around, we’ll be preconditioning the drive by filling 100% of the drive’s LBAs with two sequential passes of 128k data followed by hammering the drive for six hours with 4K random data prior to actual testing.
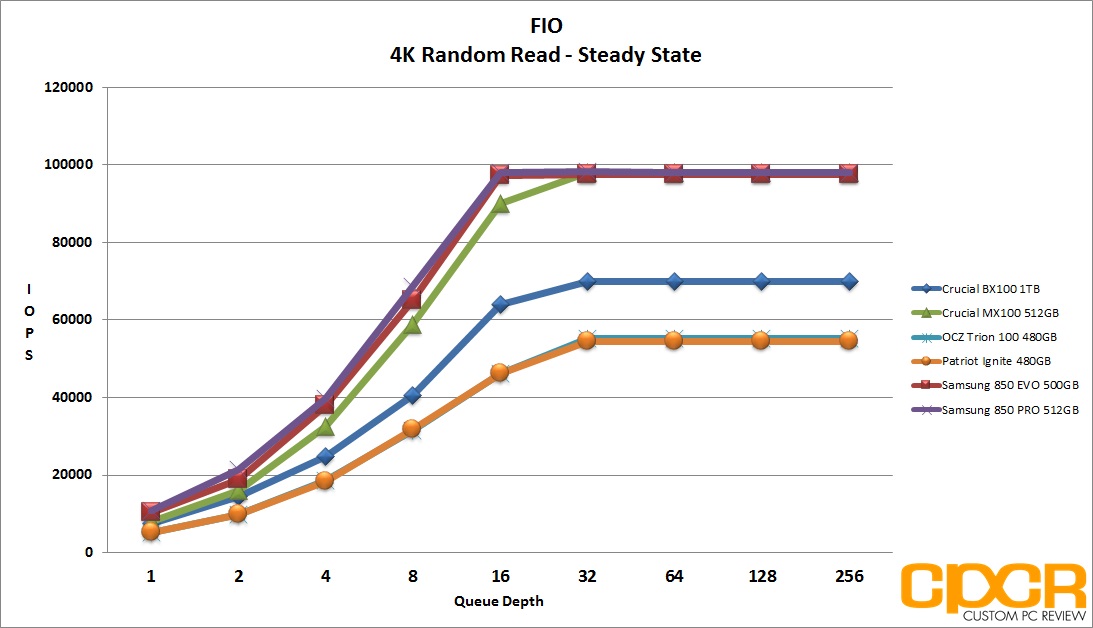
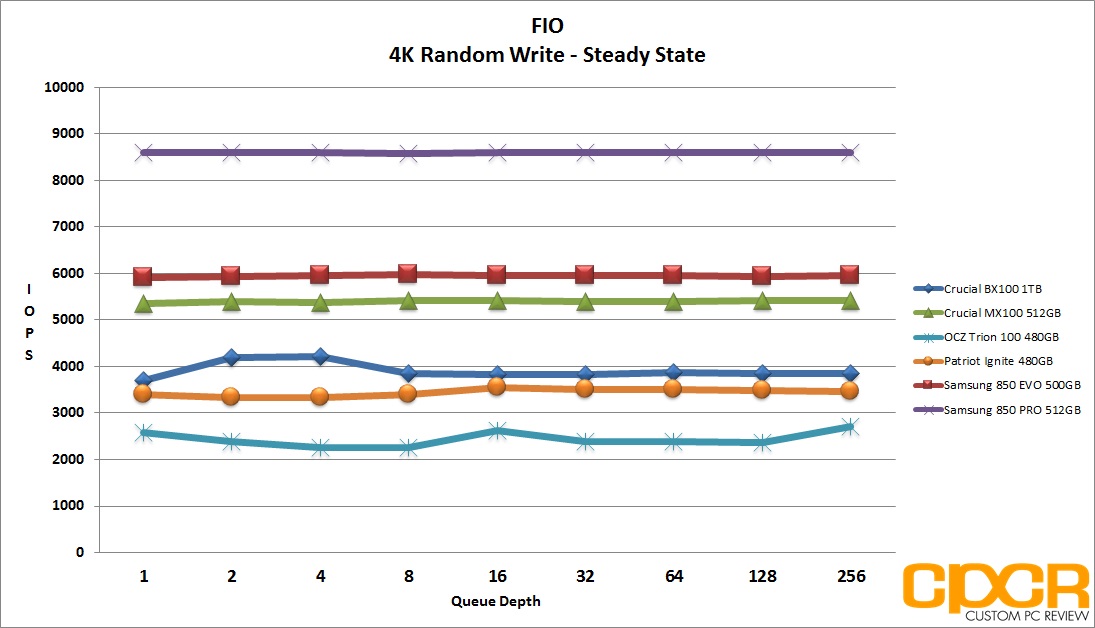
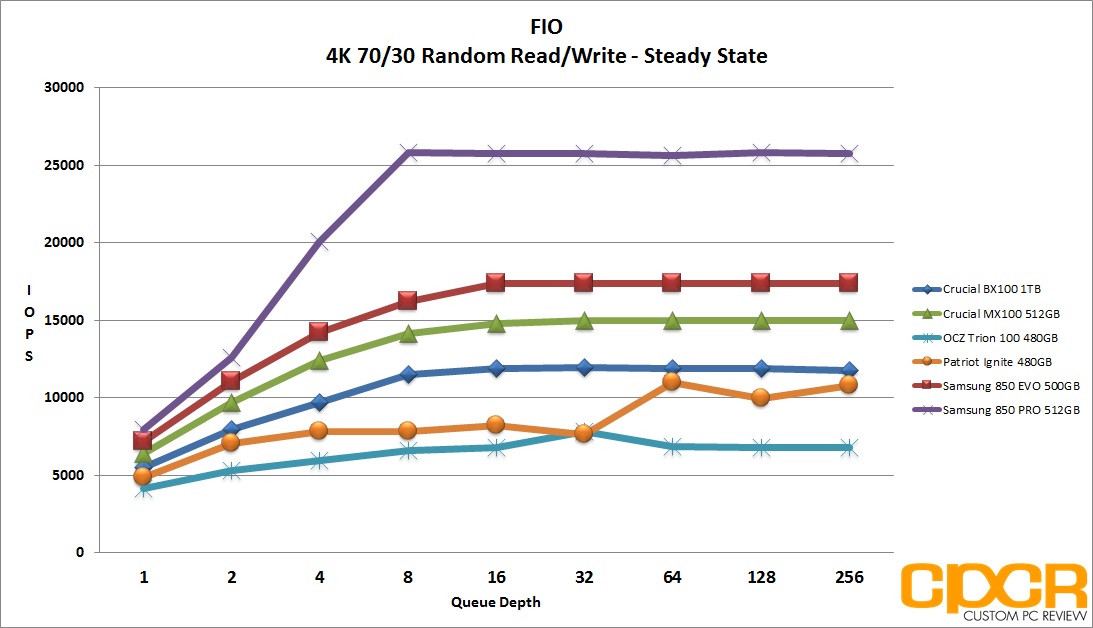
Performance Analysis
In steady state, the OCZ Trion 100 was able to mirror the asynchronous NAND powered Patriot Ignite in read performance. Unfortunately, it was dead last in that benchmark. Similarly, the Trion 100 came in last in both 4K random read performance and 4K mixed workload performance as well.
[section label=”8. FIO – 4K Random Write Consistency”]
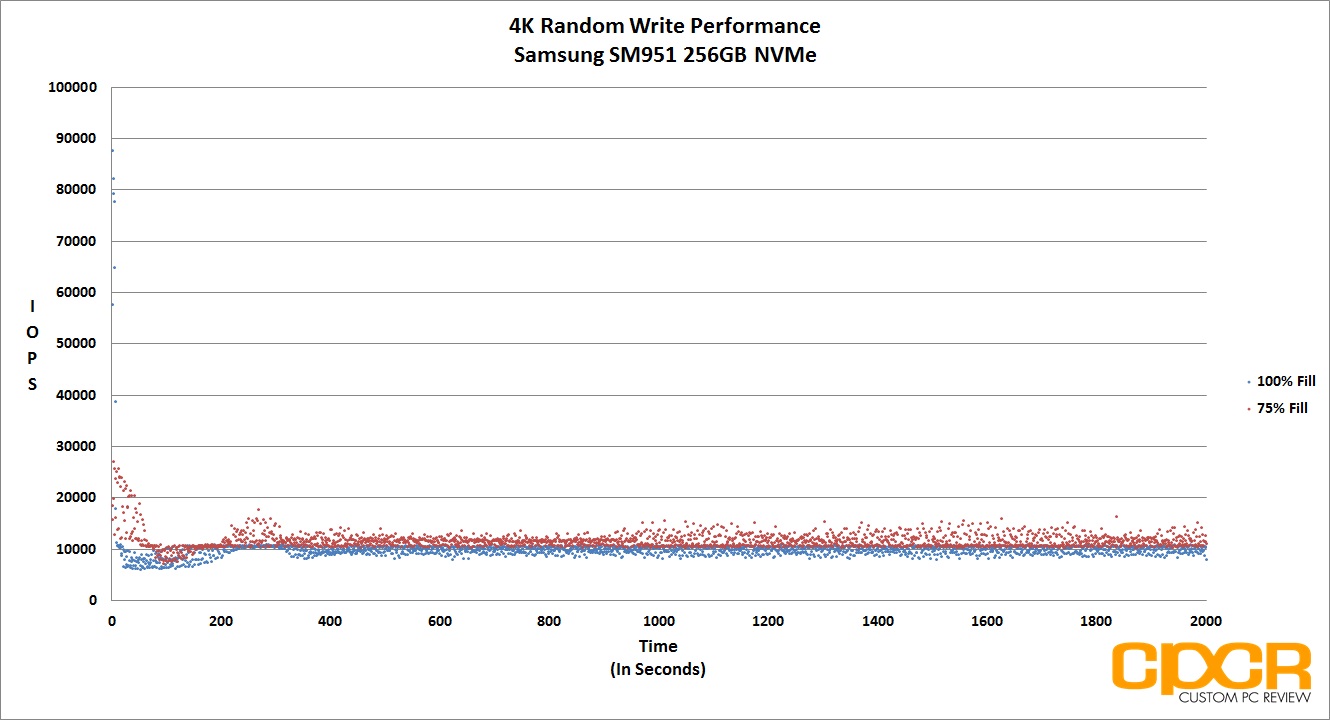
Samsung SM951 256GB NVMe Performance
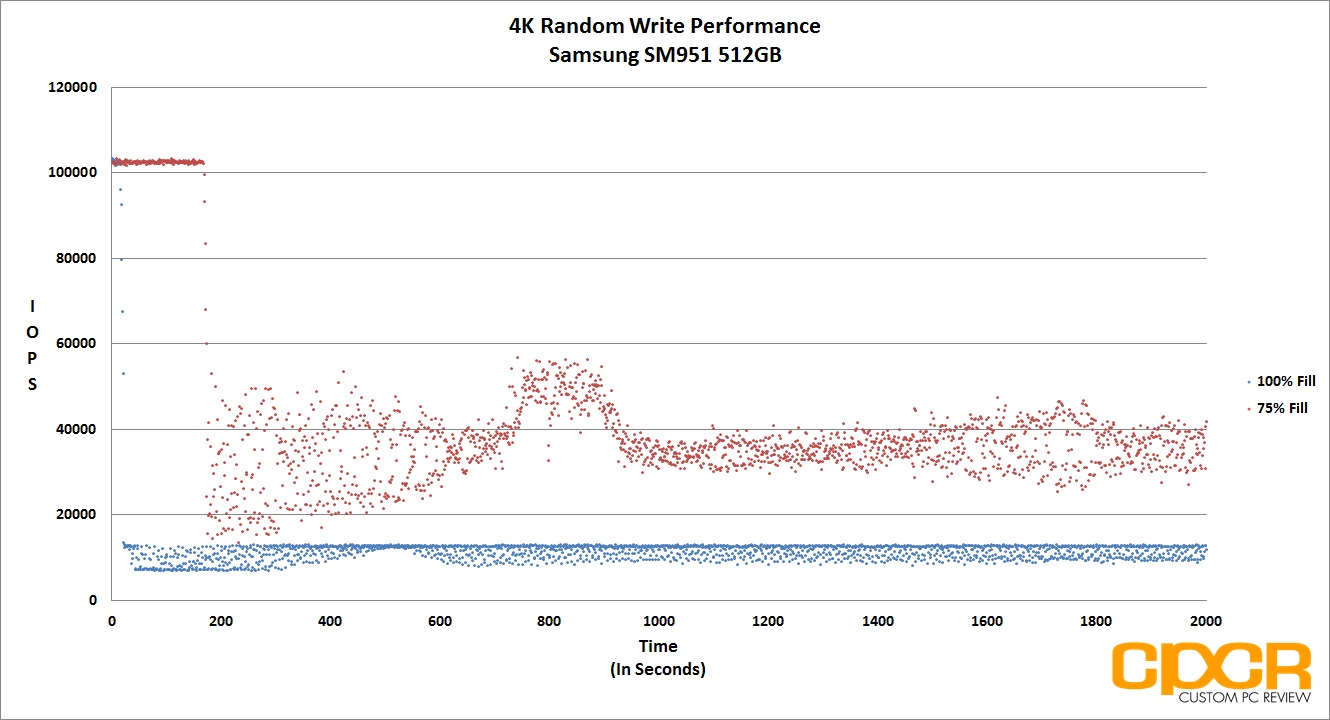
FIO 4K Random Write Consistency Testing
Another one of the benefits of testing with FIO is the flexibility of running consistency tests, which is one of the most important metrics when considering SSDs going forward. Looking at the results of our benchmarks such as ATTO Disk Benchmark and Crystal Disk Benchmark, we can see that practically every top tier SSD is capable of saturating SATA 6Gb/s in the FOB state. However, what really differentiates these SSDs is their ability to hold a certain level of performance even after extended periods of use.
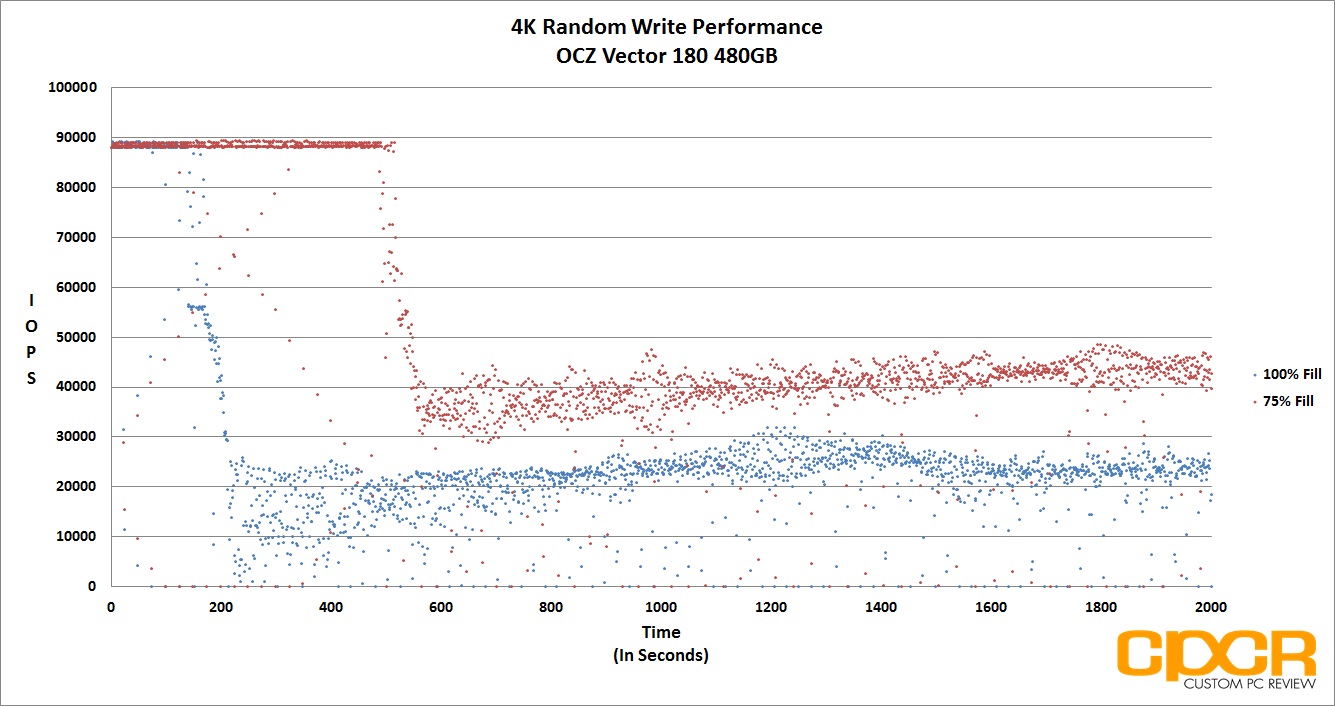
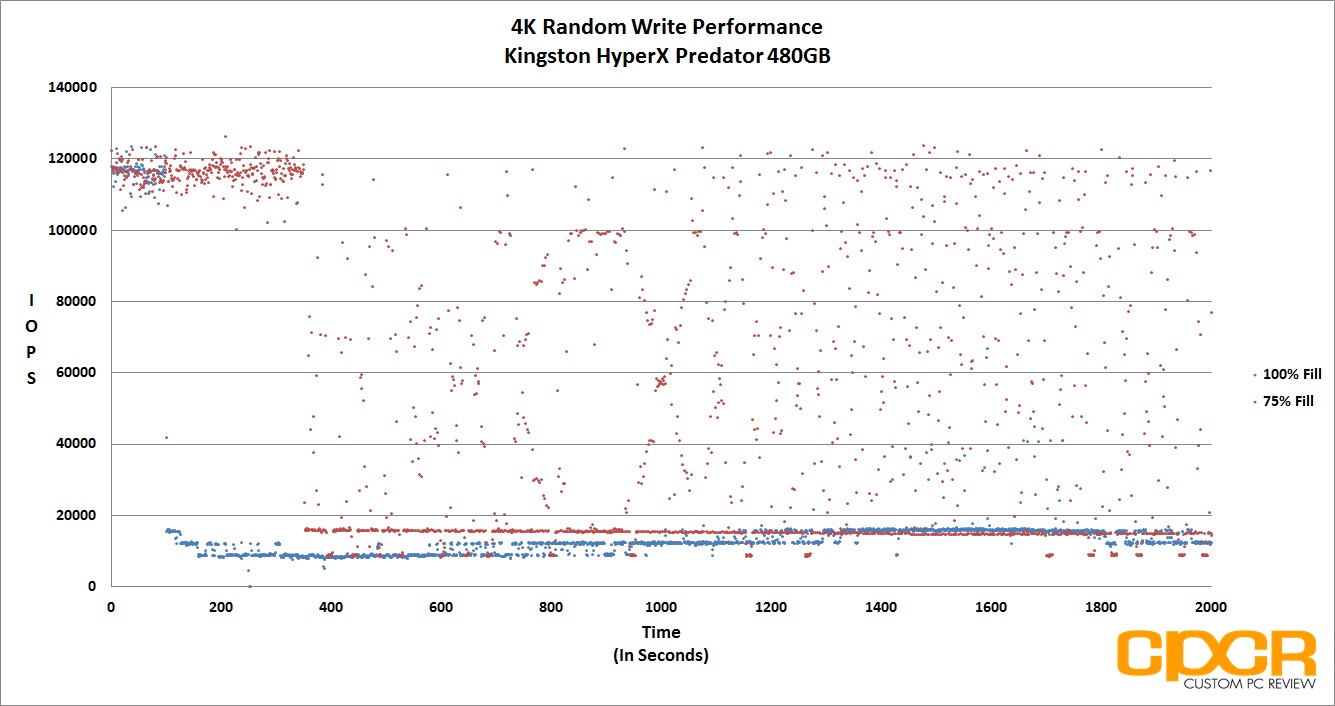
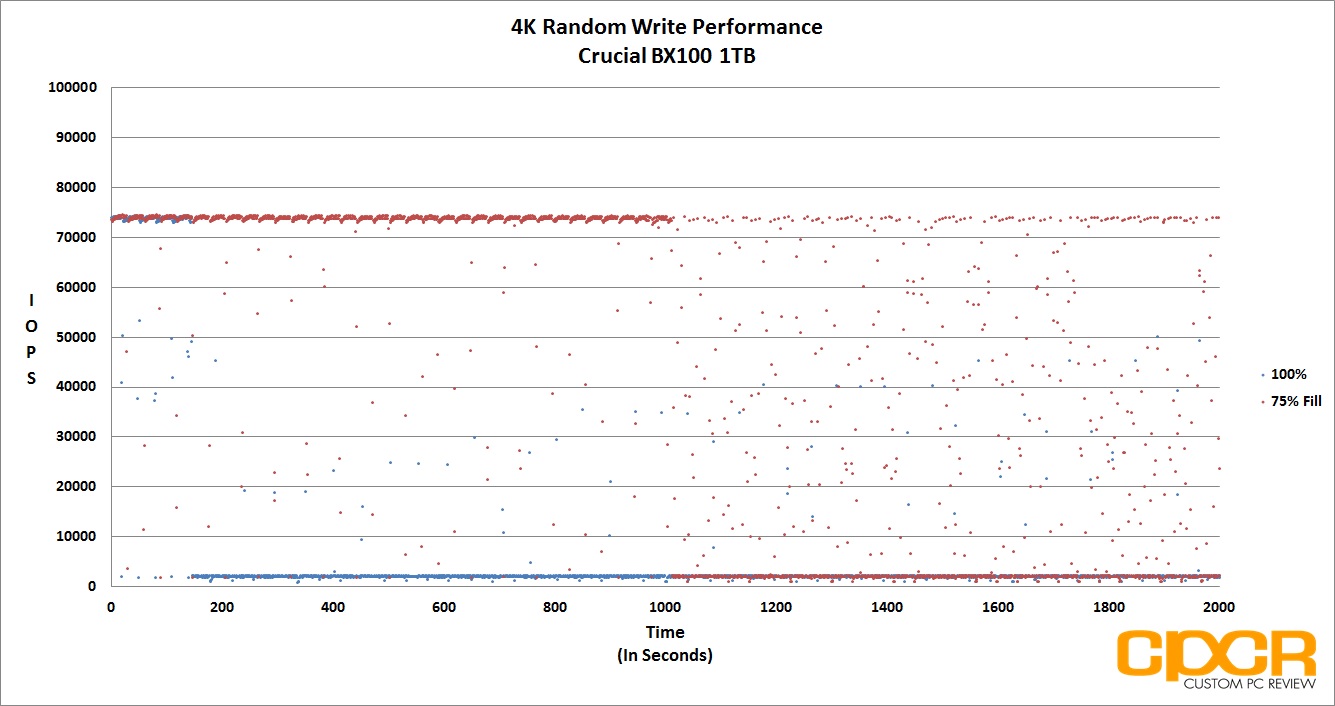
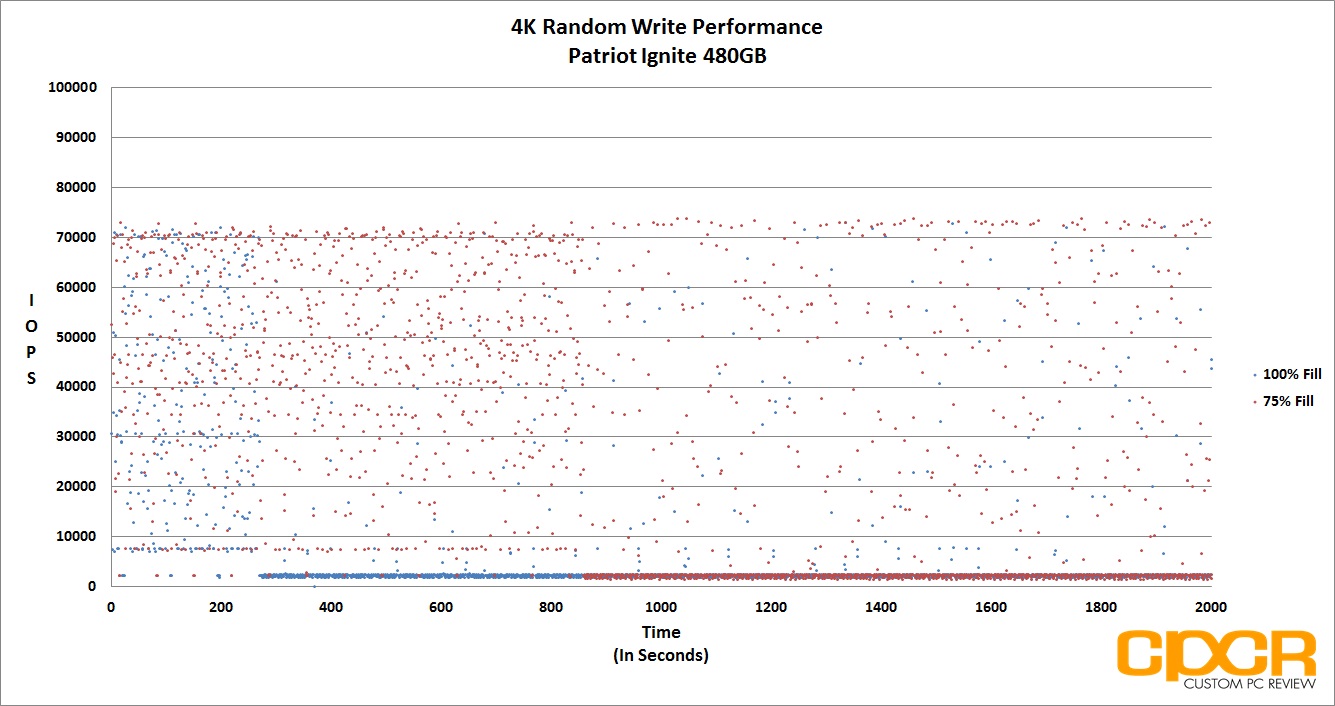
For our consistency testing, we used a fairly standard method, which includes both filling up 75% of capacity as well as 100% capacity twice with sequential 128k data followed by the actual test itself, which is simply running 4K random writes at a queue depth of 32. By recording the IOPS every second for 2,000 seconds, we’re able to get a good look at what kind of performance can be expected when the drive is relatively new, when it’s heading towards steady state, and when it’s actually in steady state.
[tabgroup]
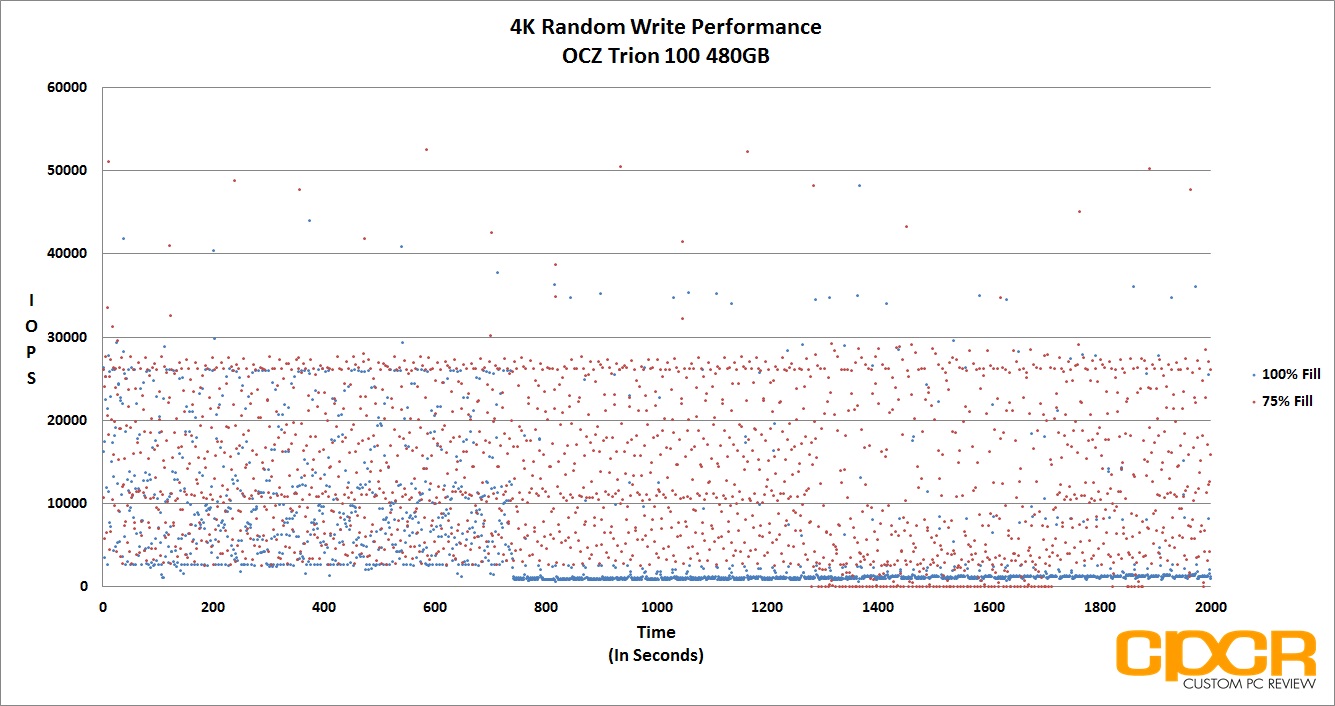
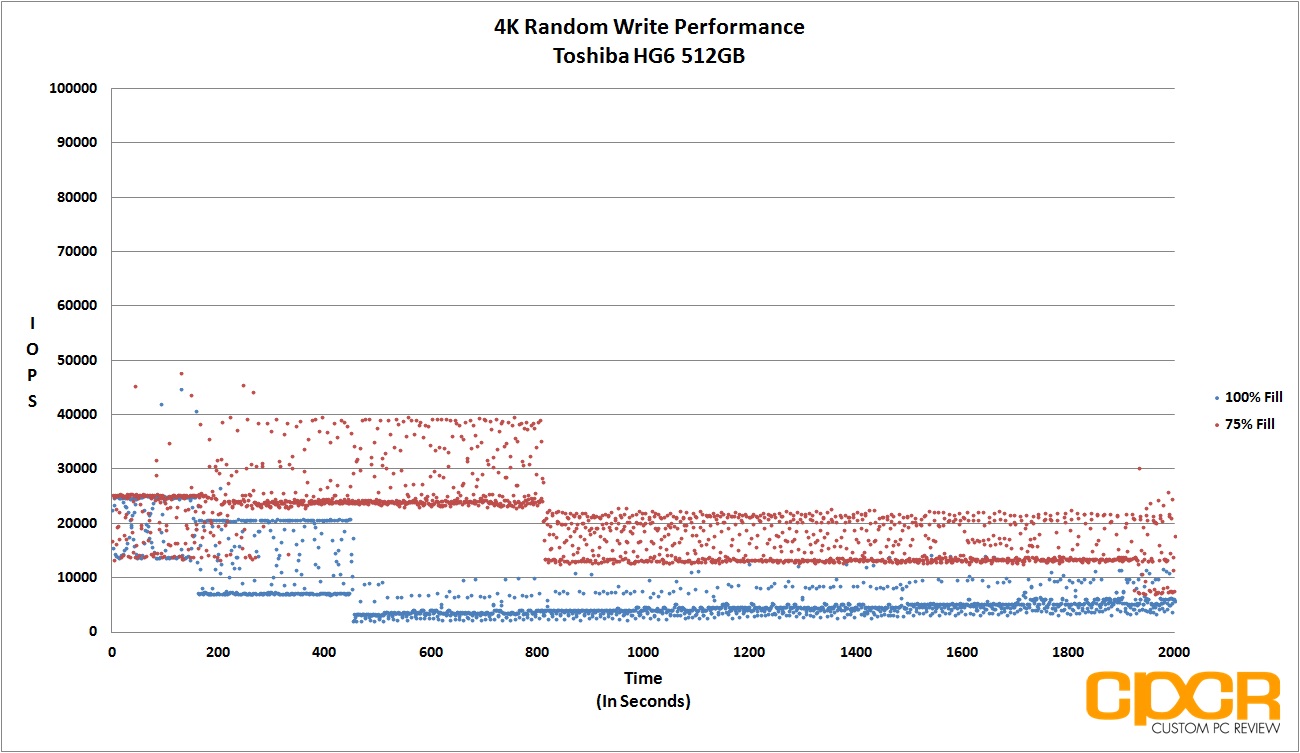
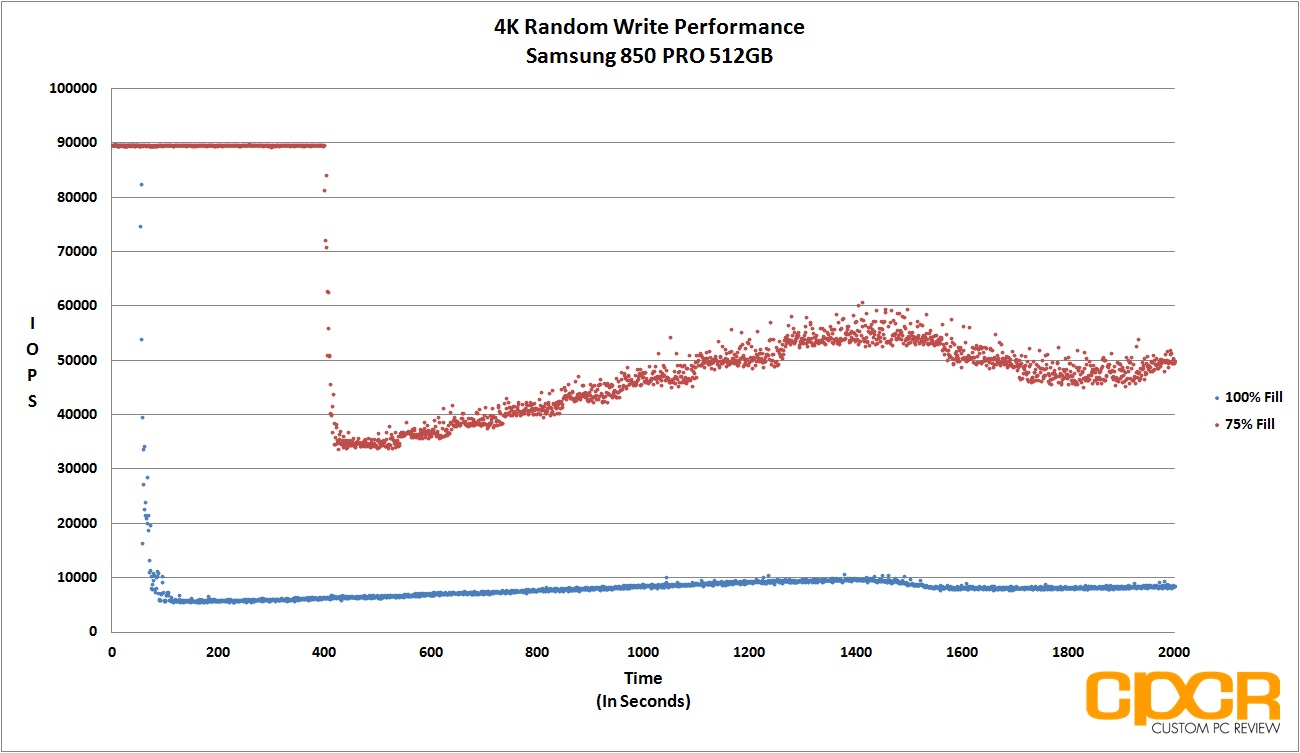
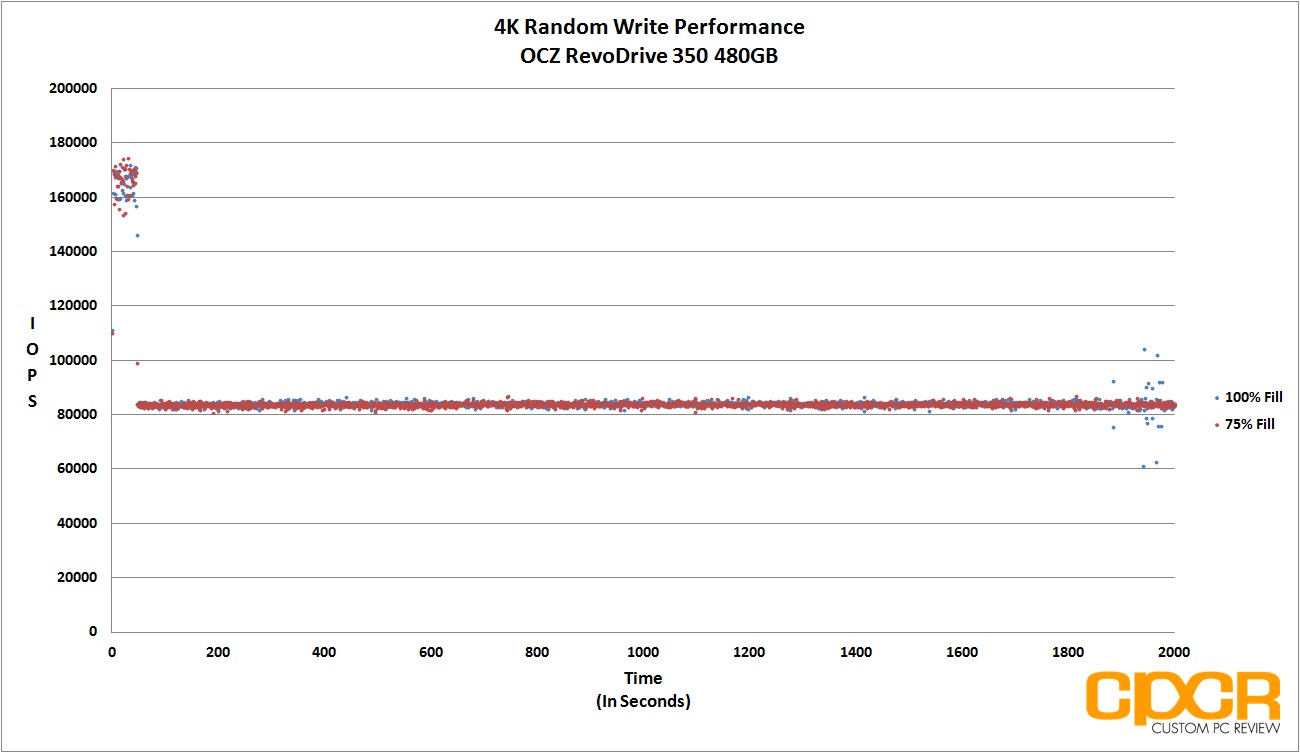
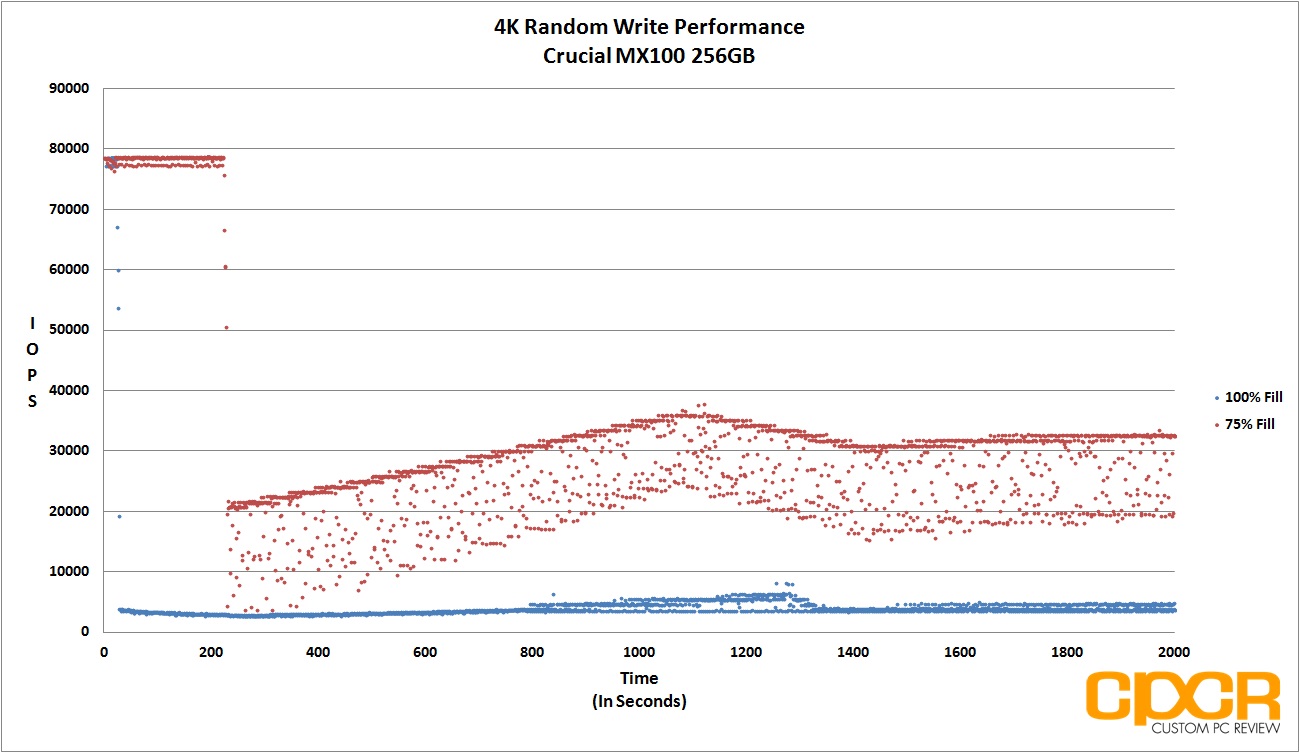
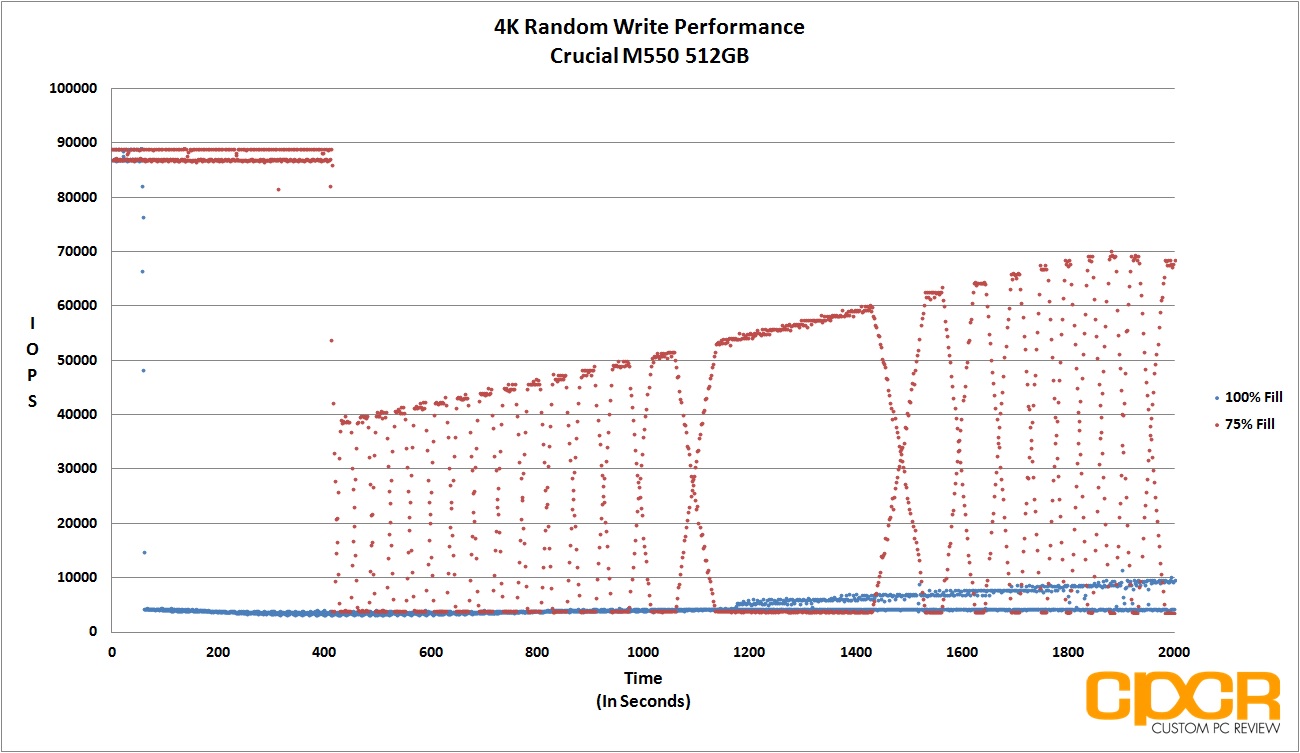
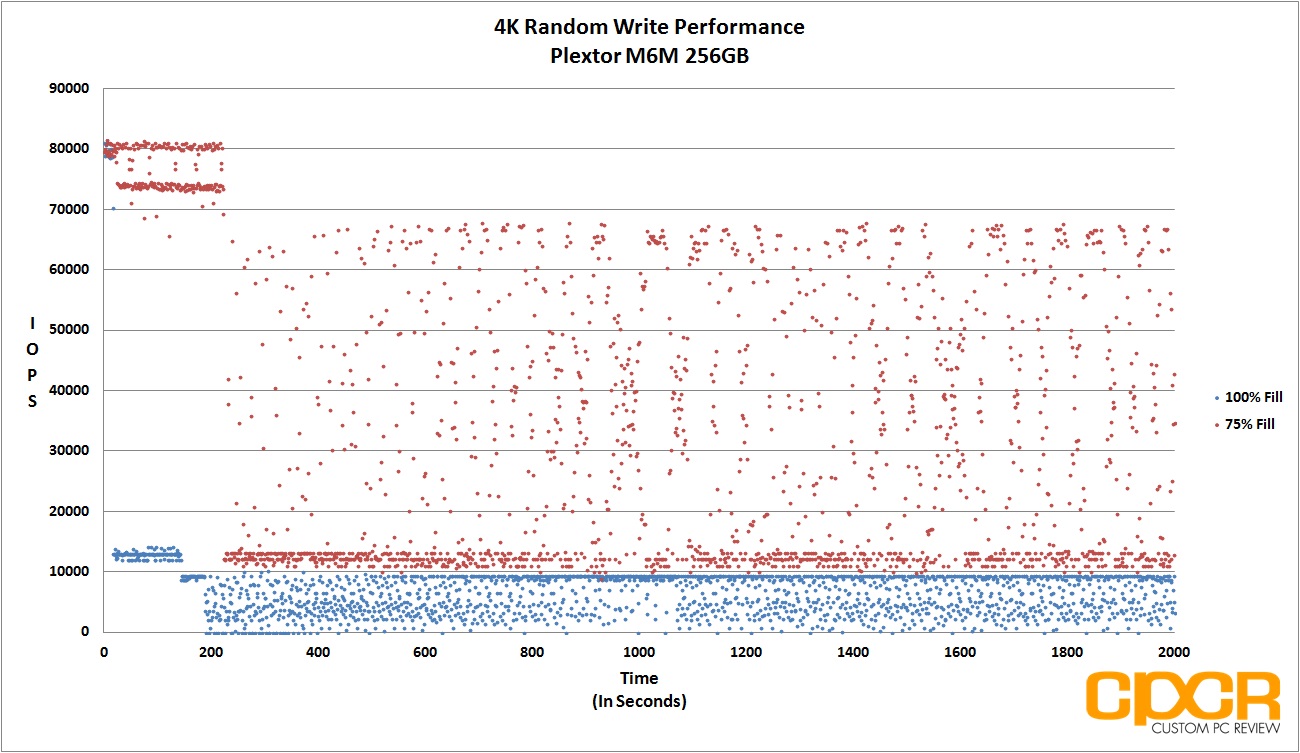
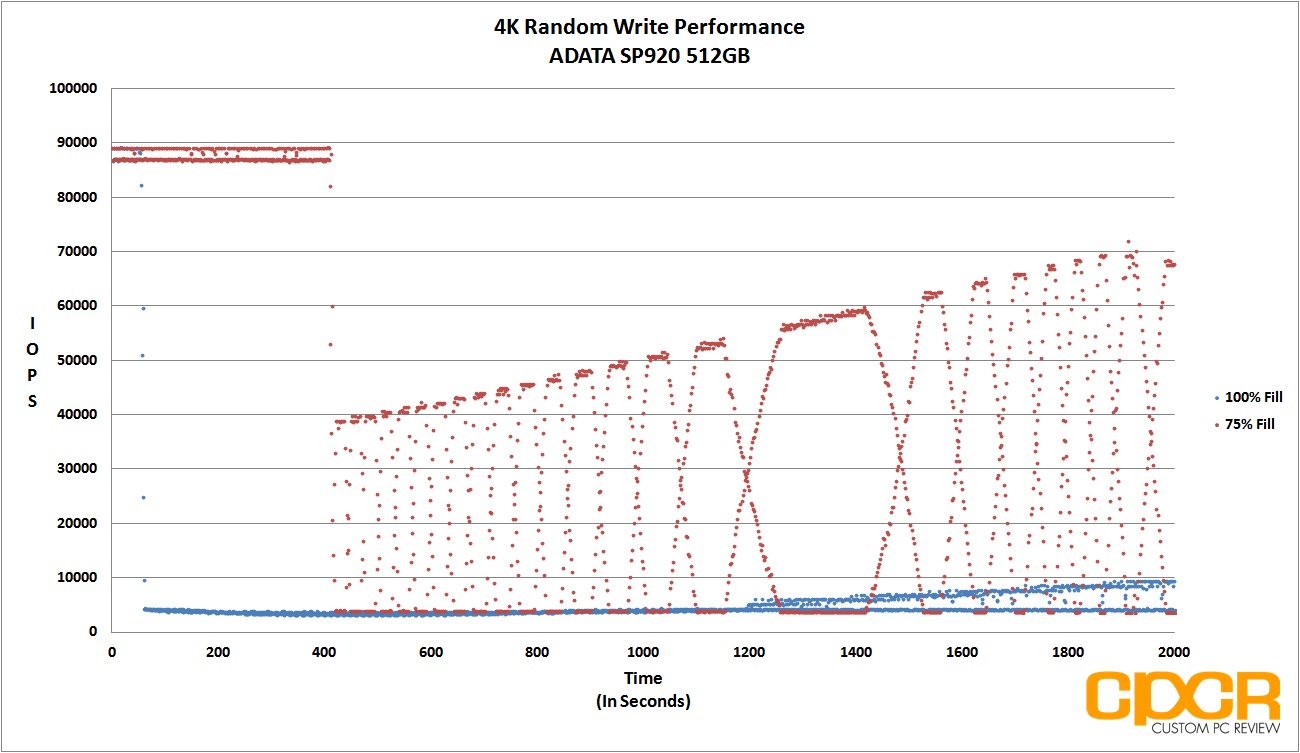
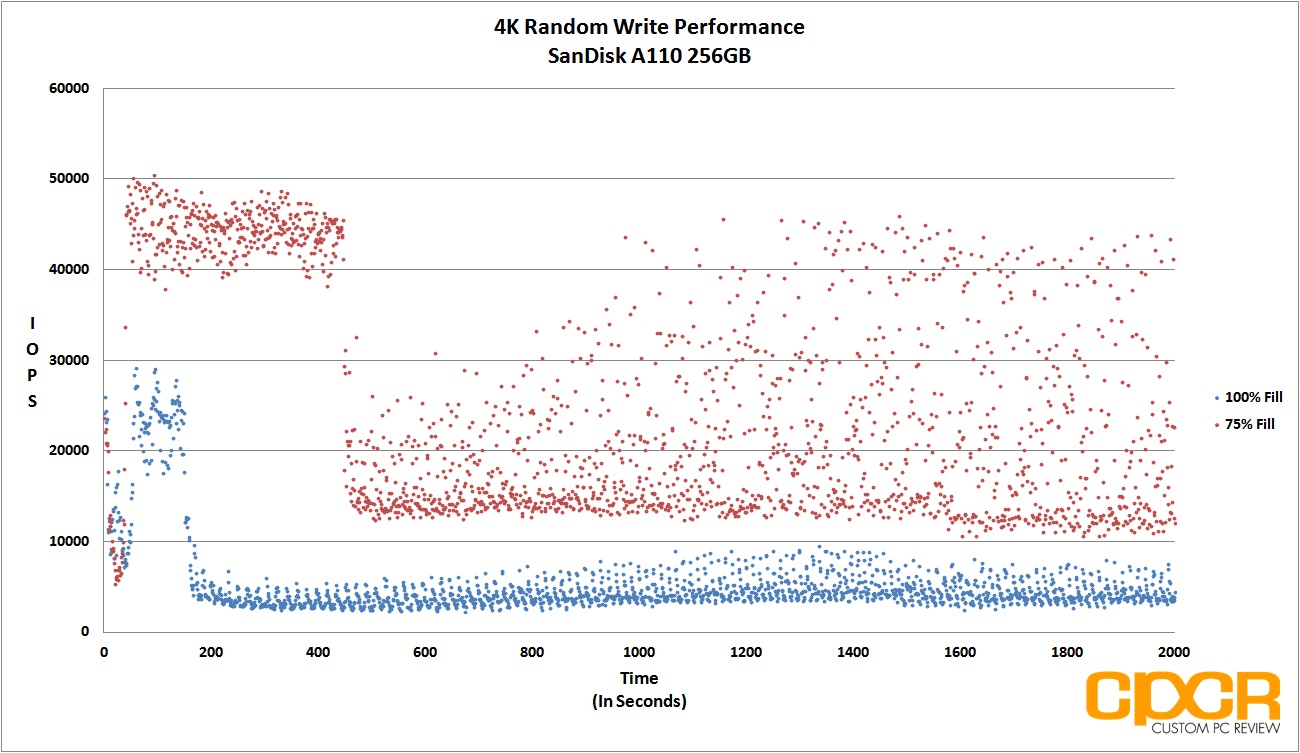
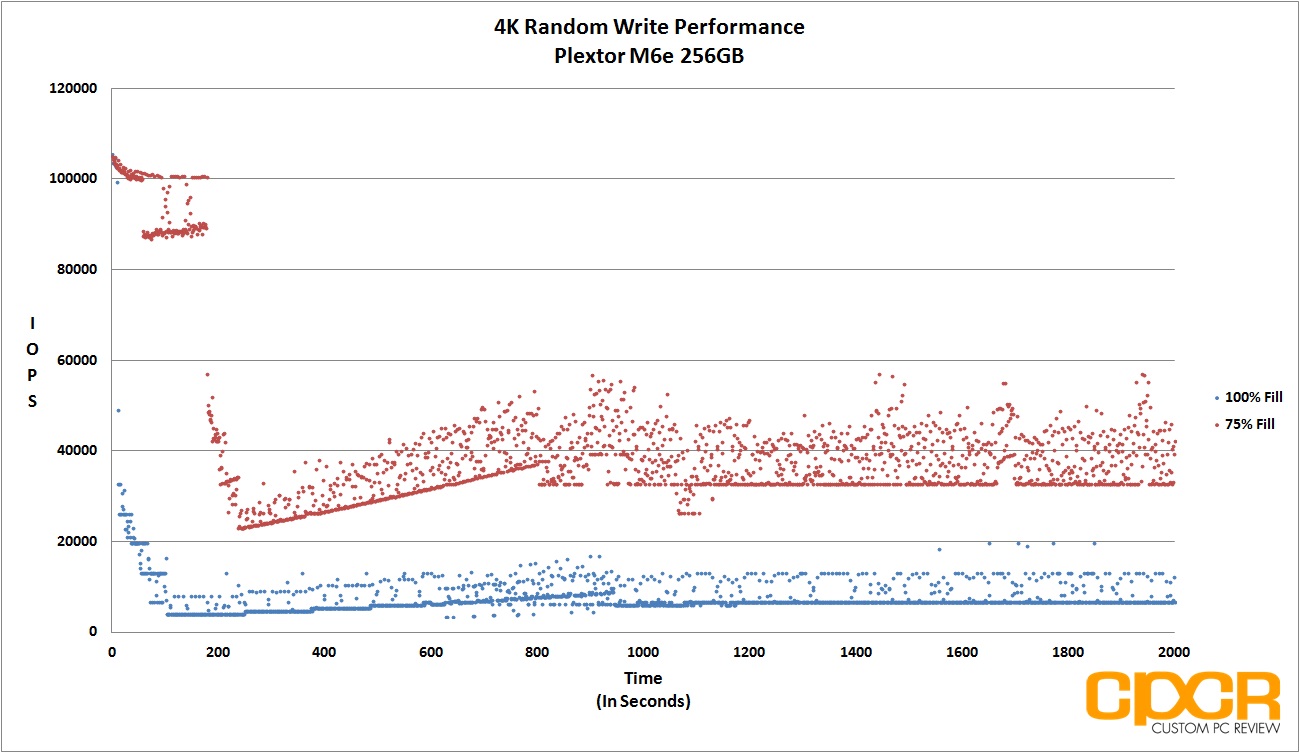
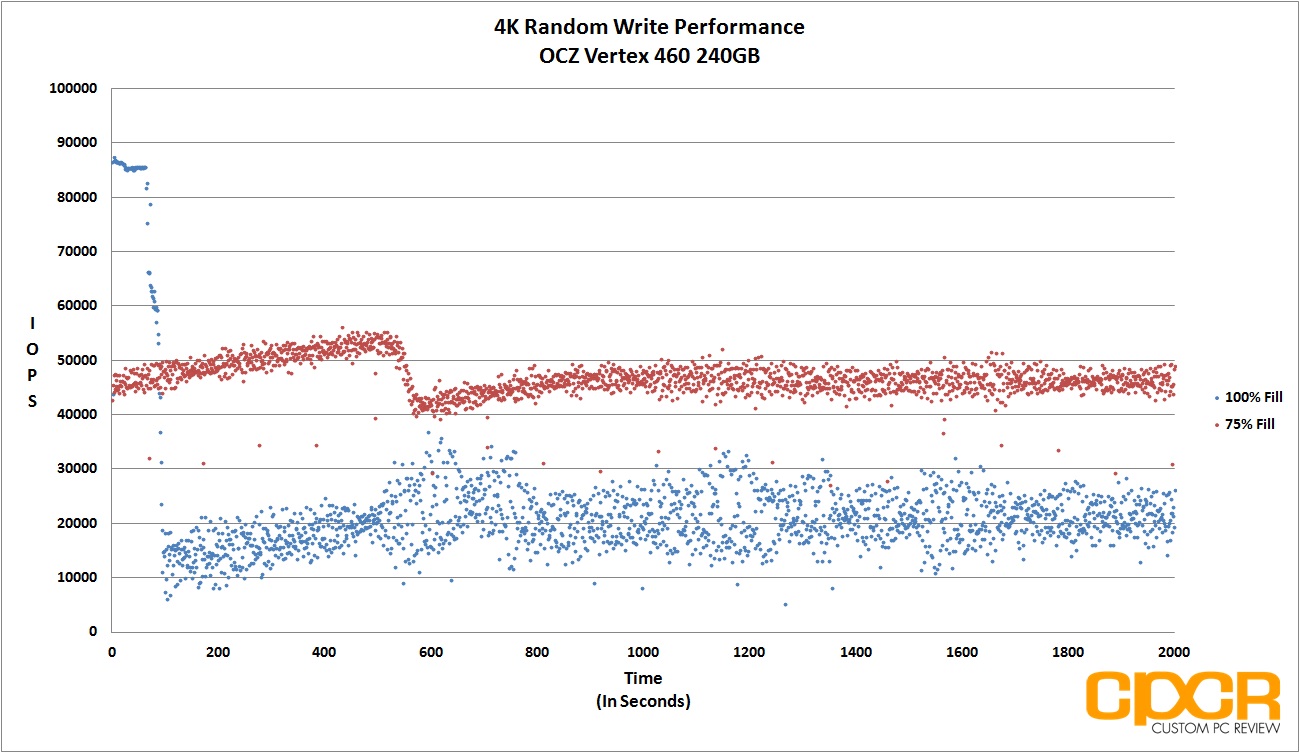
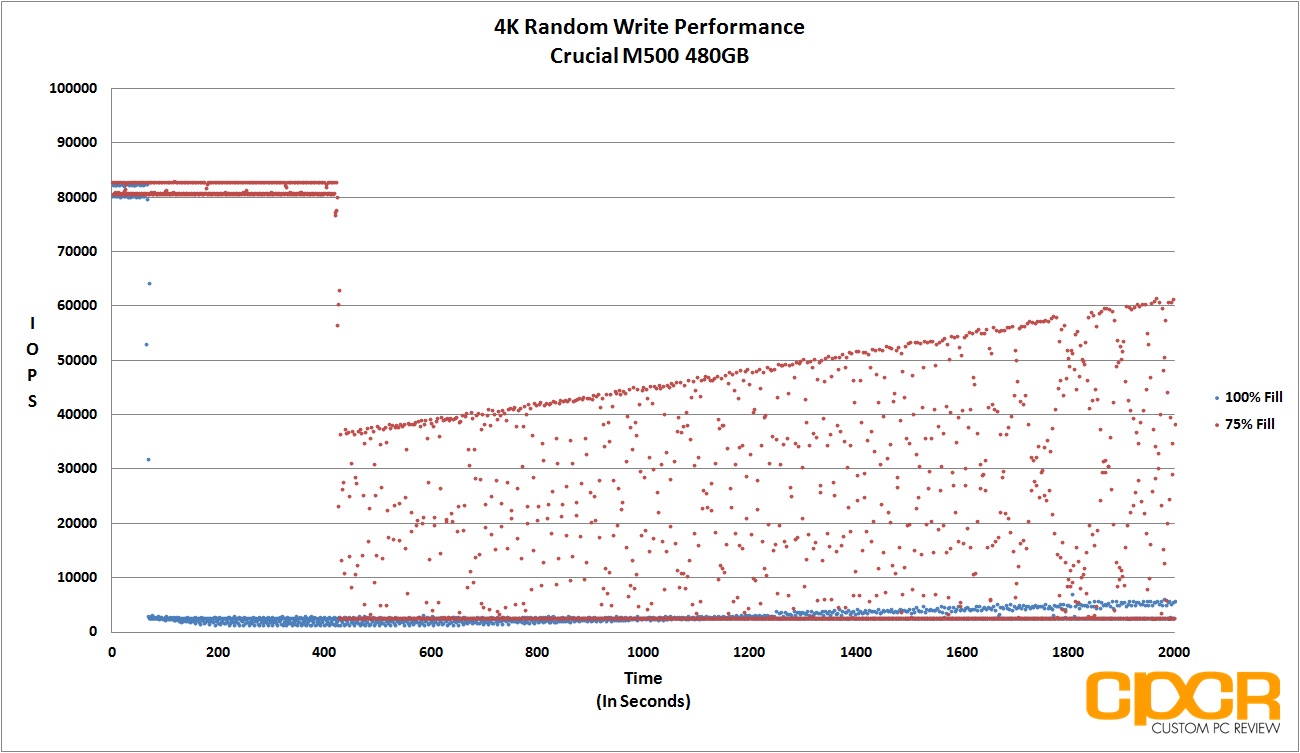
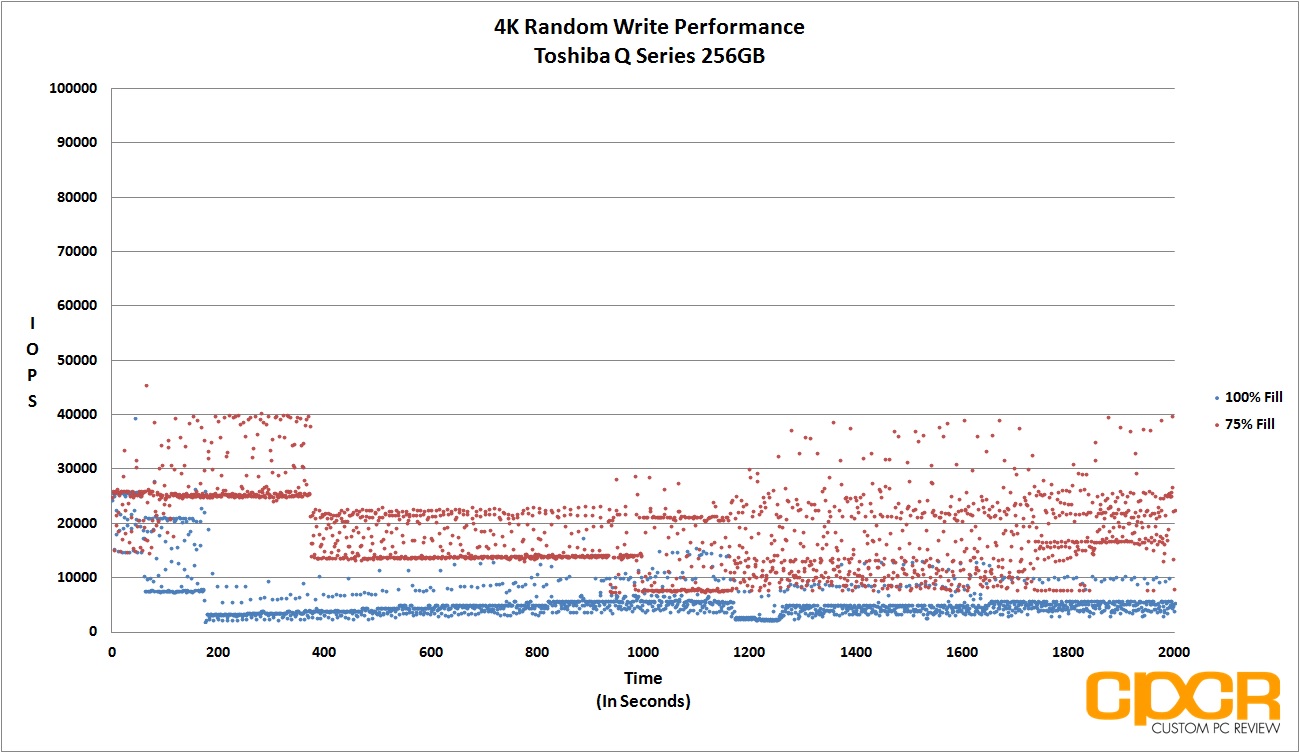
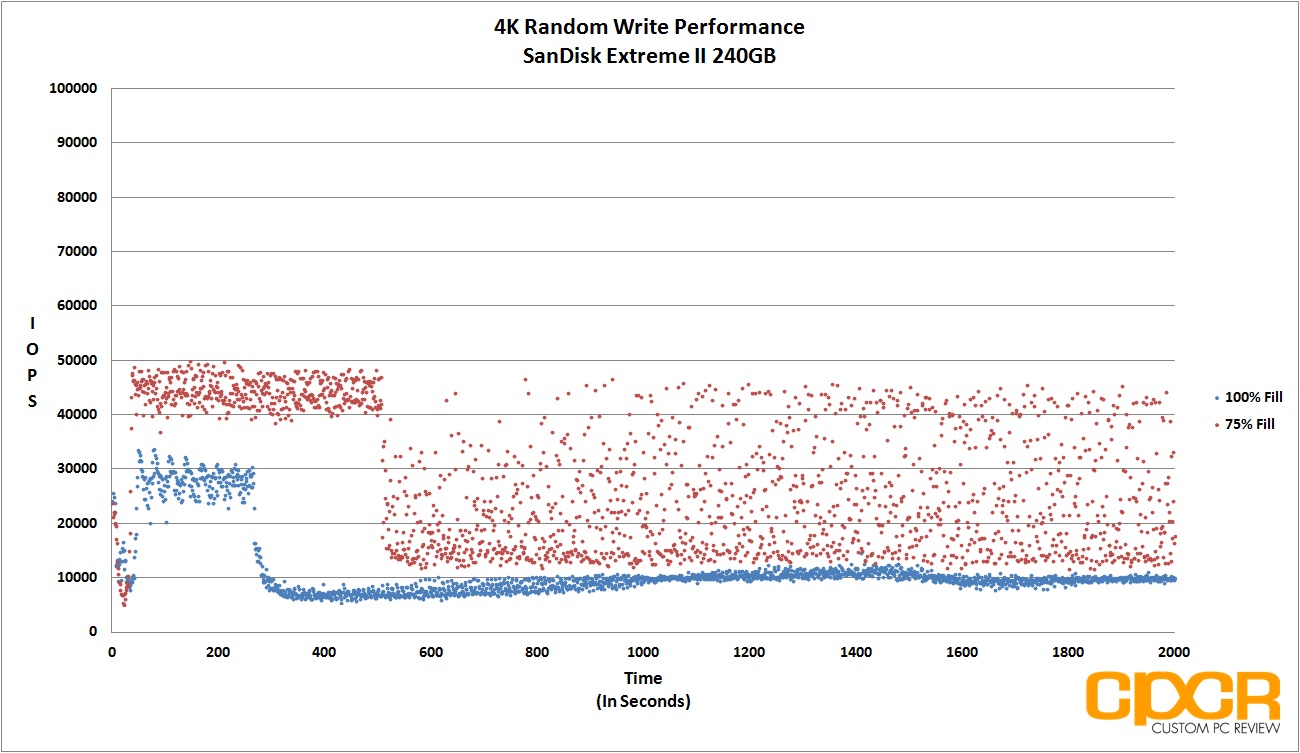
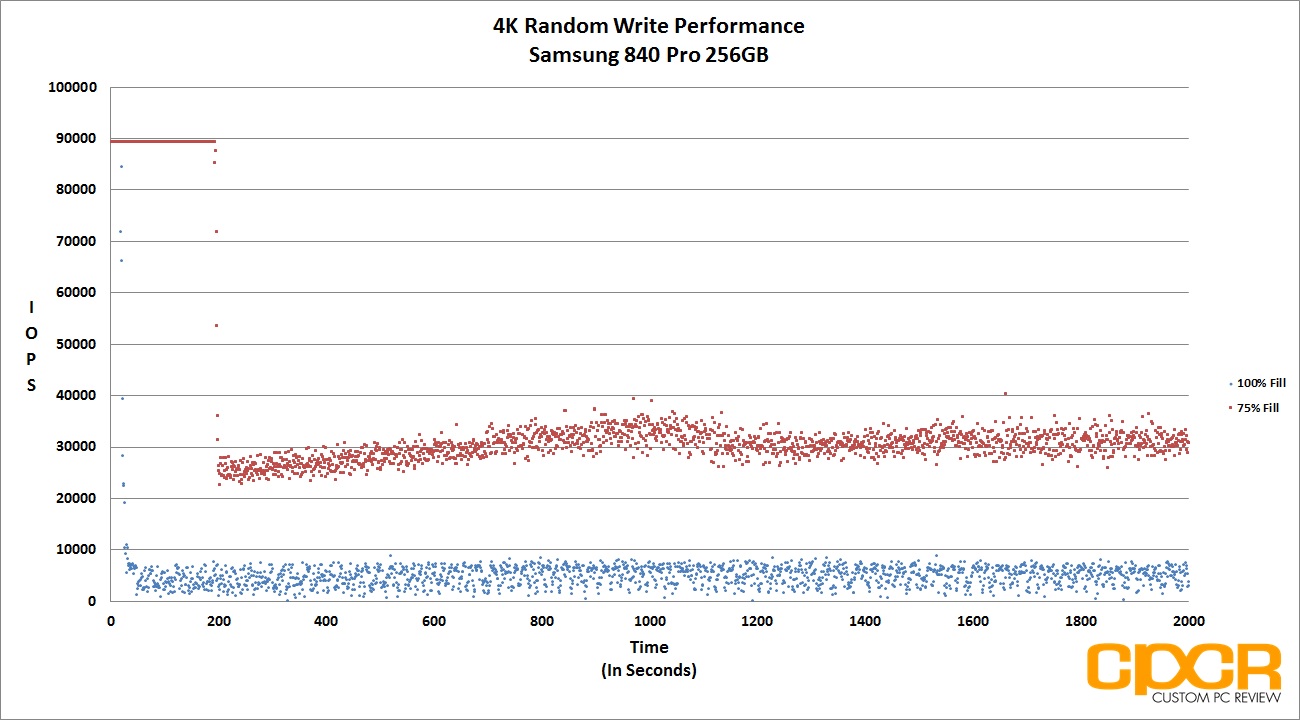
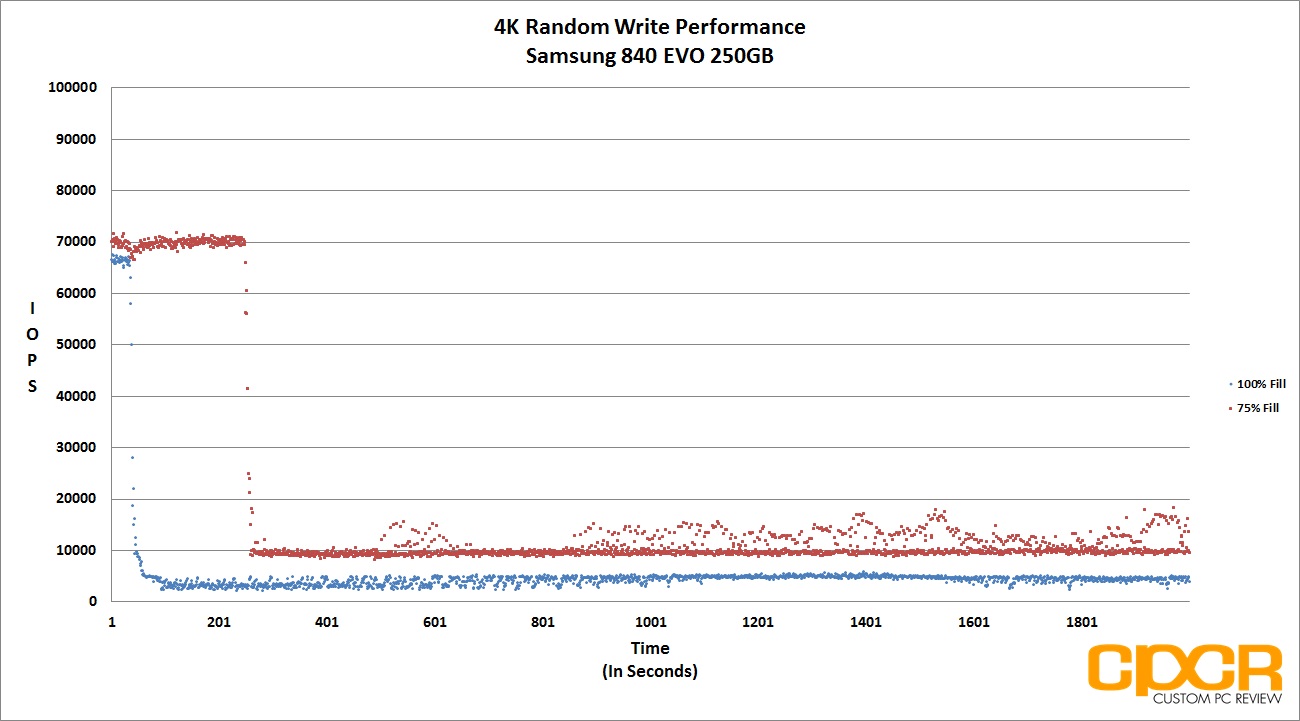
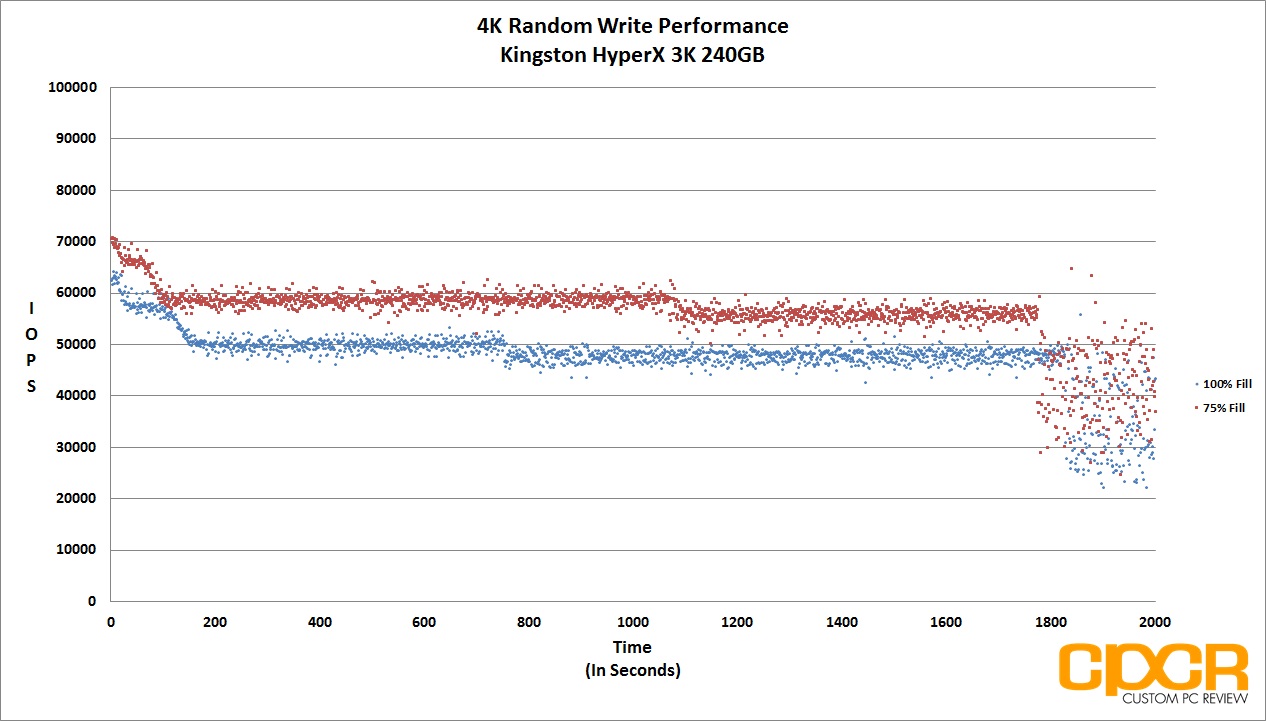
Performance Analysis
With the OCZ Trion 100, there’s very little performance consistency at both 75% and 100% fill.
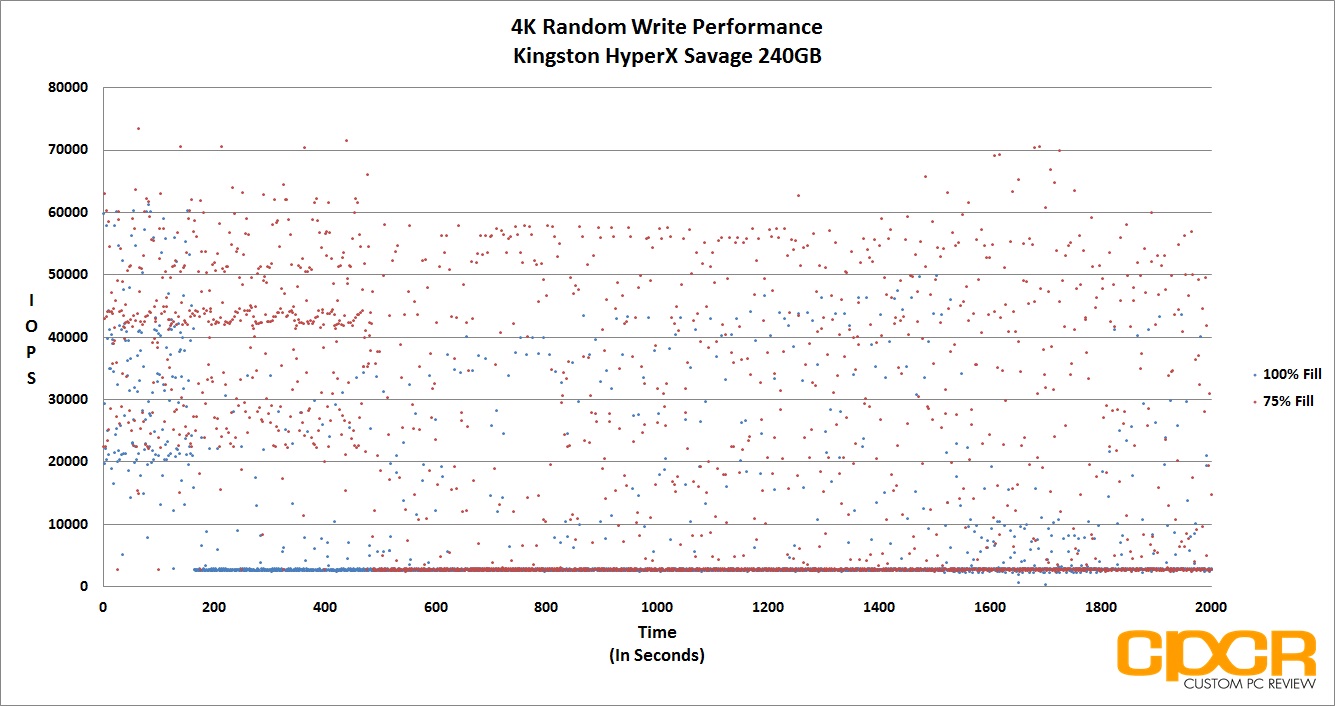
On a side note, we saw similarly bad 4K random write performance consistency with the Patriot Ignite and the Kingston HyperX Savage. While I’m not jumping to any conclusions here, it may be worth it to point out that this firmware/controller needs work.
[section label=”9. FIO – 4K Random Write Latency”]
OCZ Trion 100 480GB Performance
FIO 4K Random Write Latency Testing
Another metric that’s becoming increasingly important in SSDs is its ability to keep latency low despite being subjected to a heavy workload. Even if a SSD were capable of ultra high and ultra consistent IOPS performance, if latency were high, users would still feel that the drive is slow. Ideally, SATA SSDs should always be capable of latencies under 50ms, even during heavy workloads.
For latency testing, we’ll be using the exact same testing parameters as IOPS consistency testing, except instead of recording IOPS every second, we’ll be recording latency.
[tabgroup]
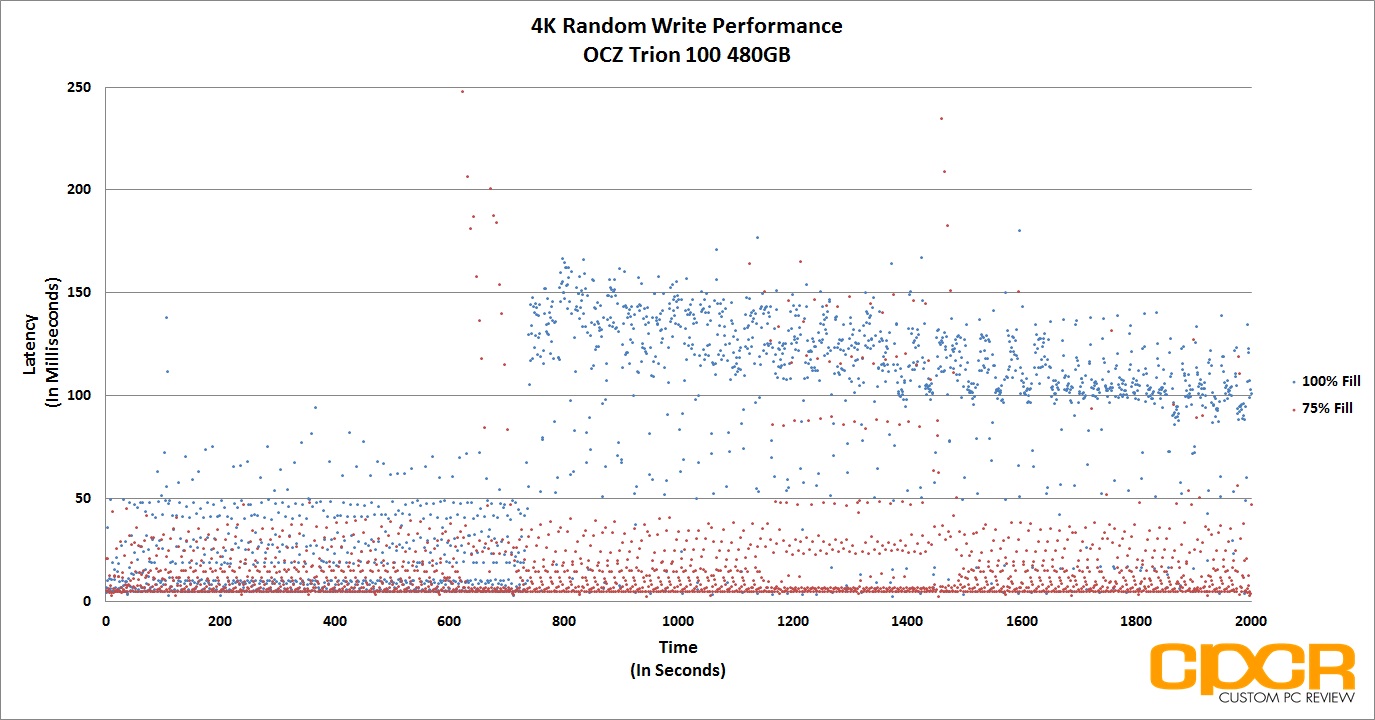
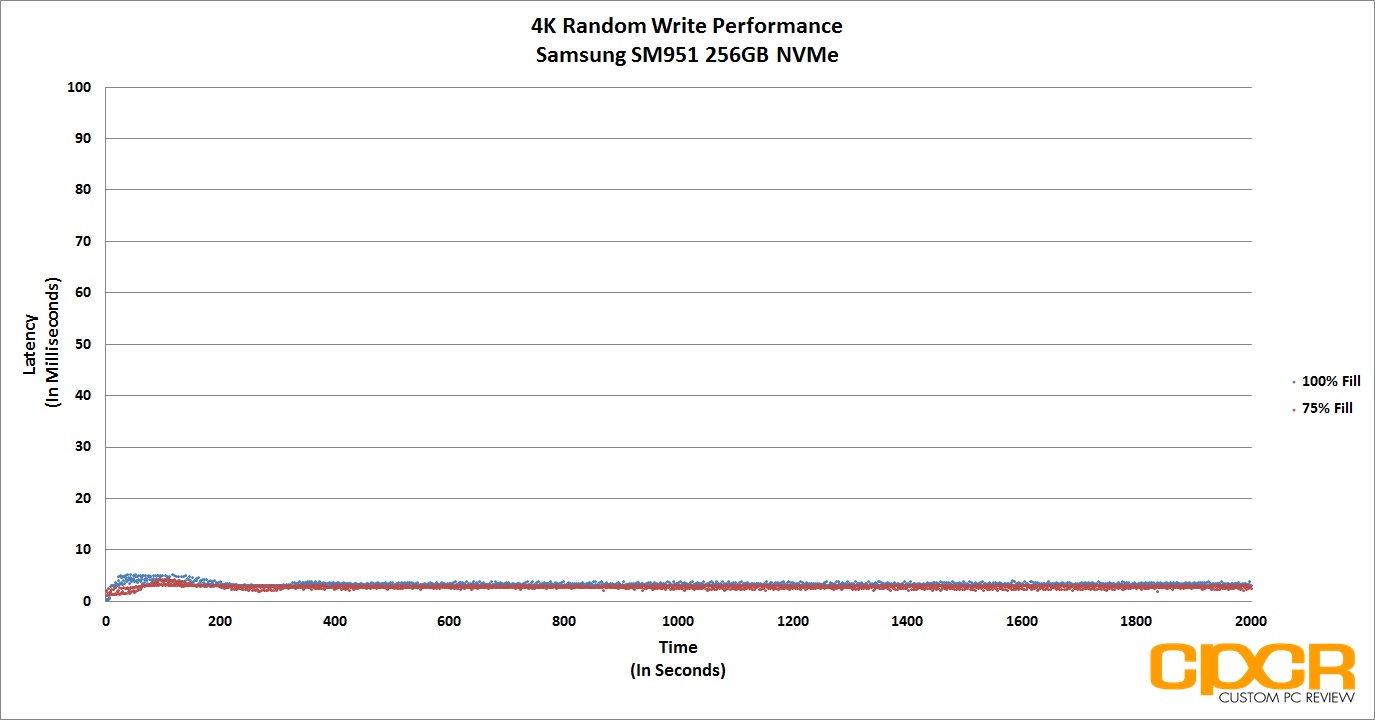
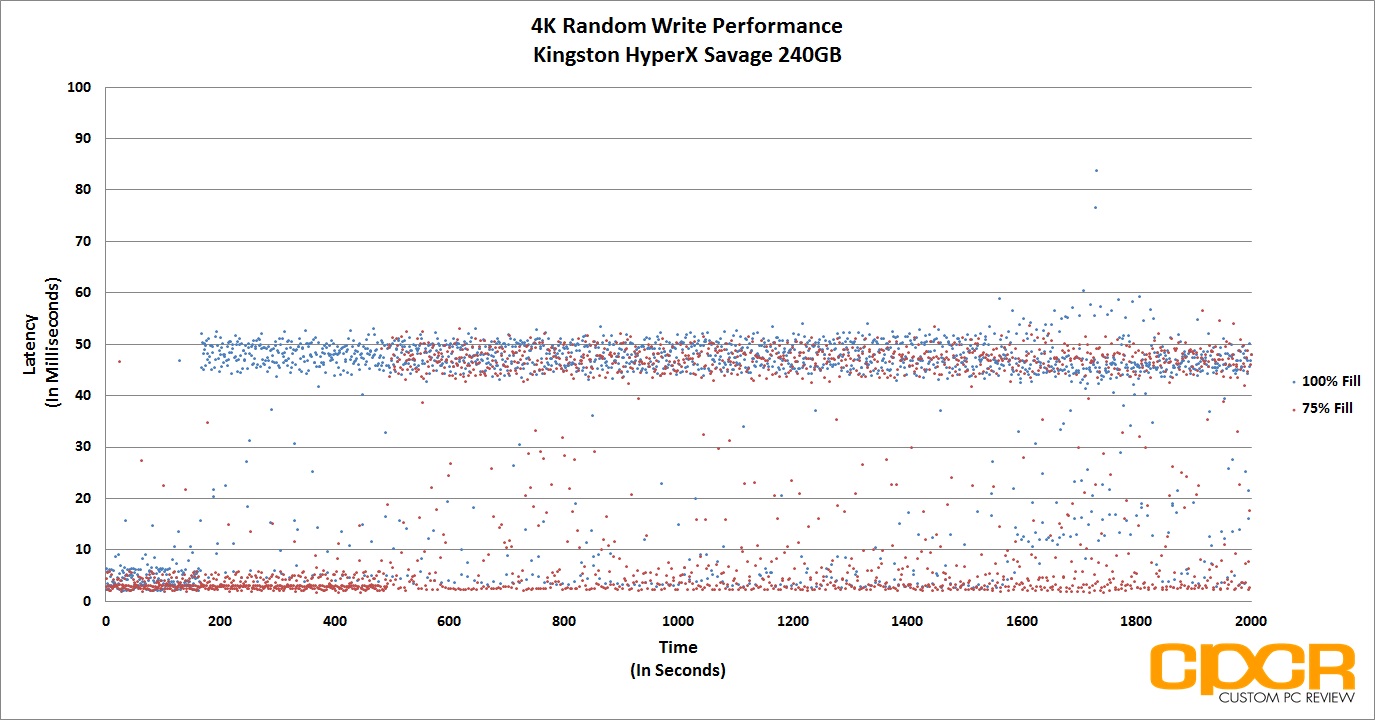
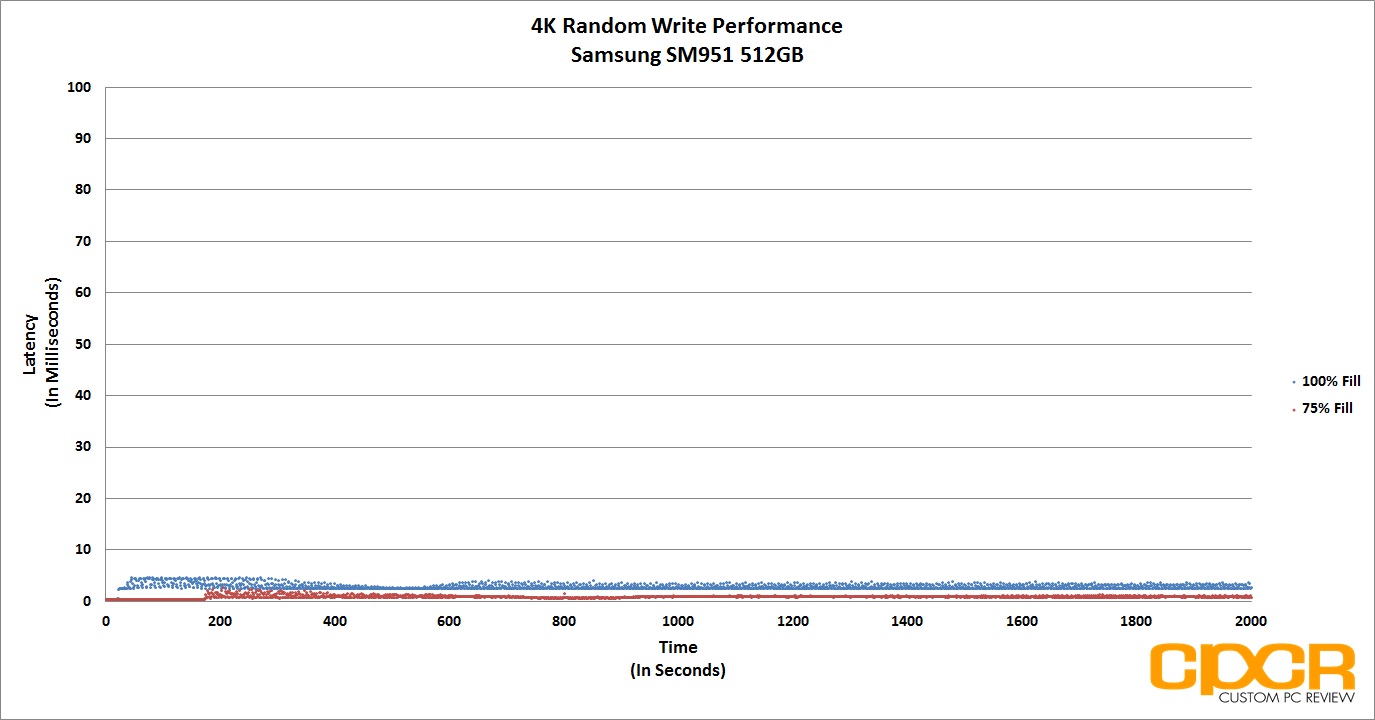
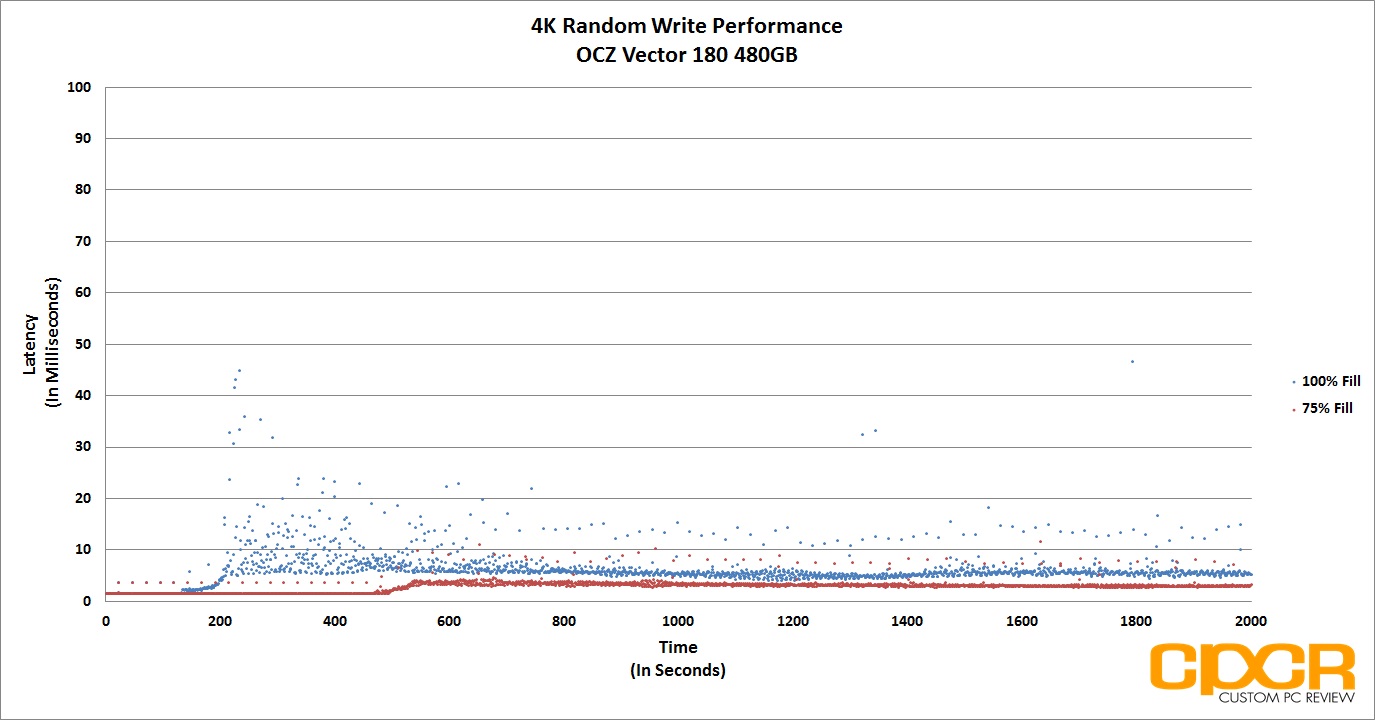
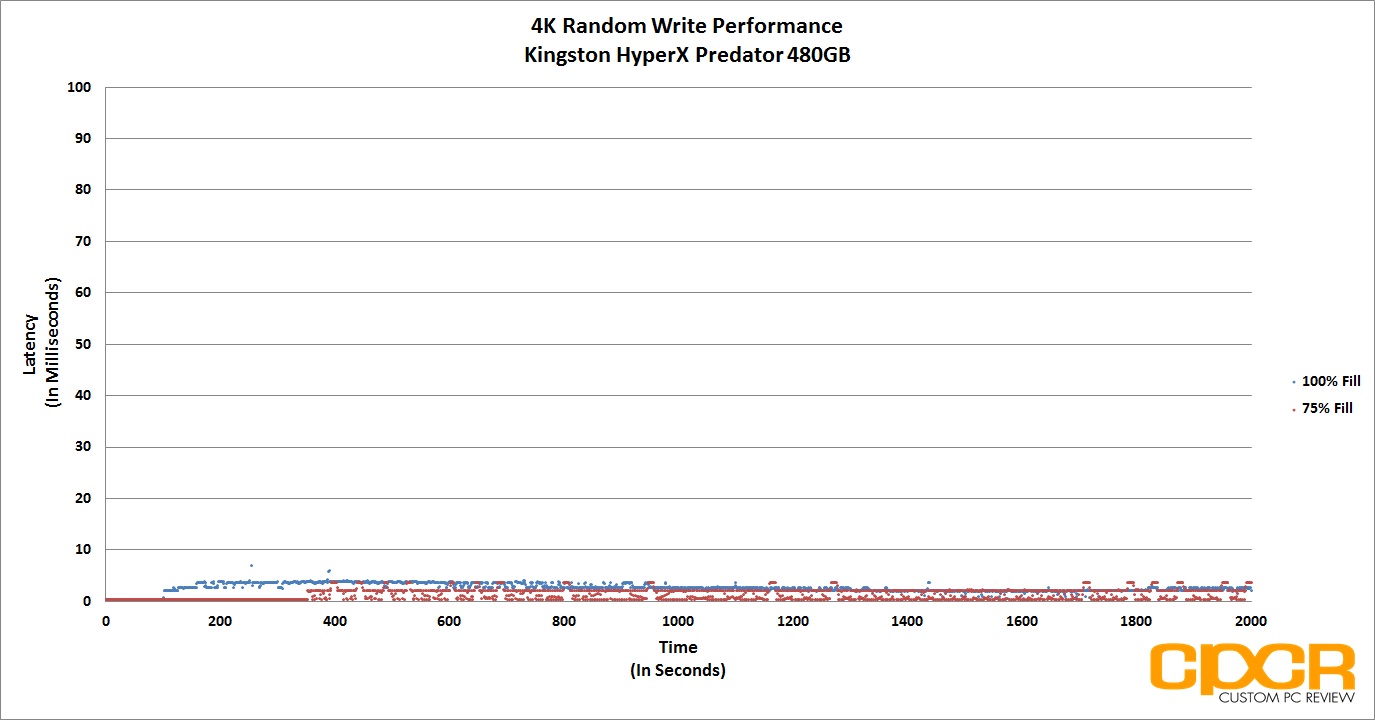
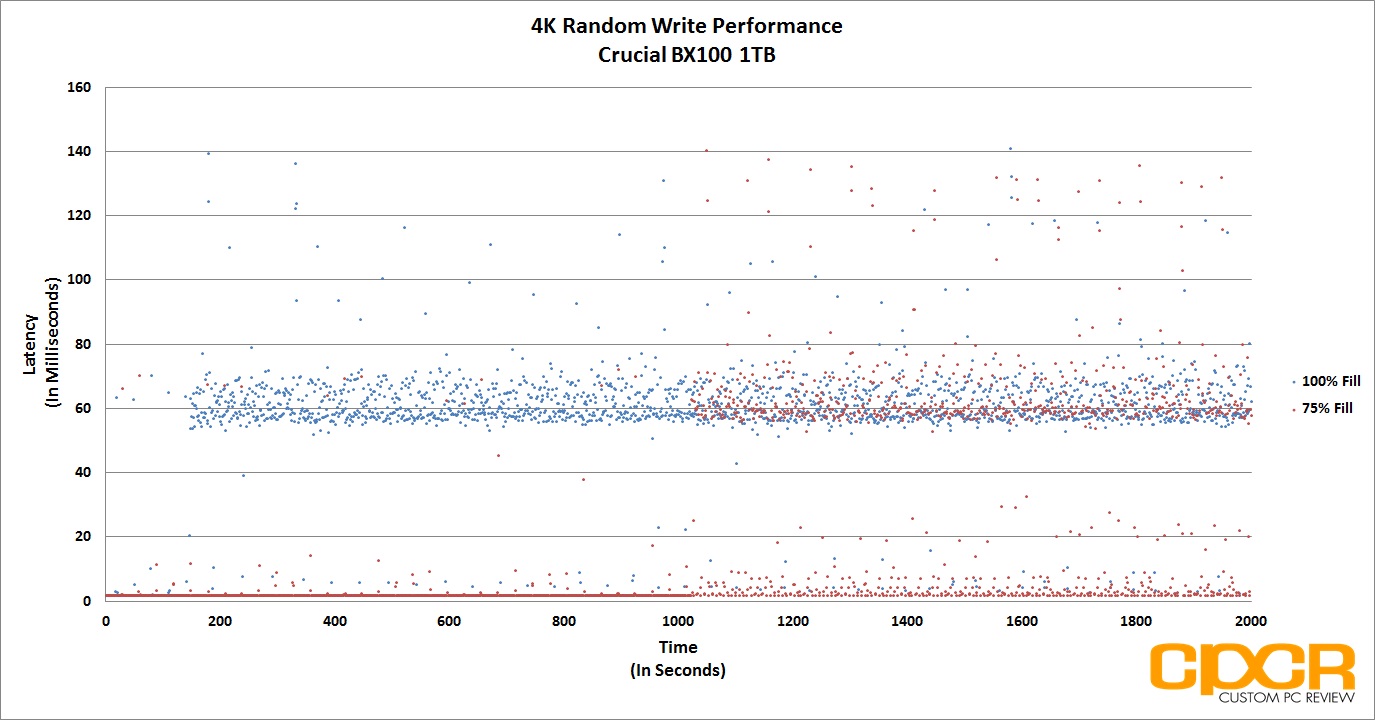
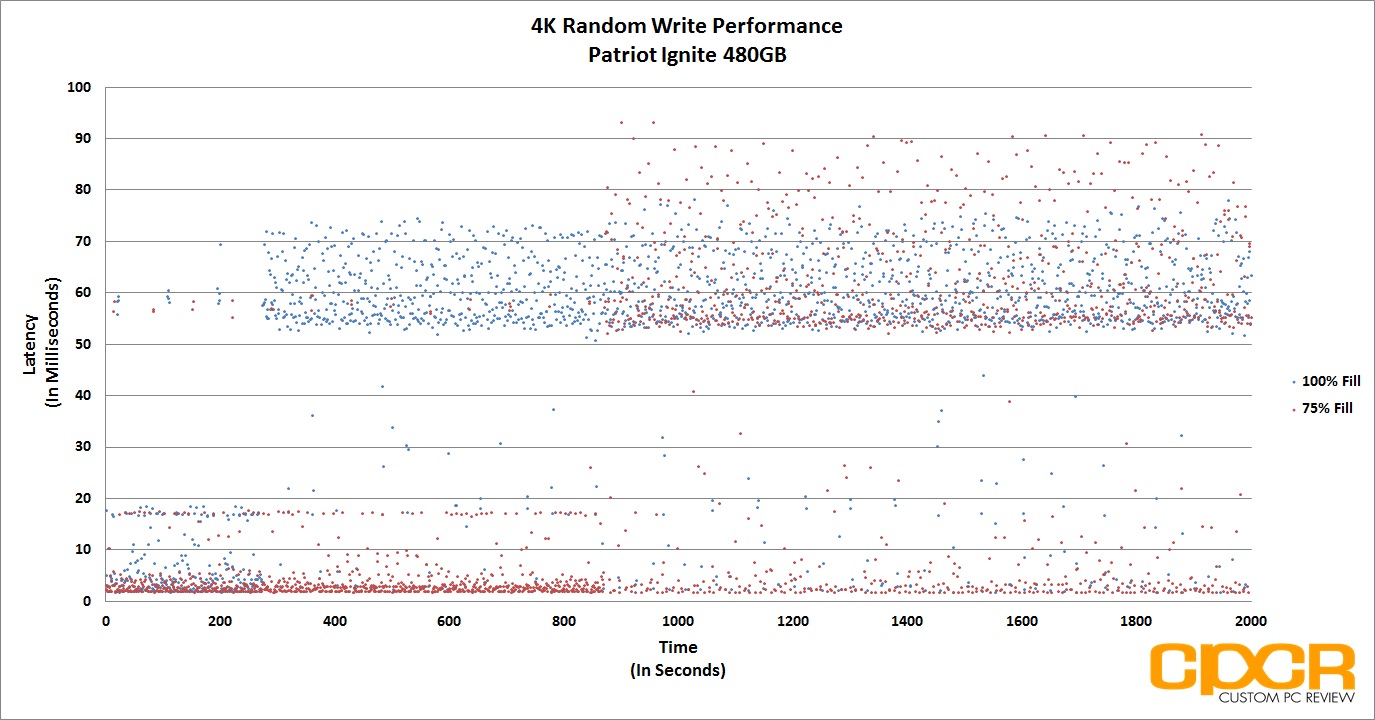
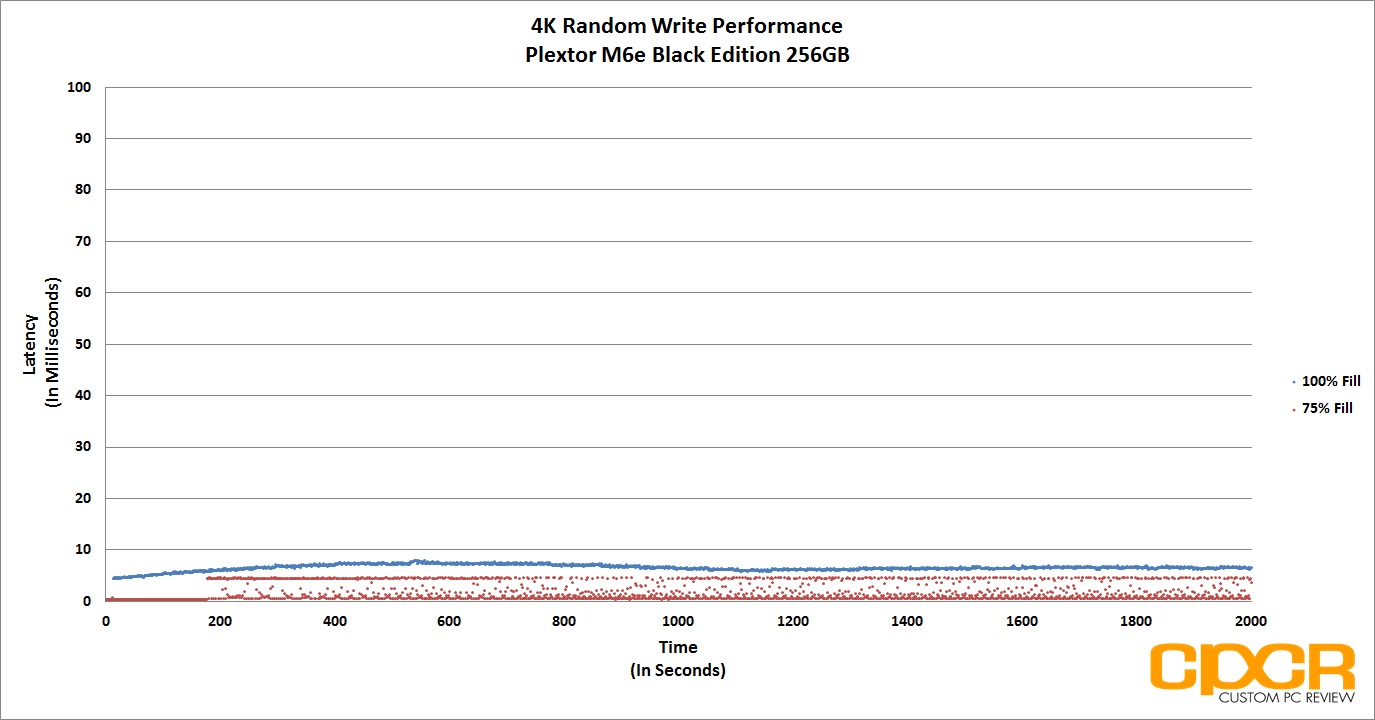
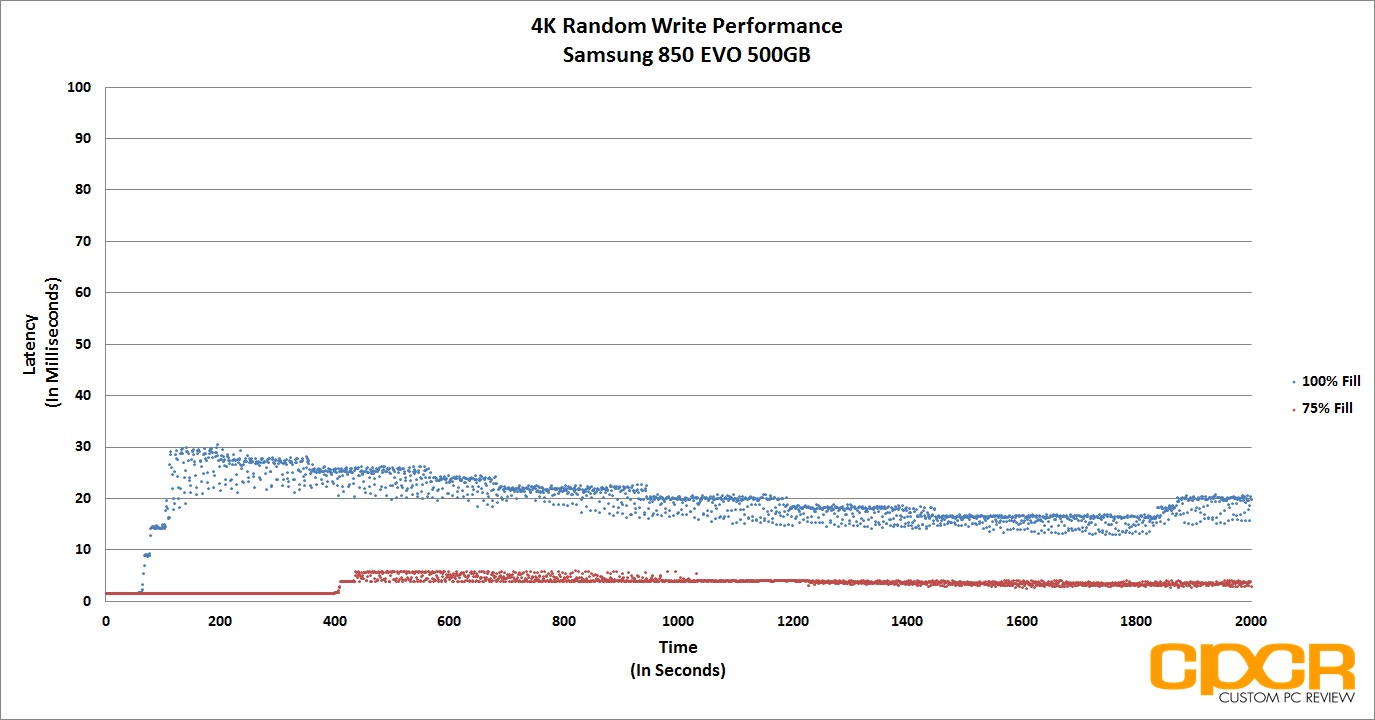
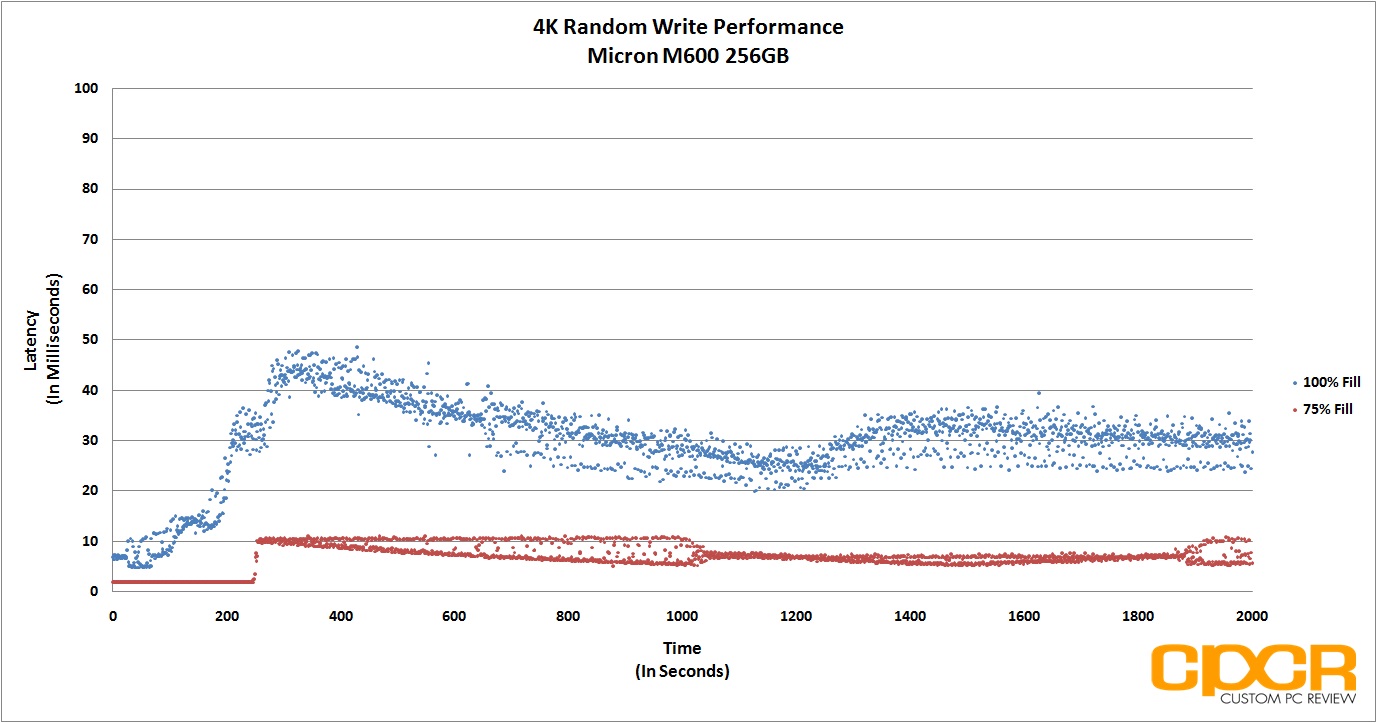
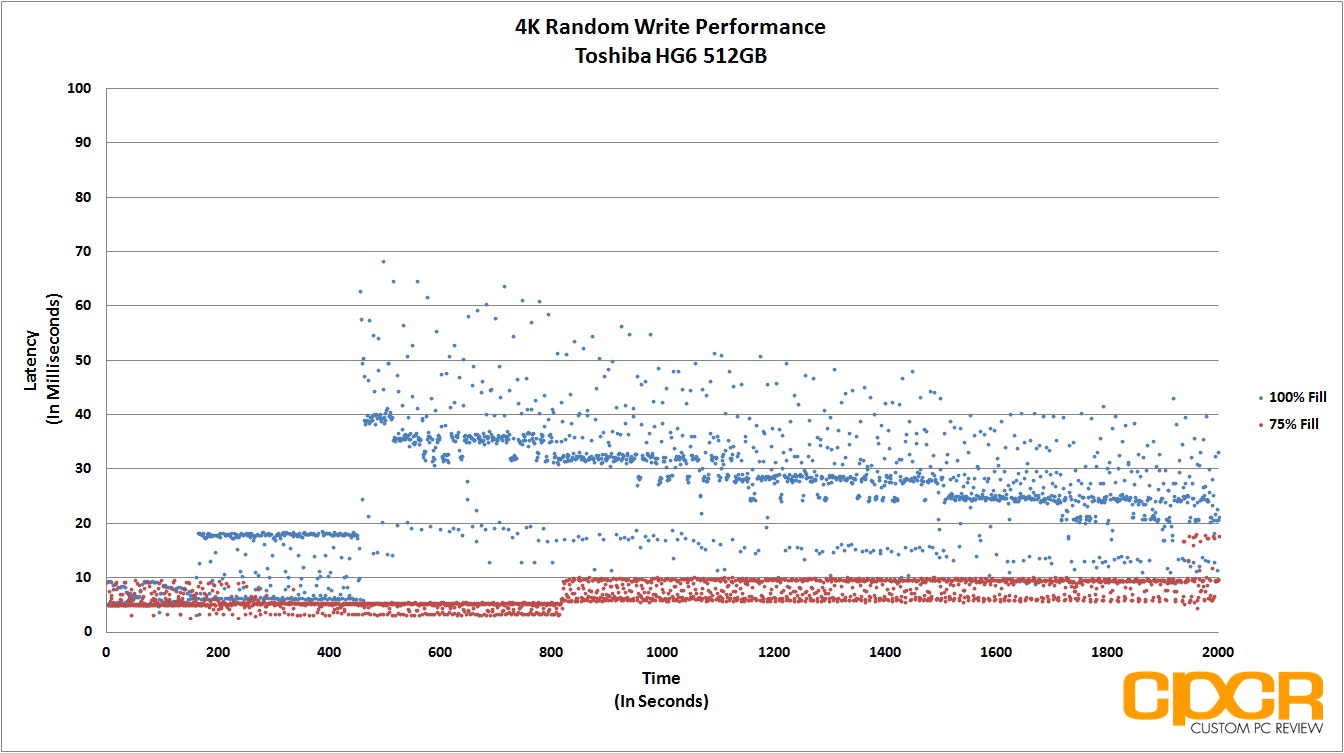
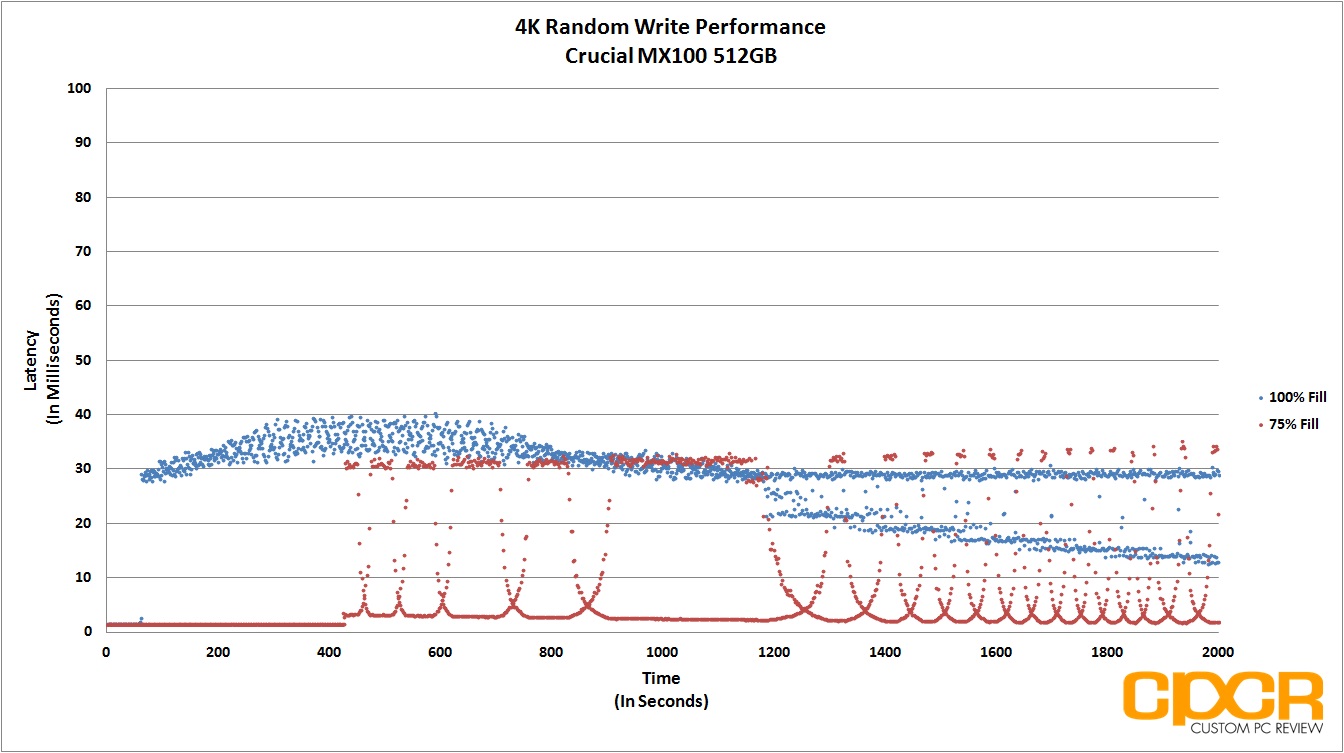
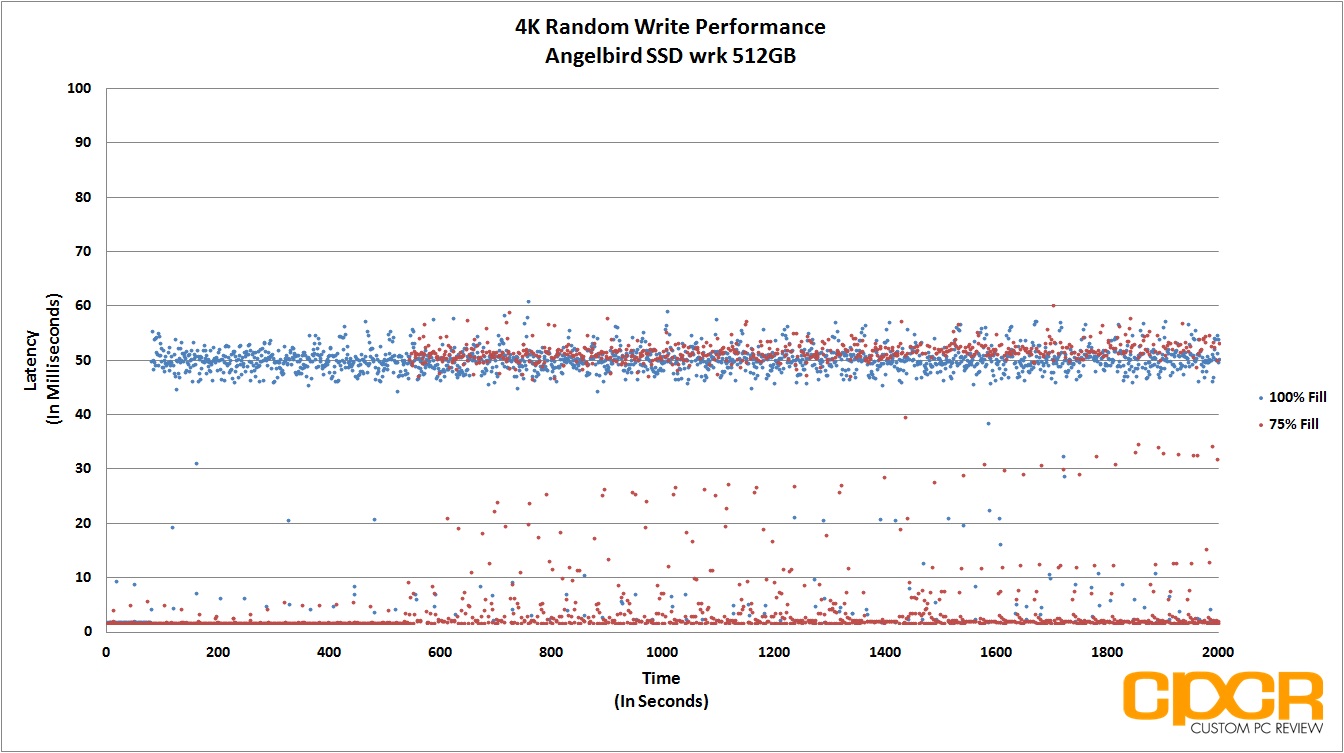
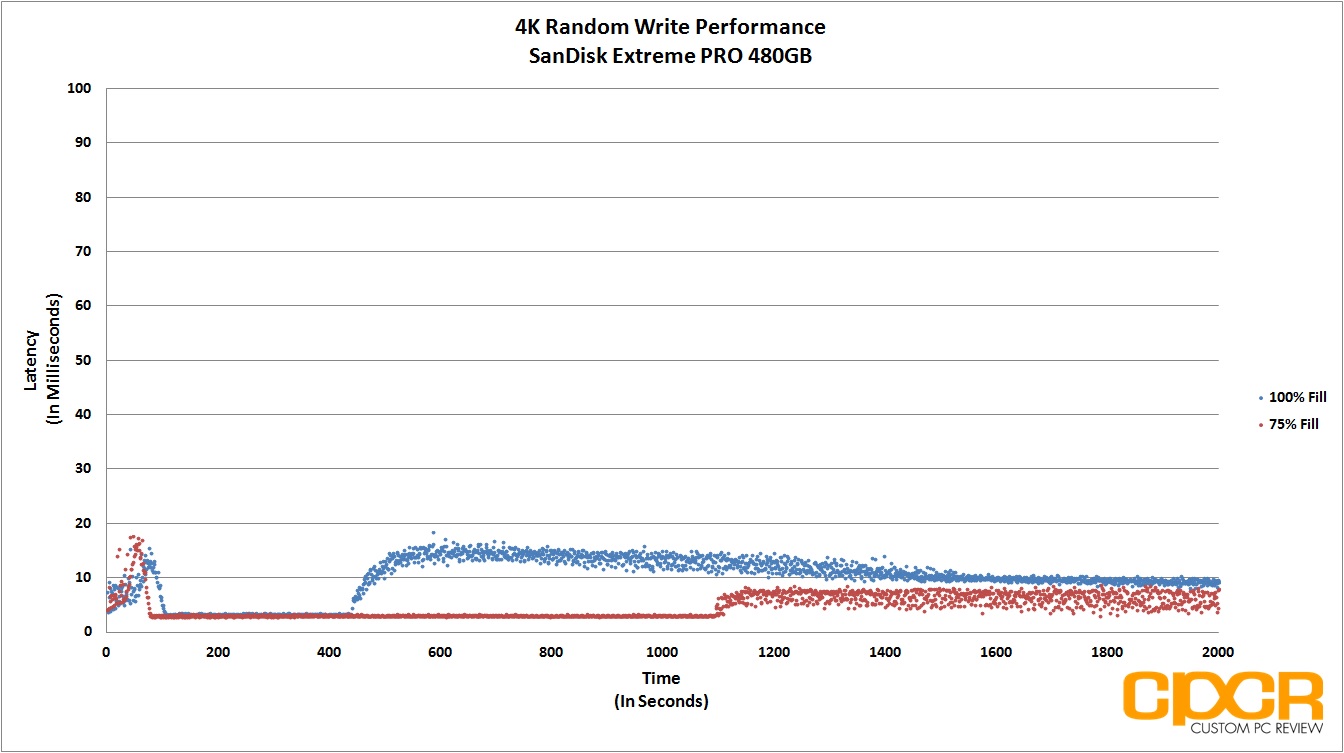
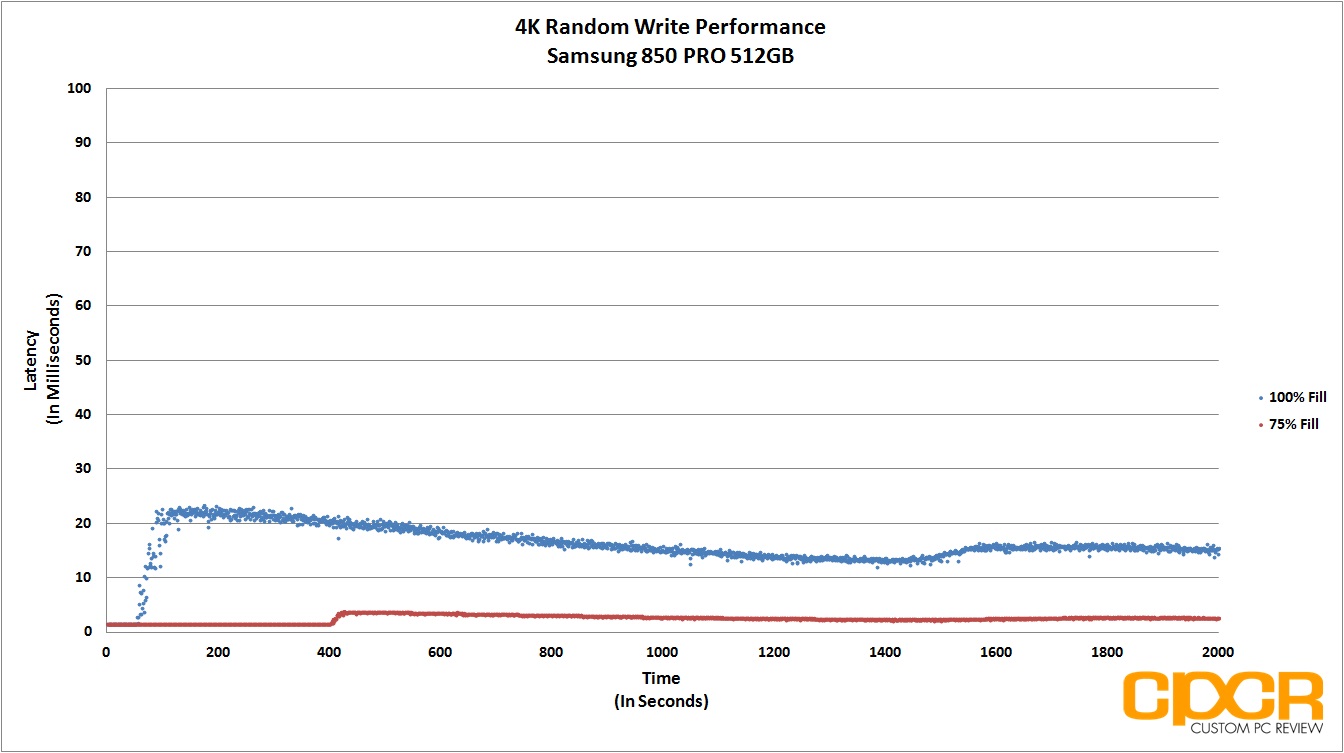
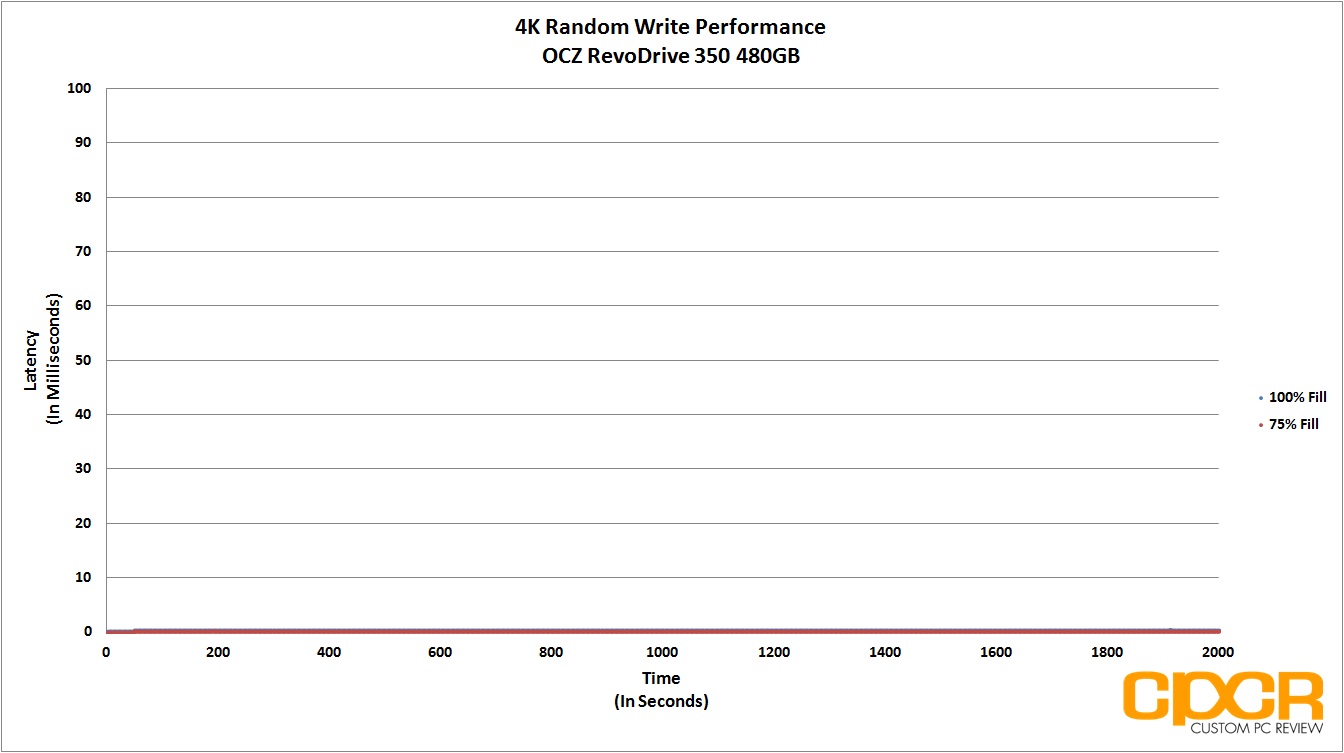
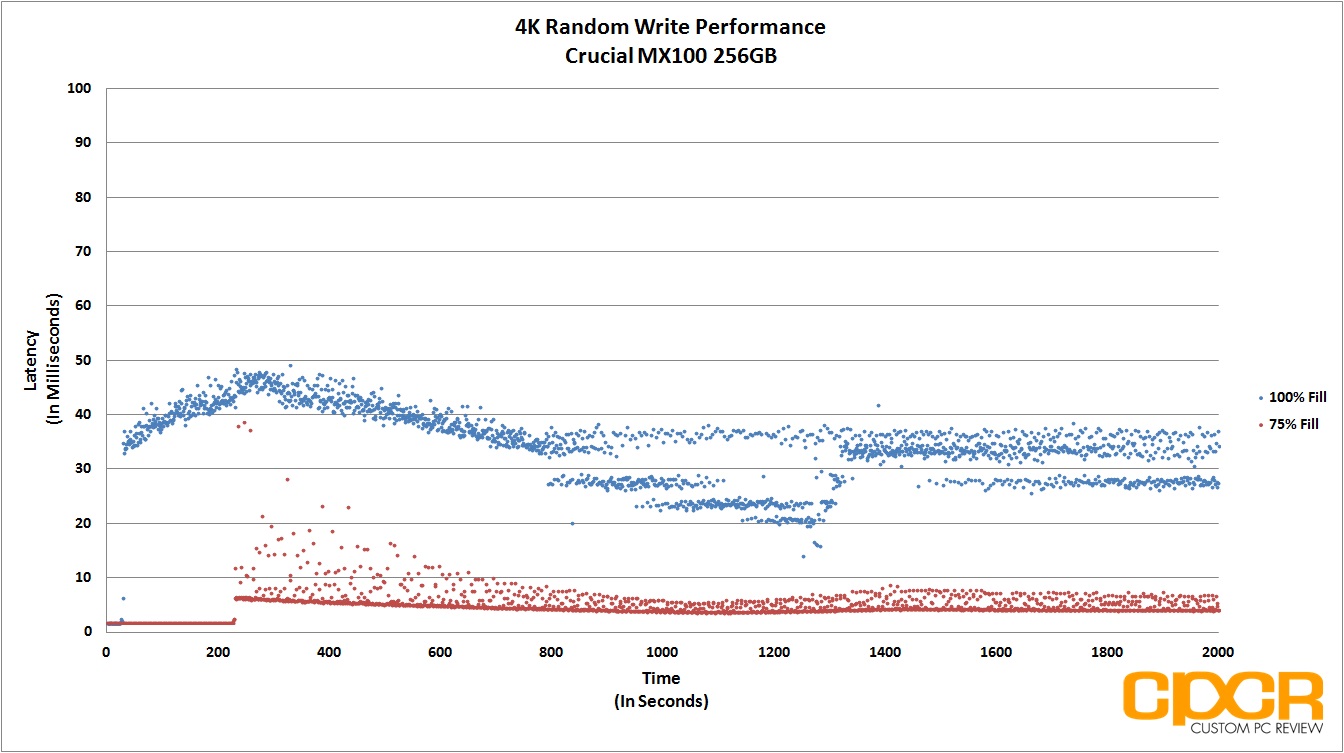
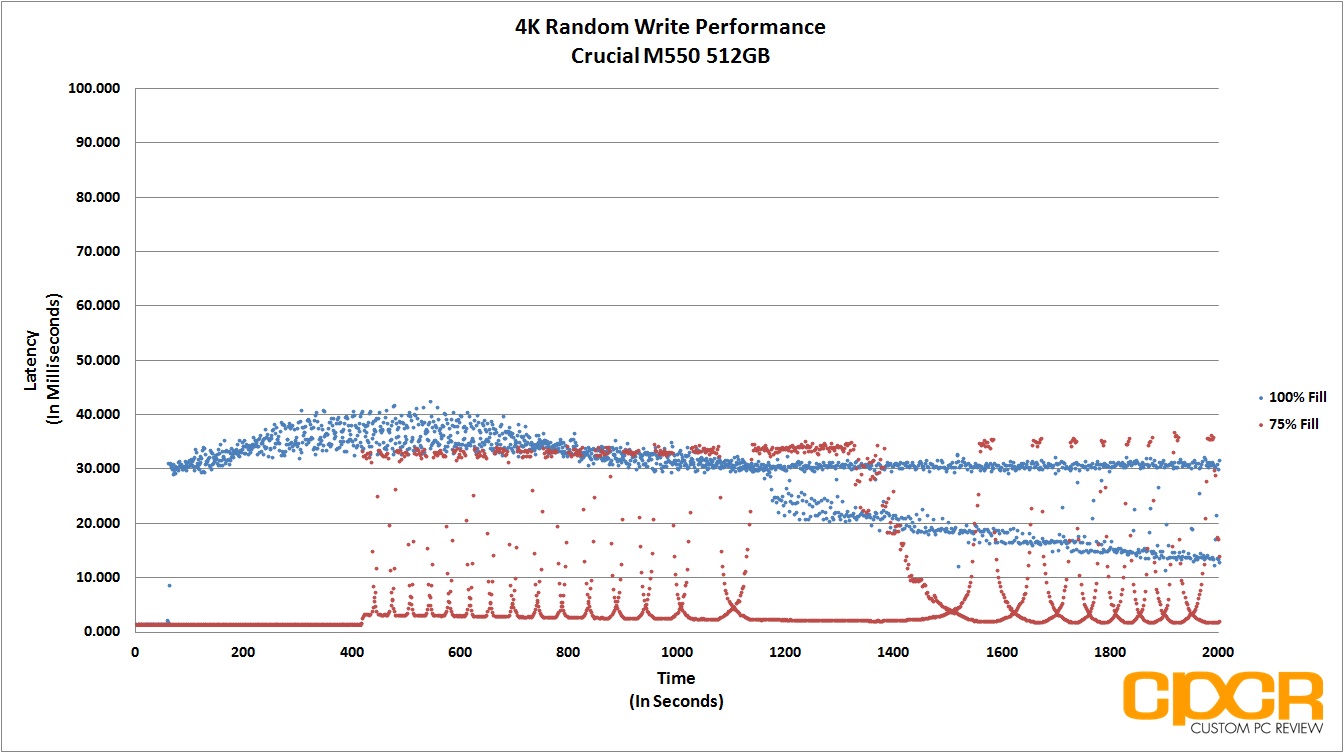
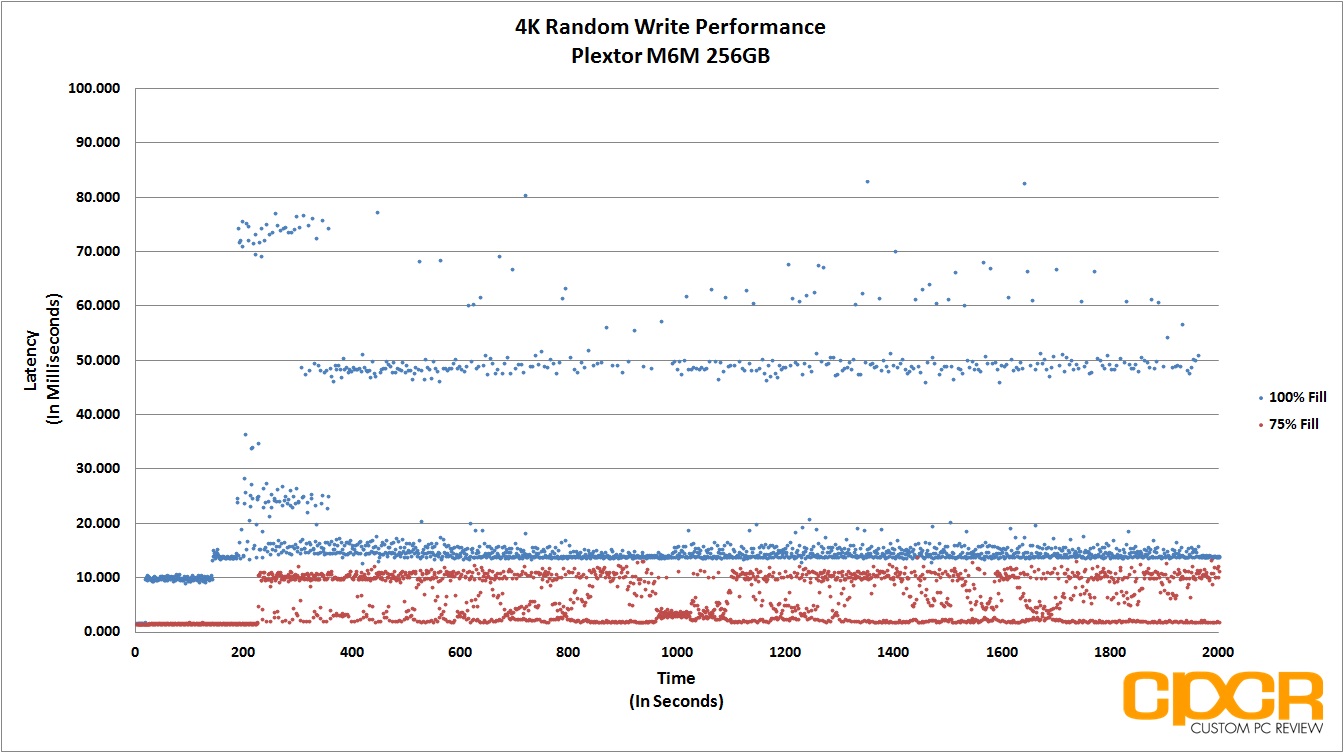
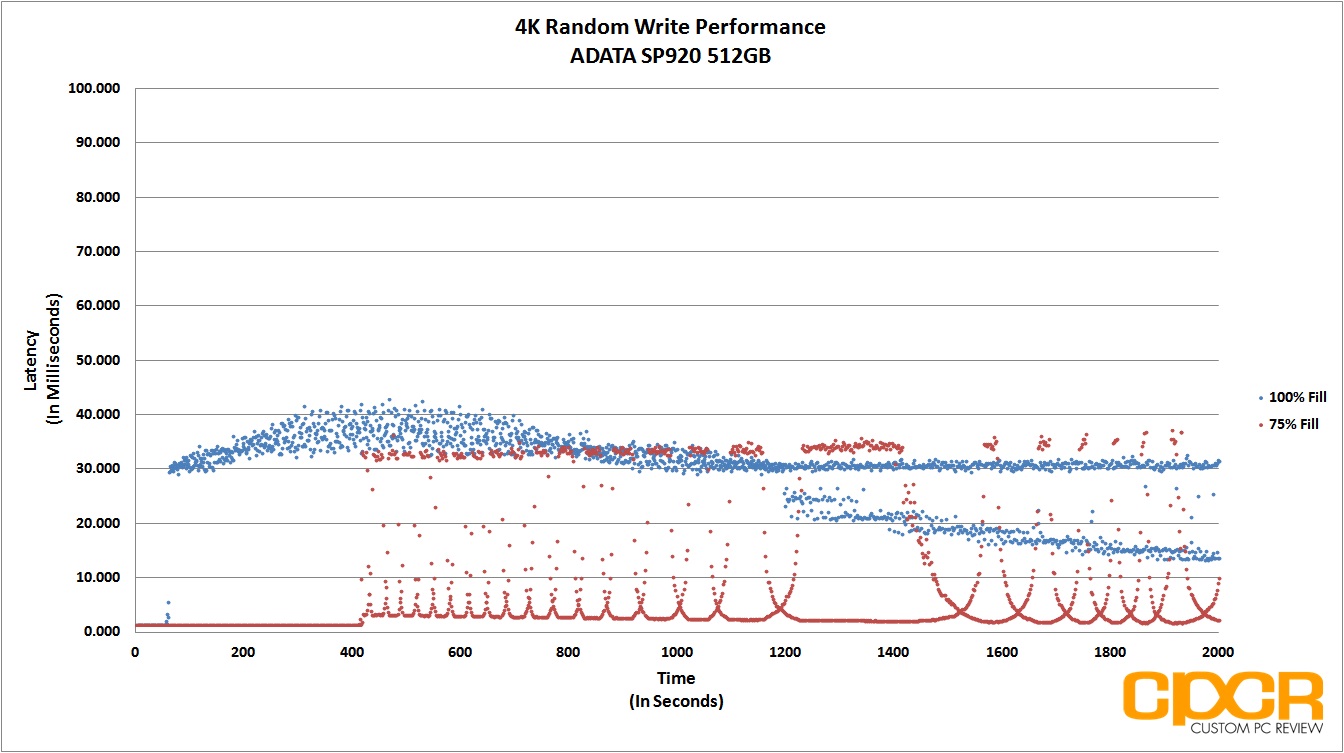
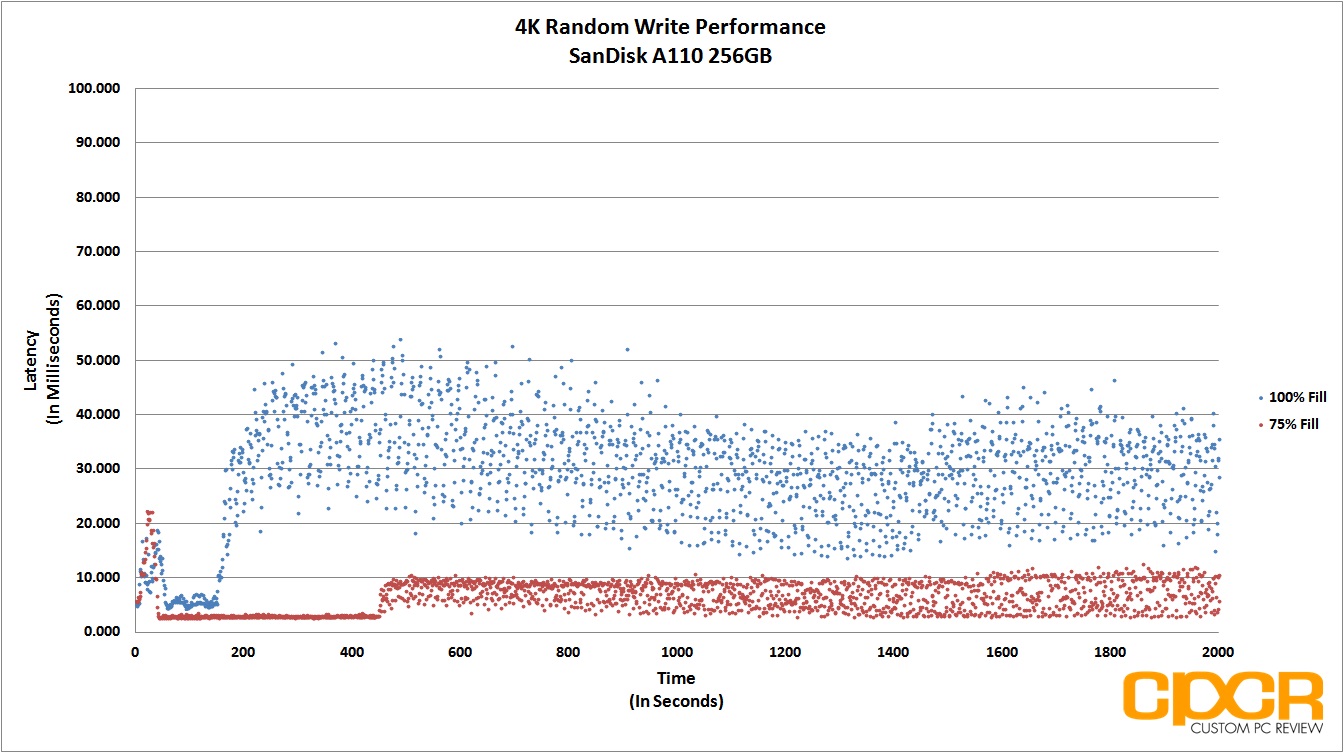
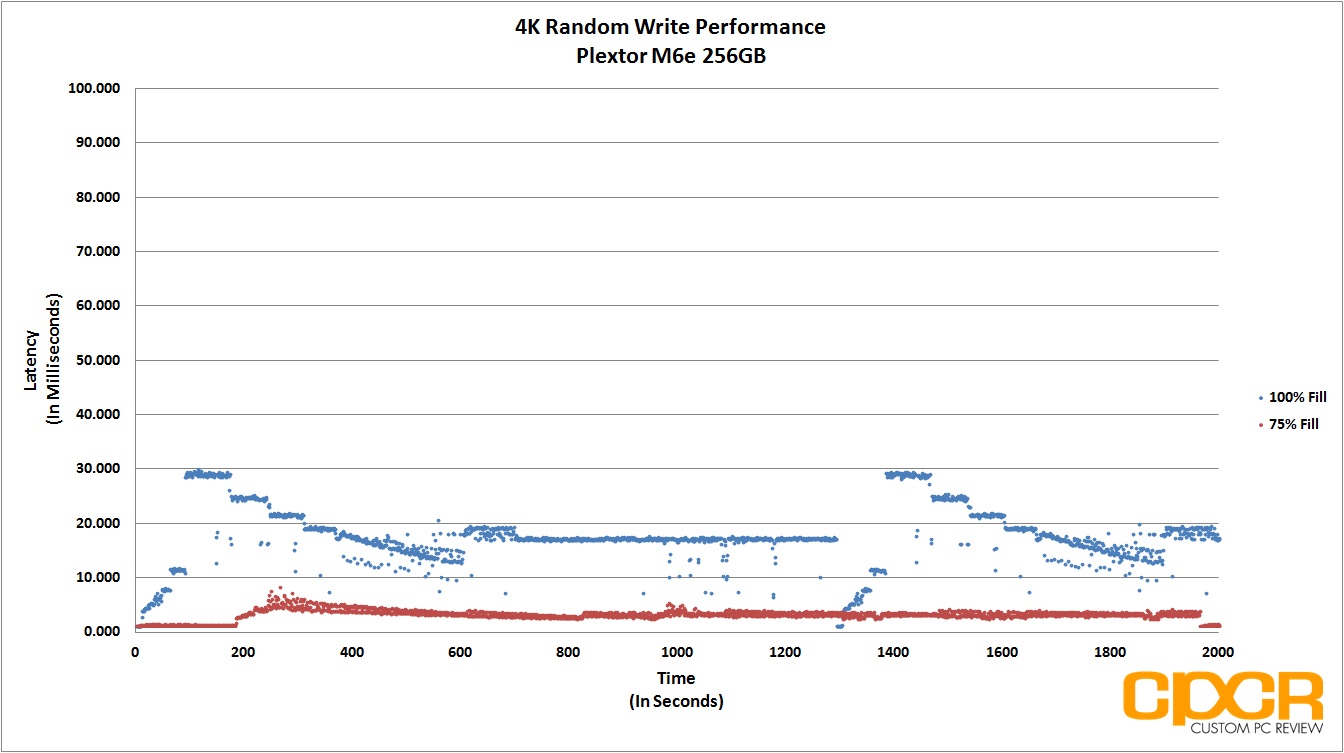
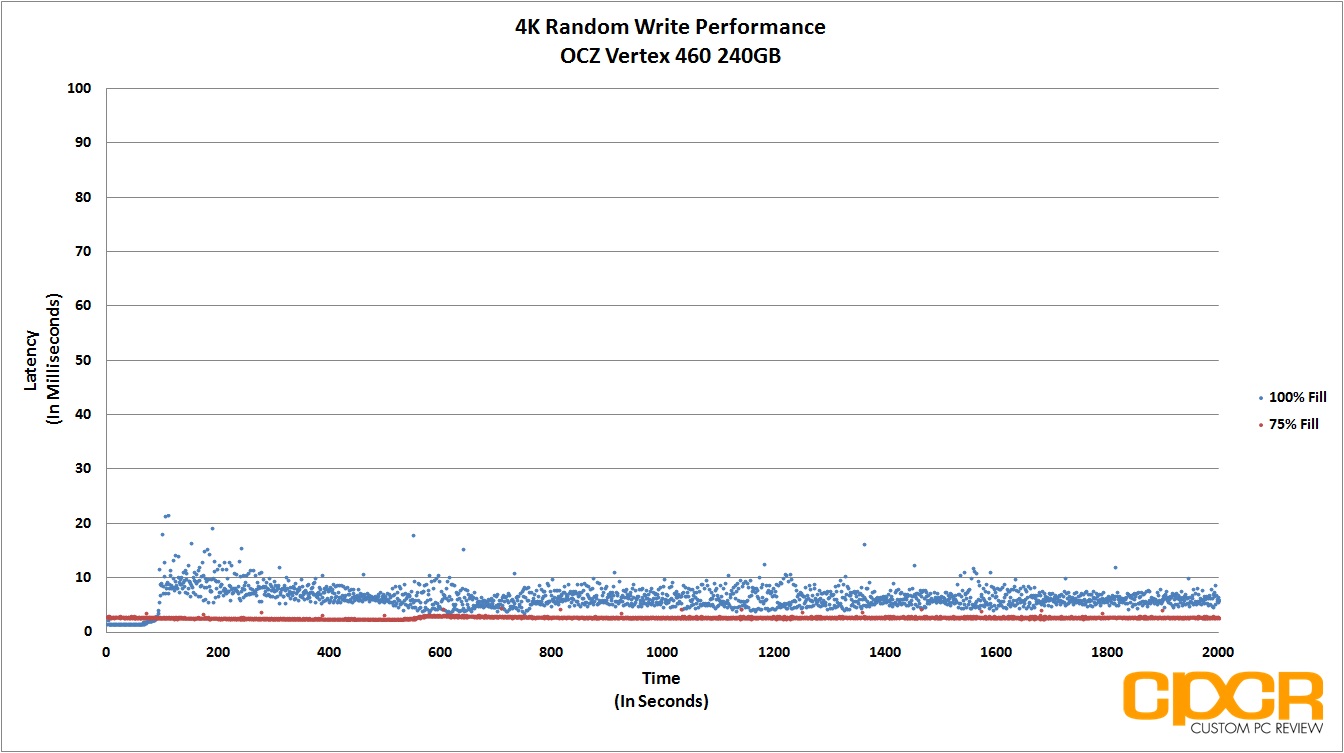
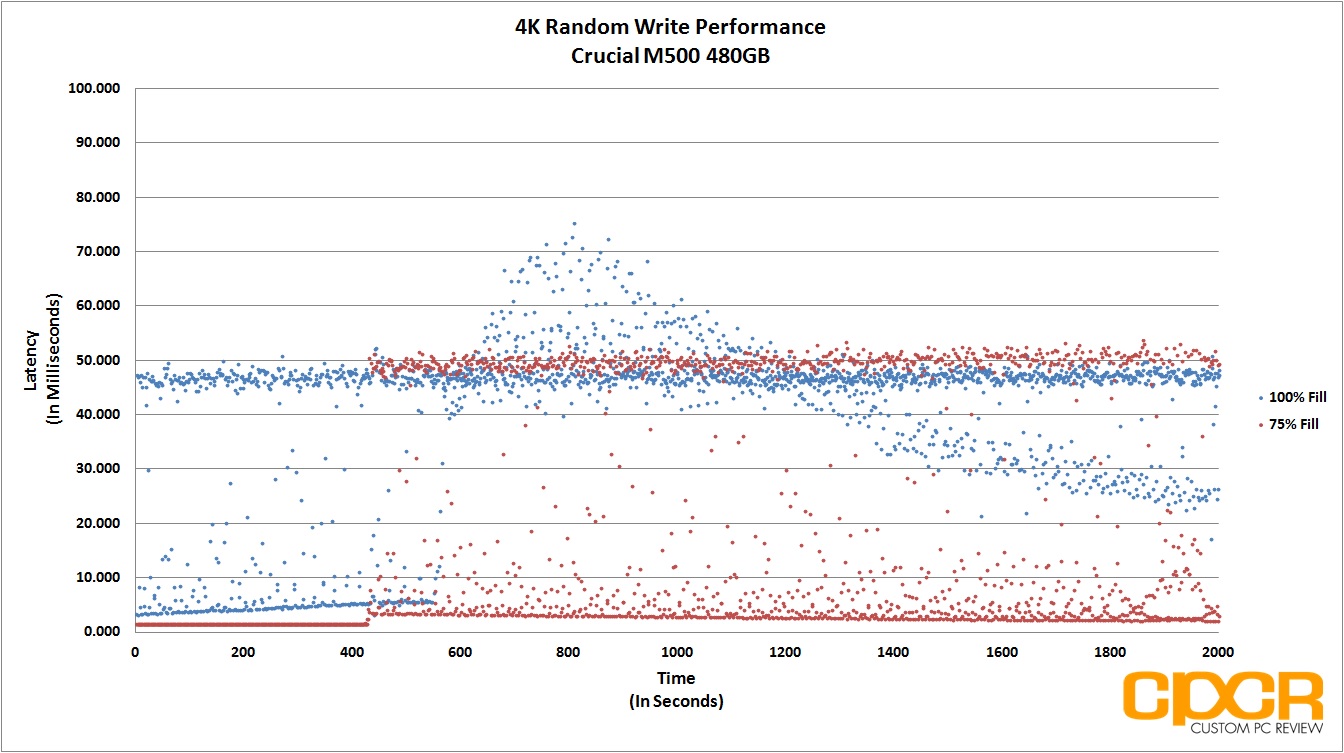
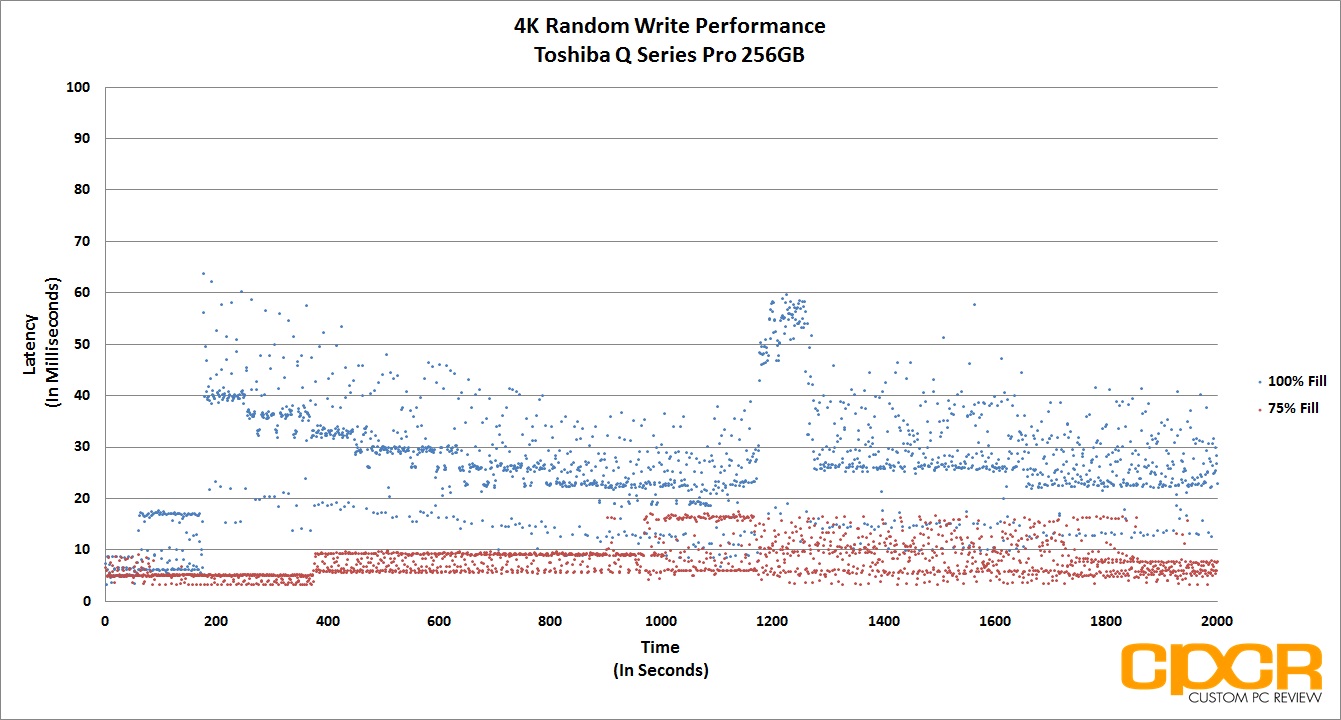

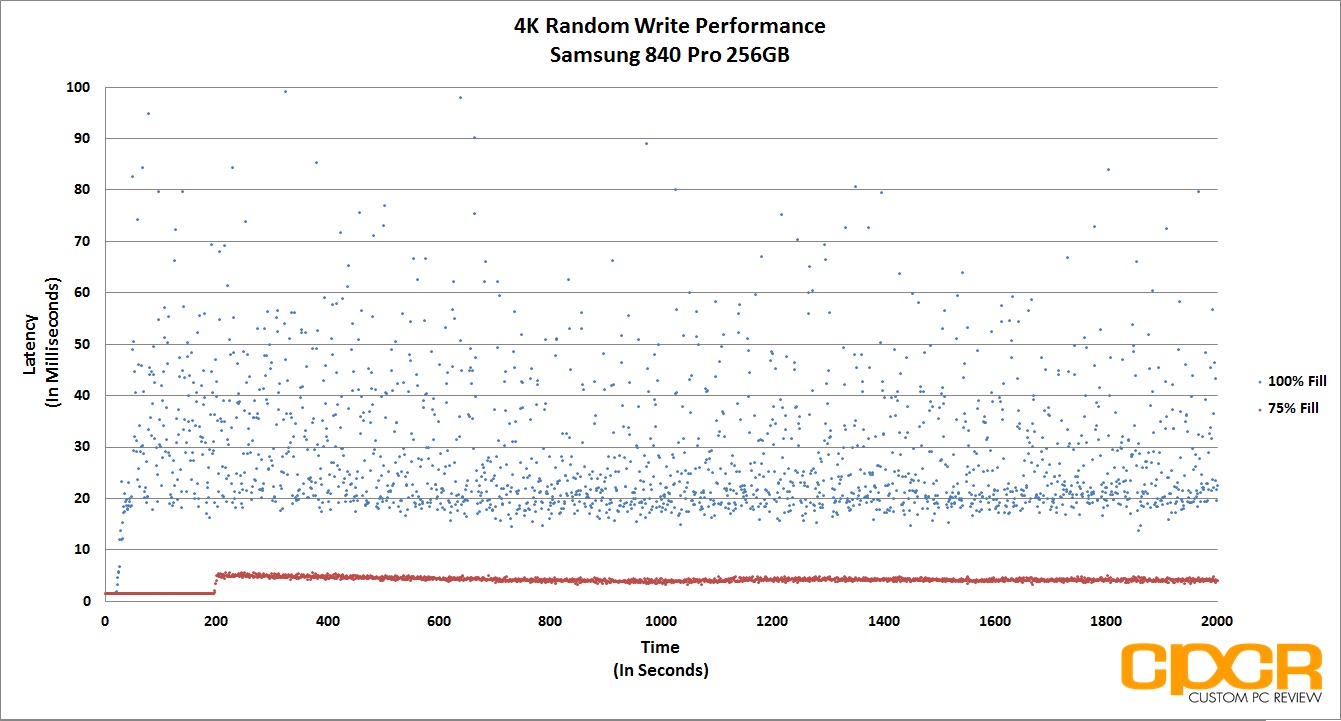
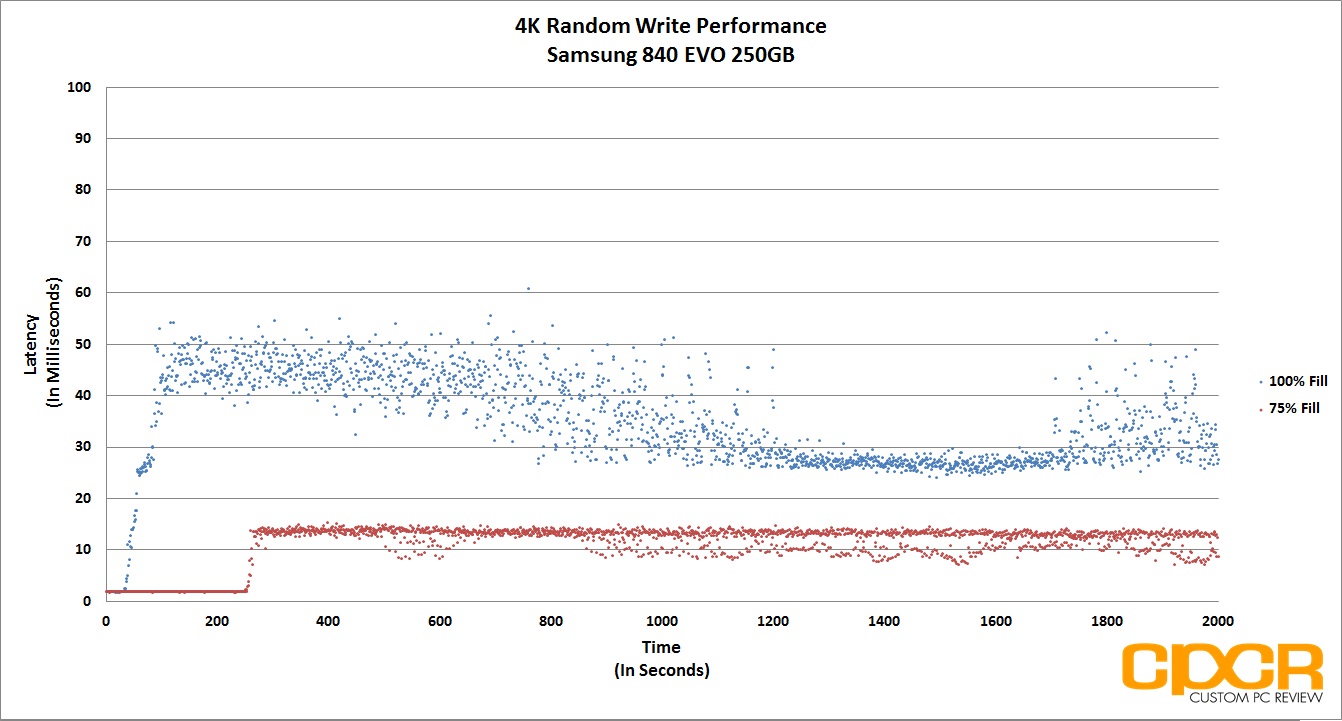
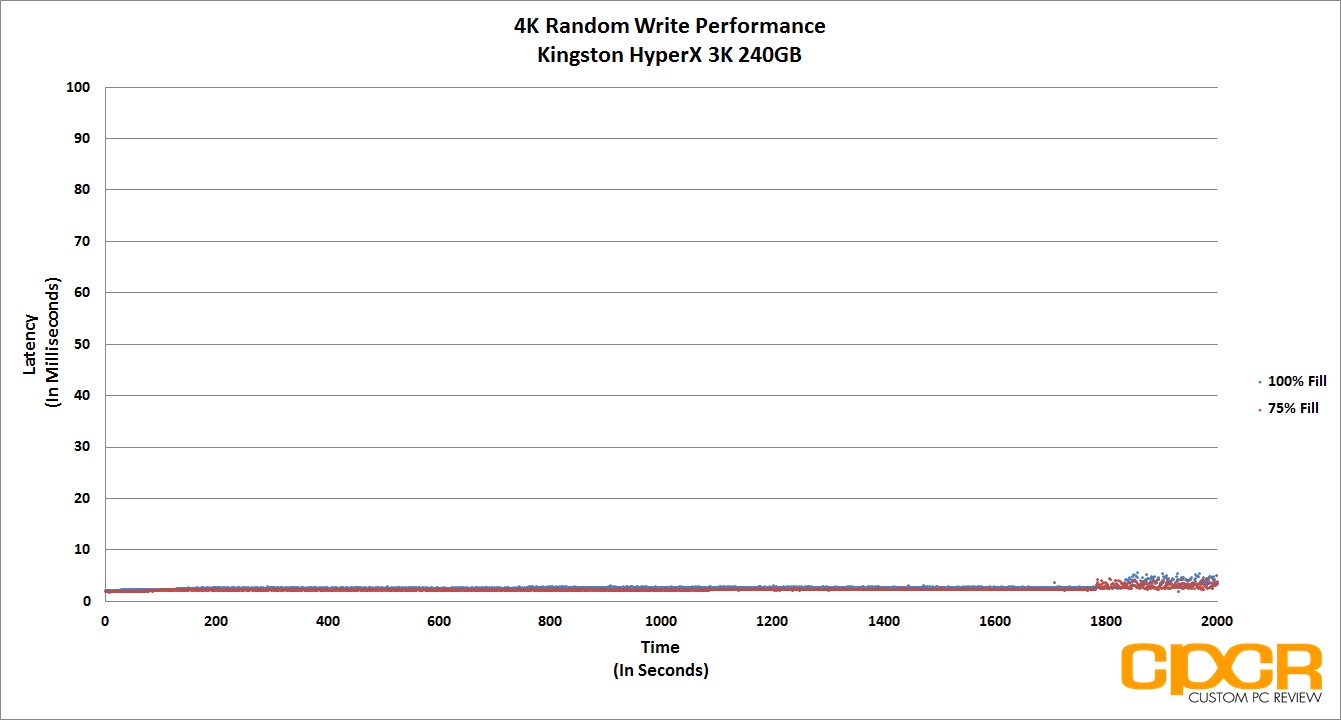
Performance Analysis
Latency is a huge problem with the OCZ Trion 100. Not only did the drive miss the ideal 50ms or under mark, it spent quite a bit of time around the 150ms mark which is not good. This will definitely impact user experience in heavier workloads.
[section label=”10. FIO – 128K Random Write”]
OCZ Trion 100 480GB Performance
FIO 128K Random Write Consistency Testing
In addition to testing 4K random write consistency, we’ll also test for 128K random write consistency to see how well a SSD is able to hold itself to a level of performance when getting hammered with larger file transfers.
Testing methodology is very similar to our testing for 4K random write consistency. We use a fairly standard method, which includes both filling up 75% of capacity as well as 100% capacity twice with sequential 128k data followed by the actual test itself, which is running 128K random writes at a queue depth of 32. By recording the IOPS every second for 2,000 seconds, we’re able to get a good look at what kind of performance can be expected when the drive is relatively new, when it’s heading towards steady state, and when it’s actually in steady state.
[tabgroup]
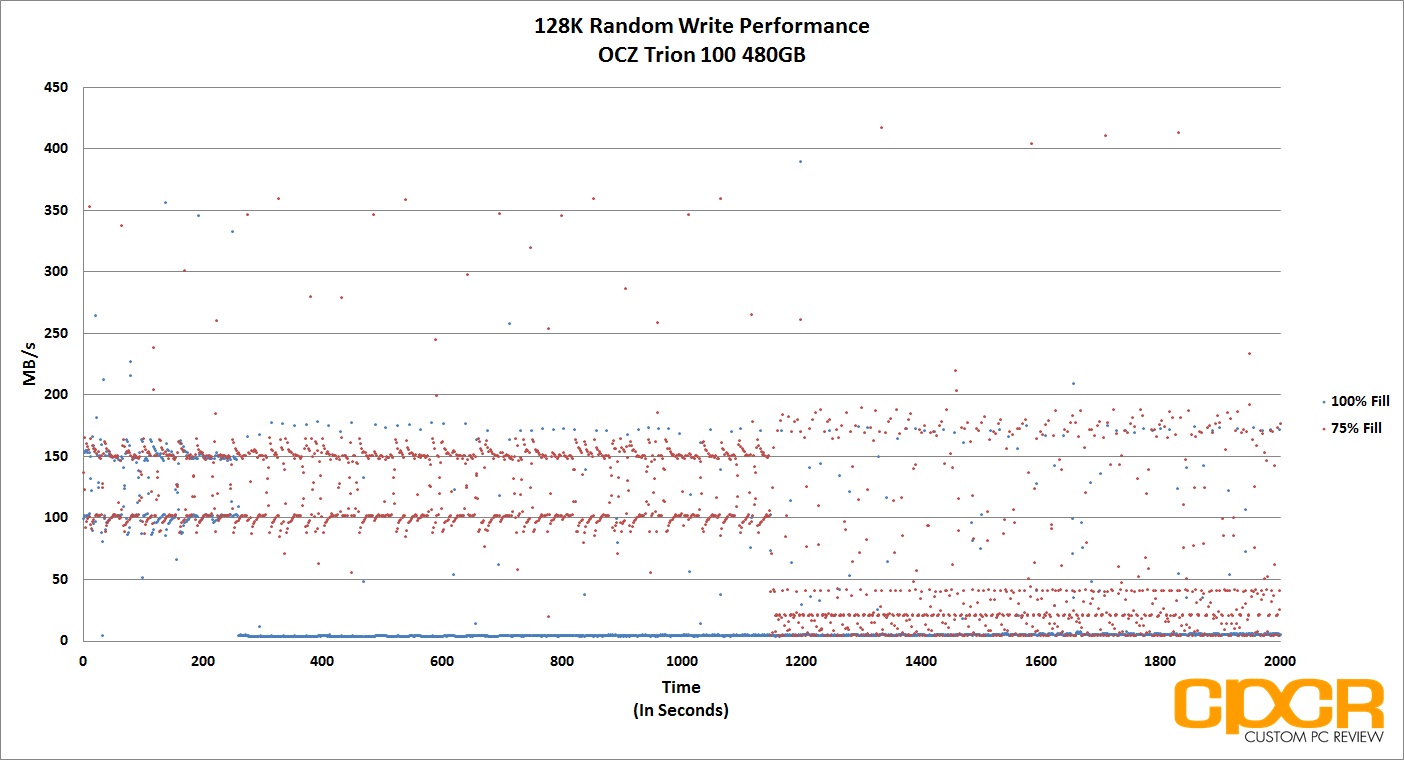
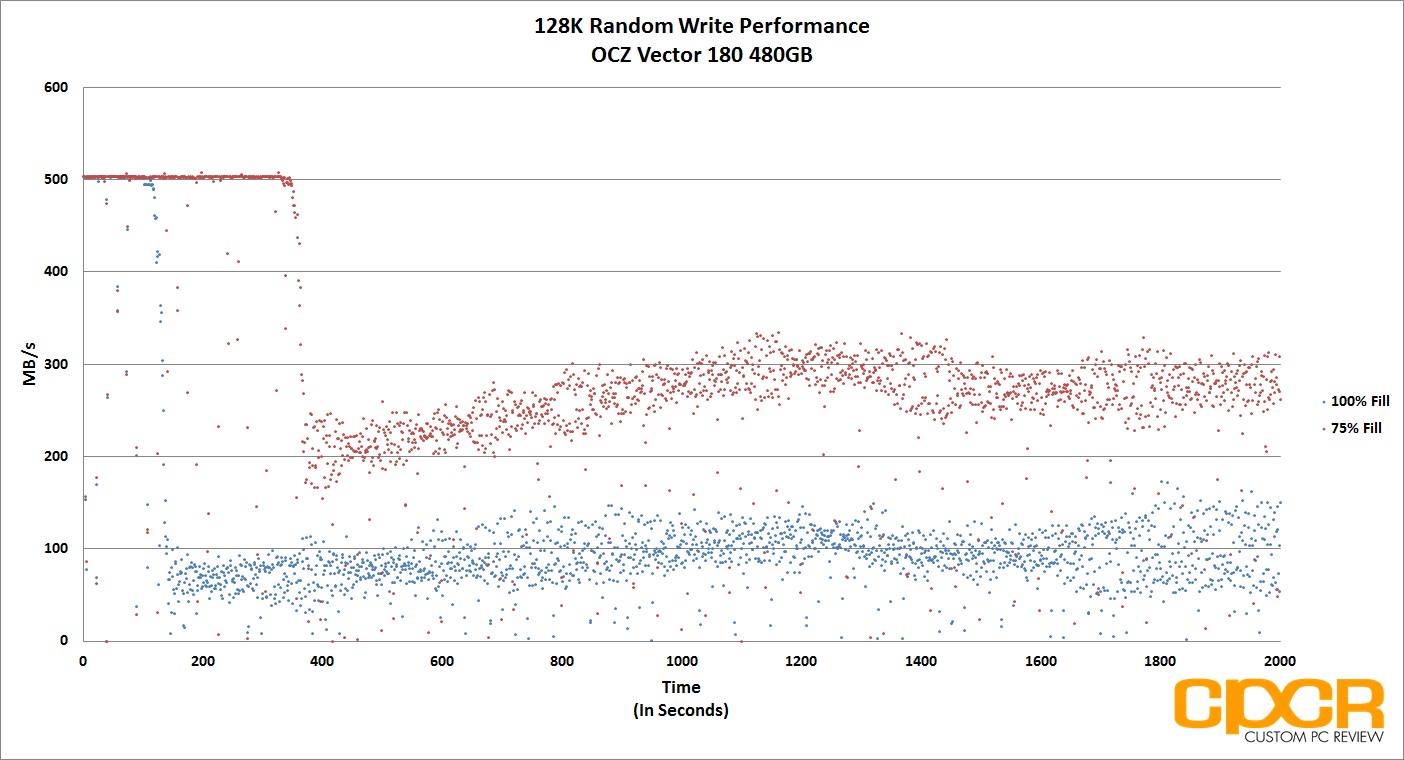
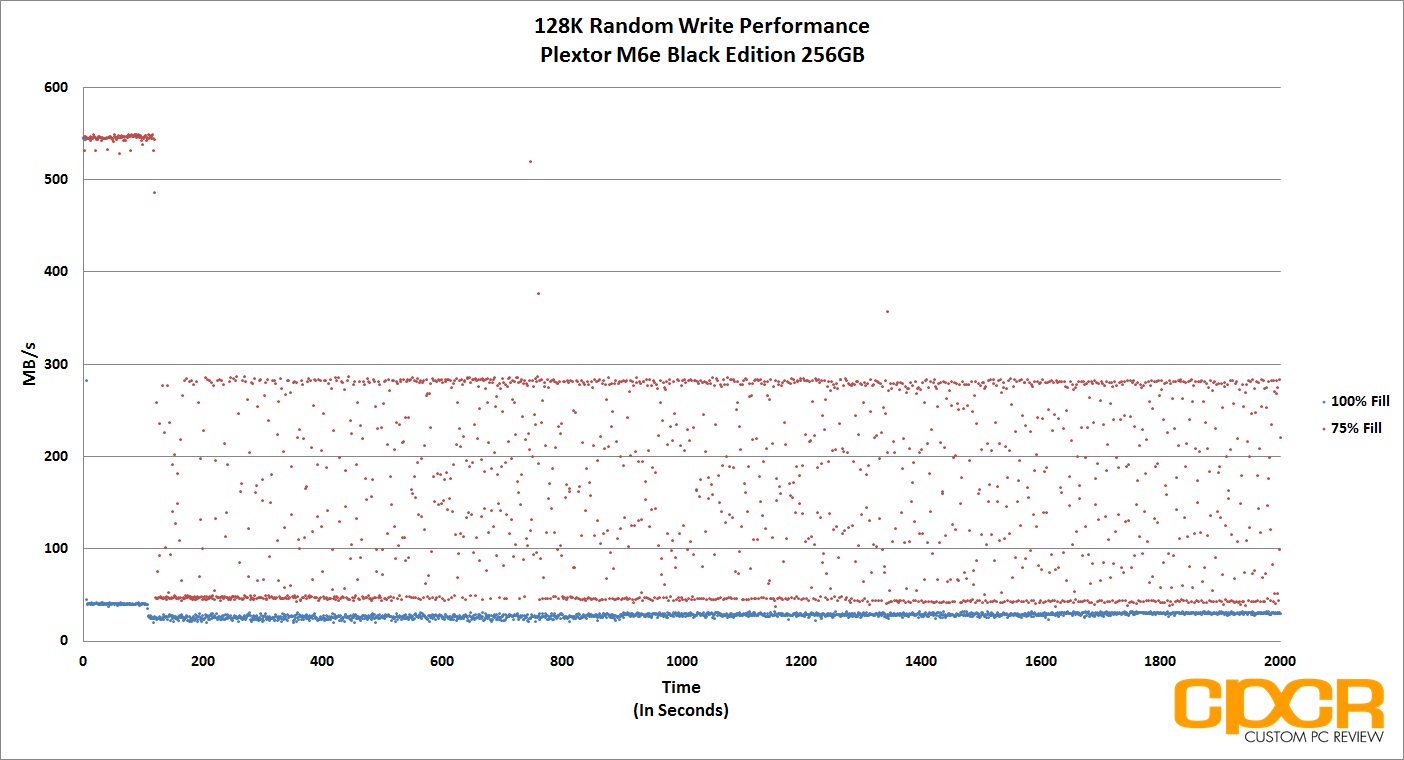
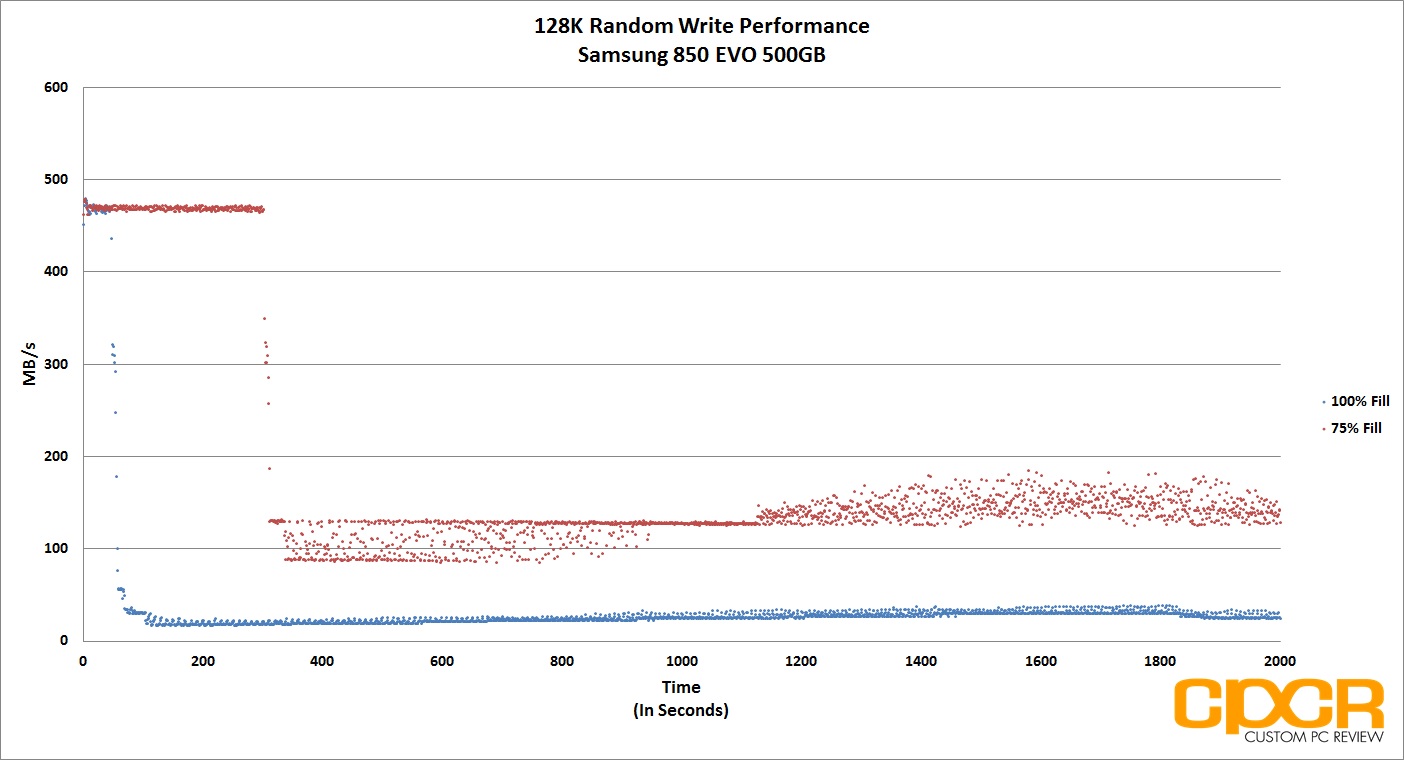
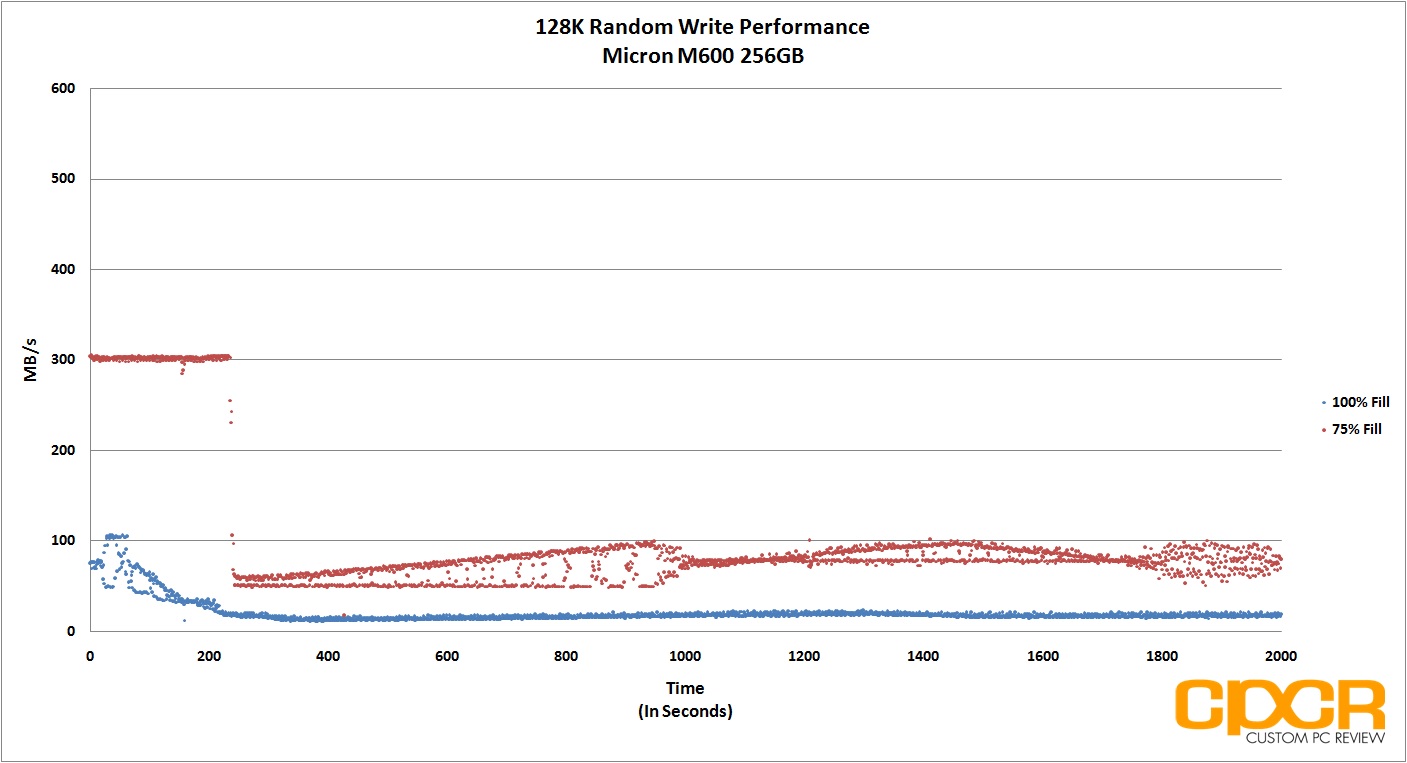
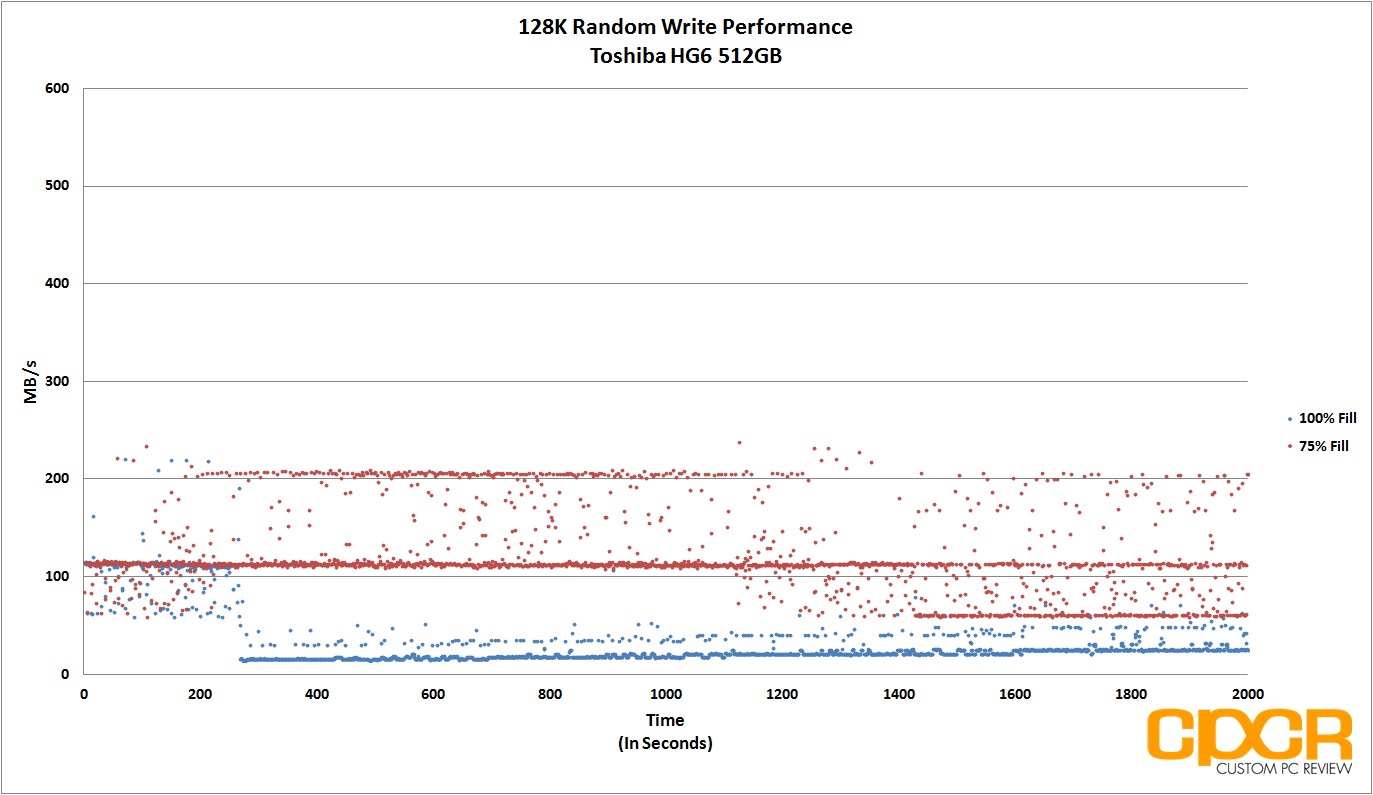
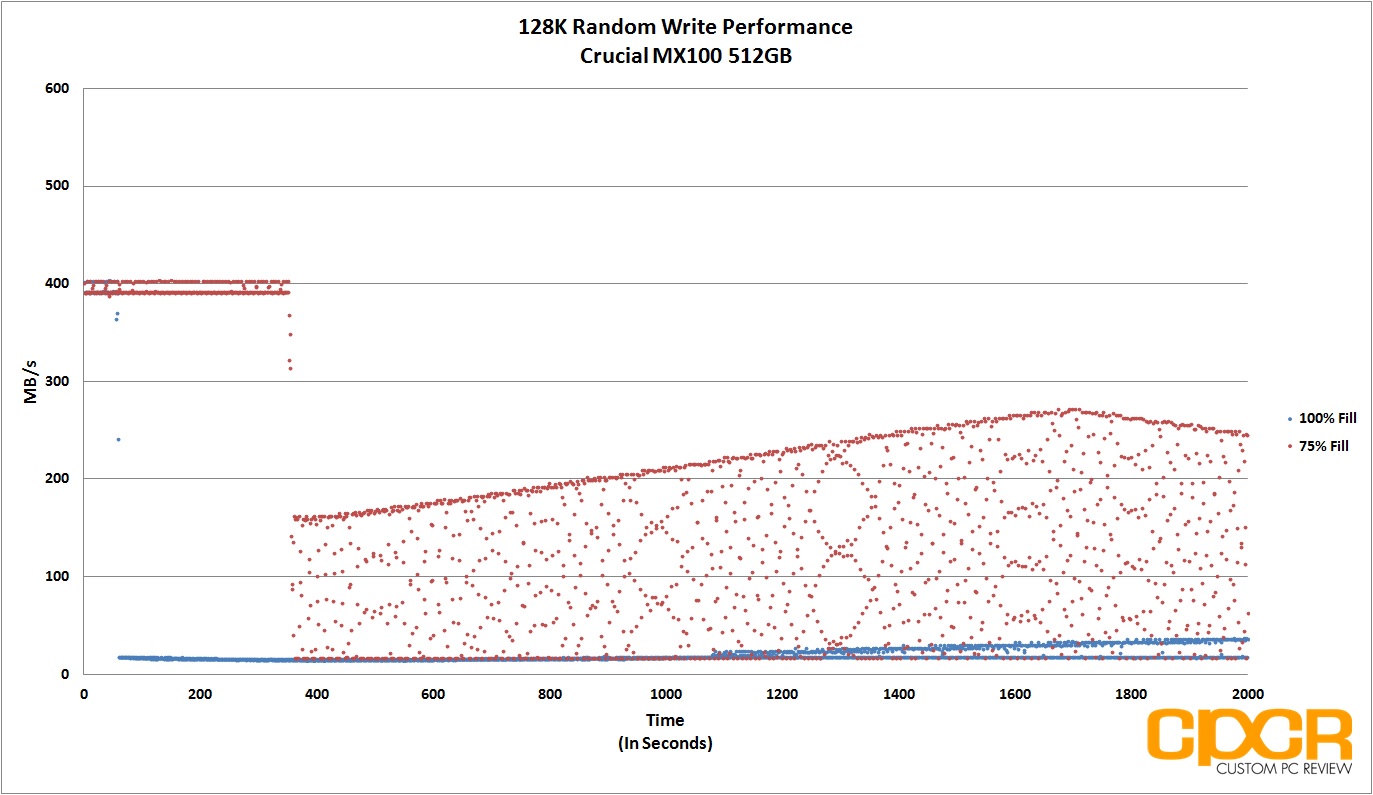
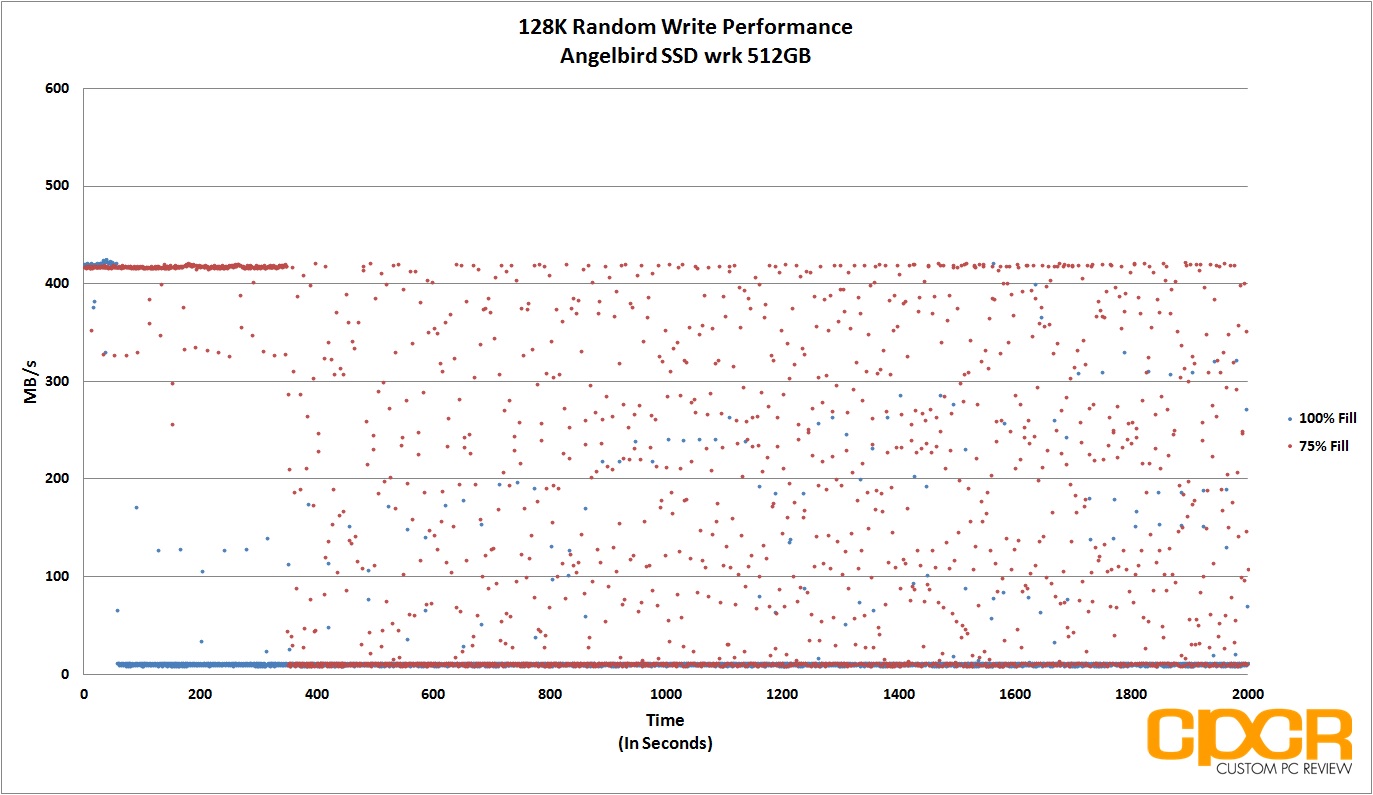

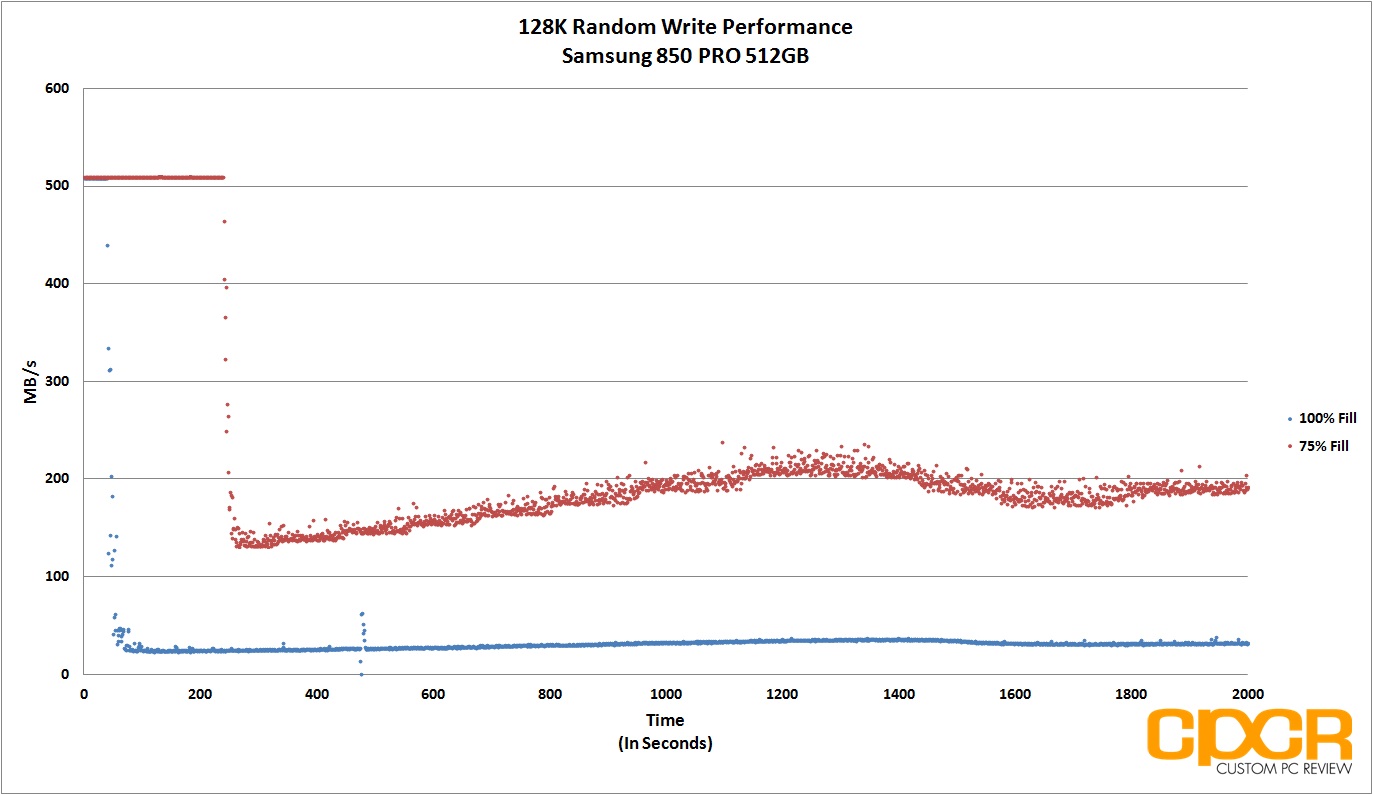
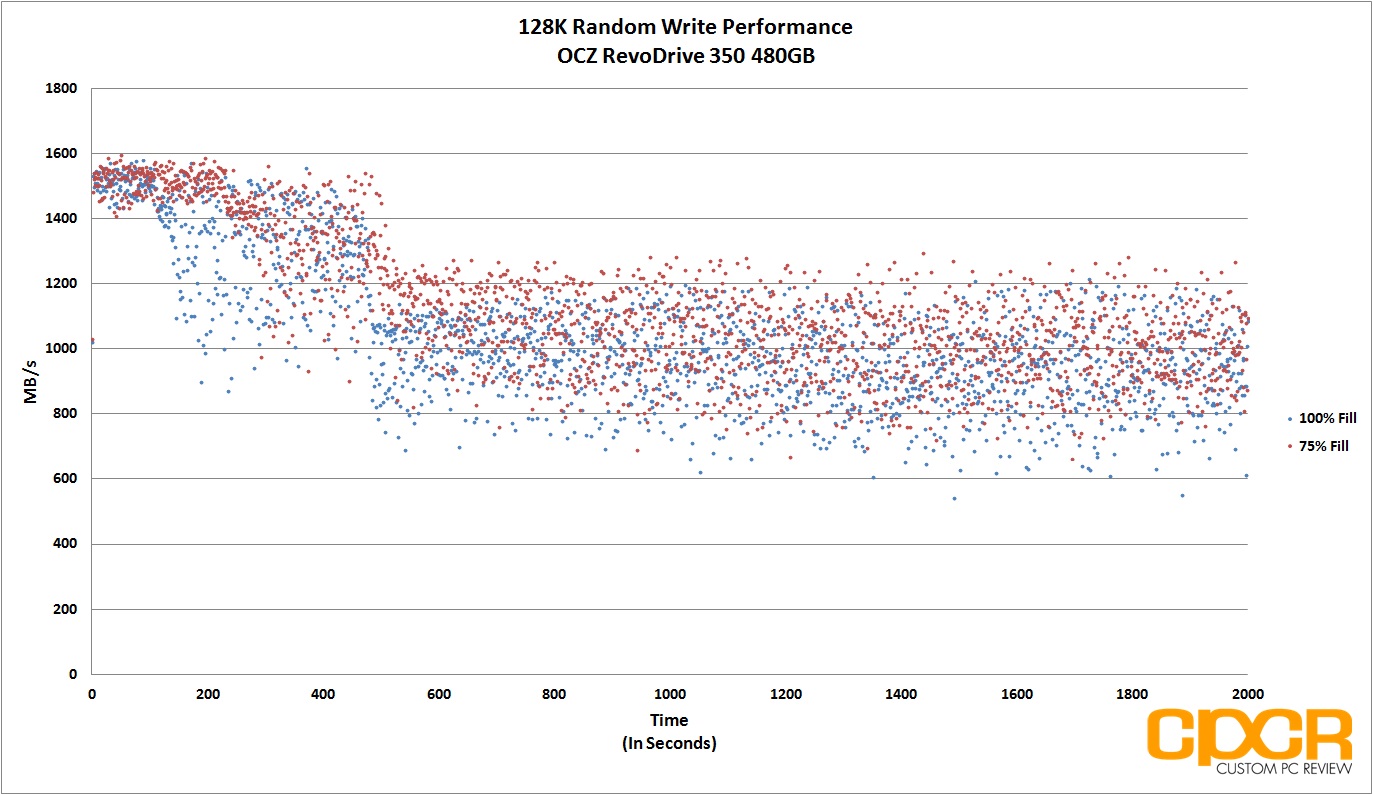
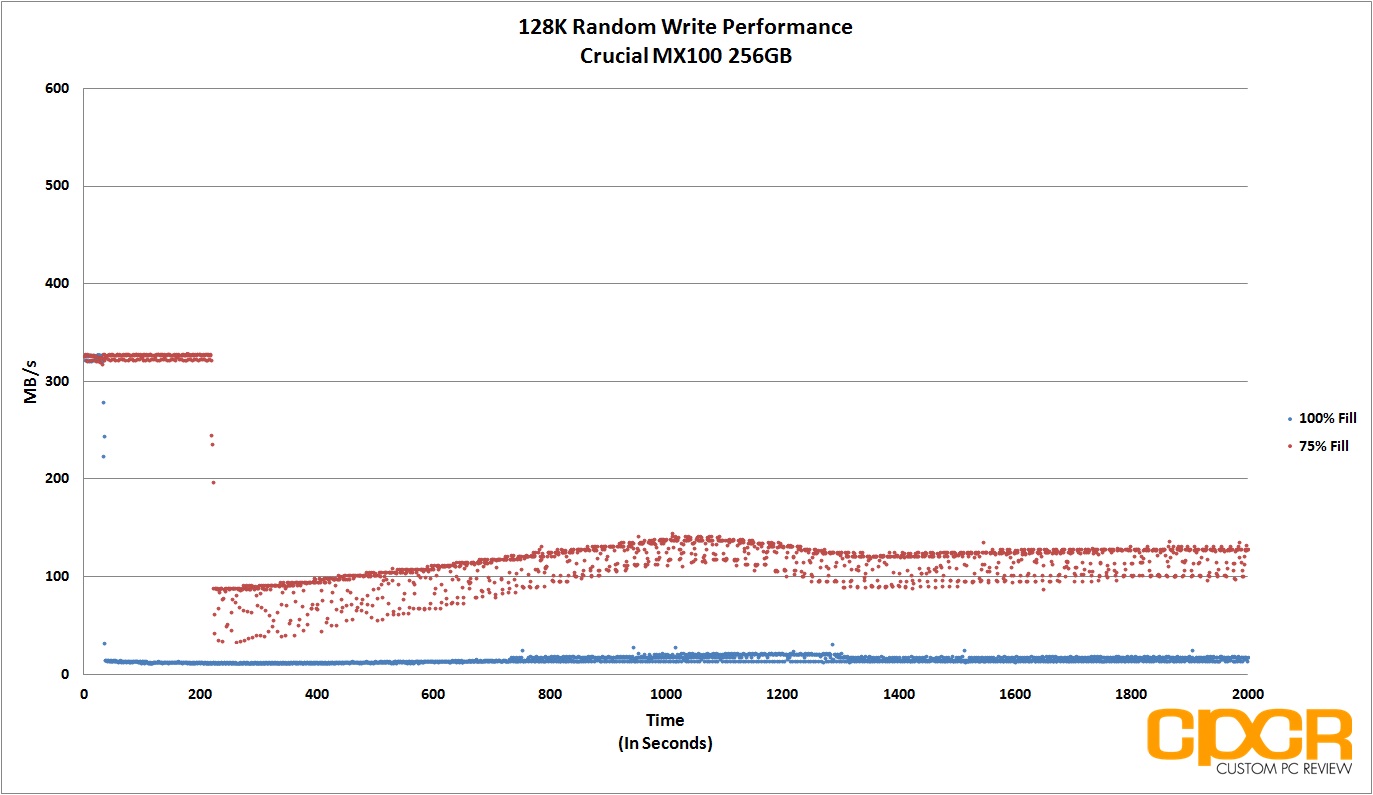
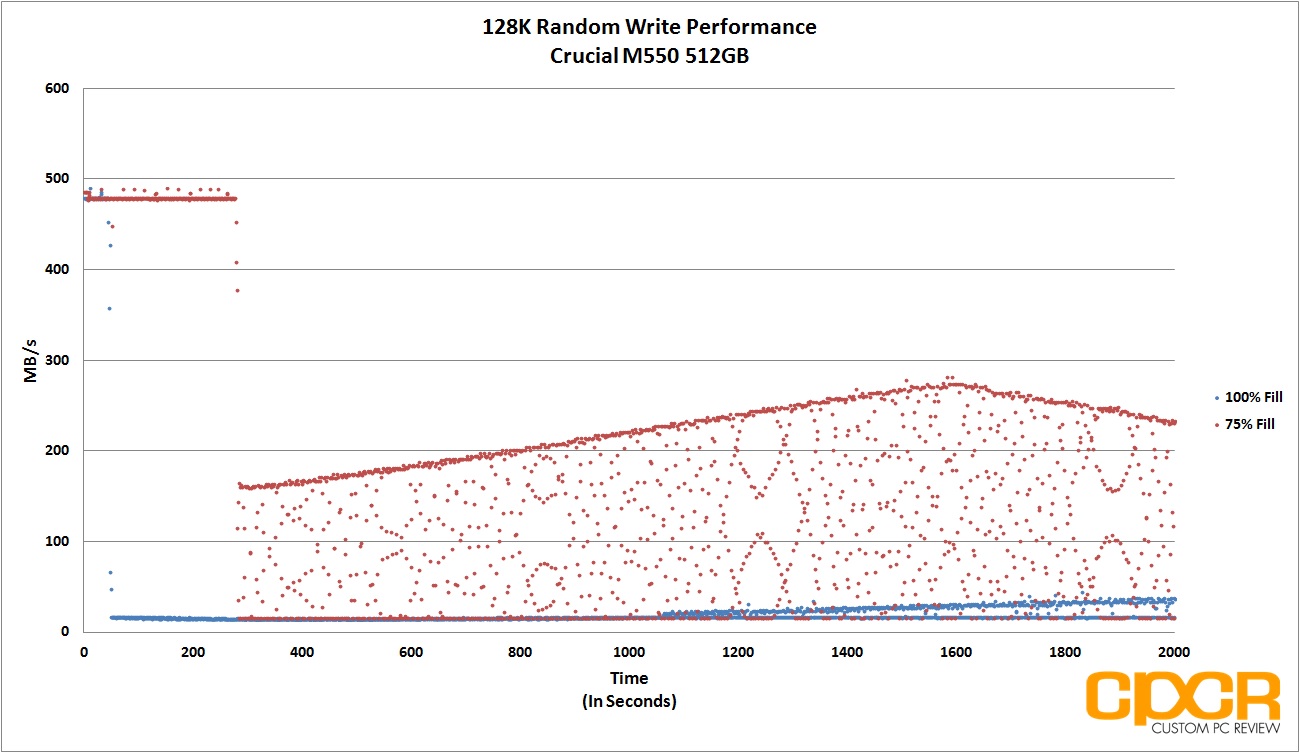
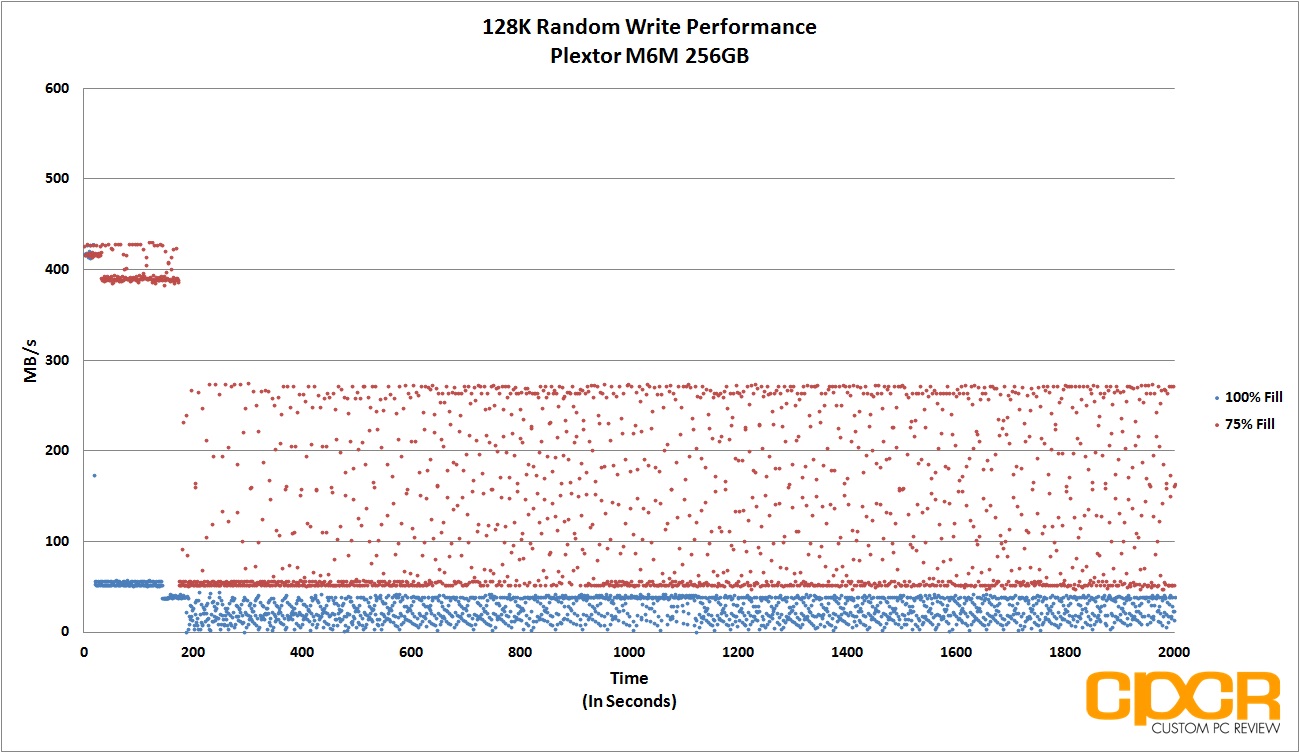
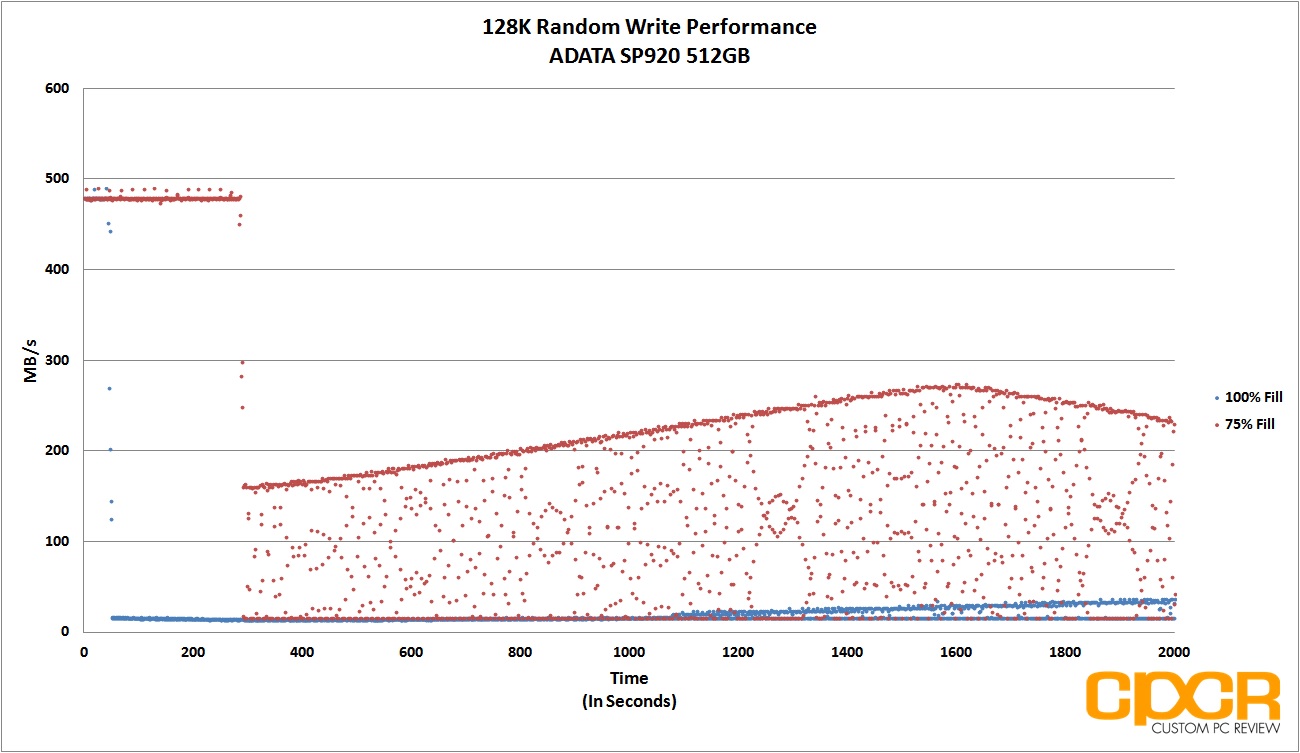
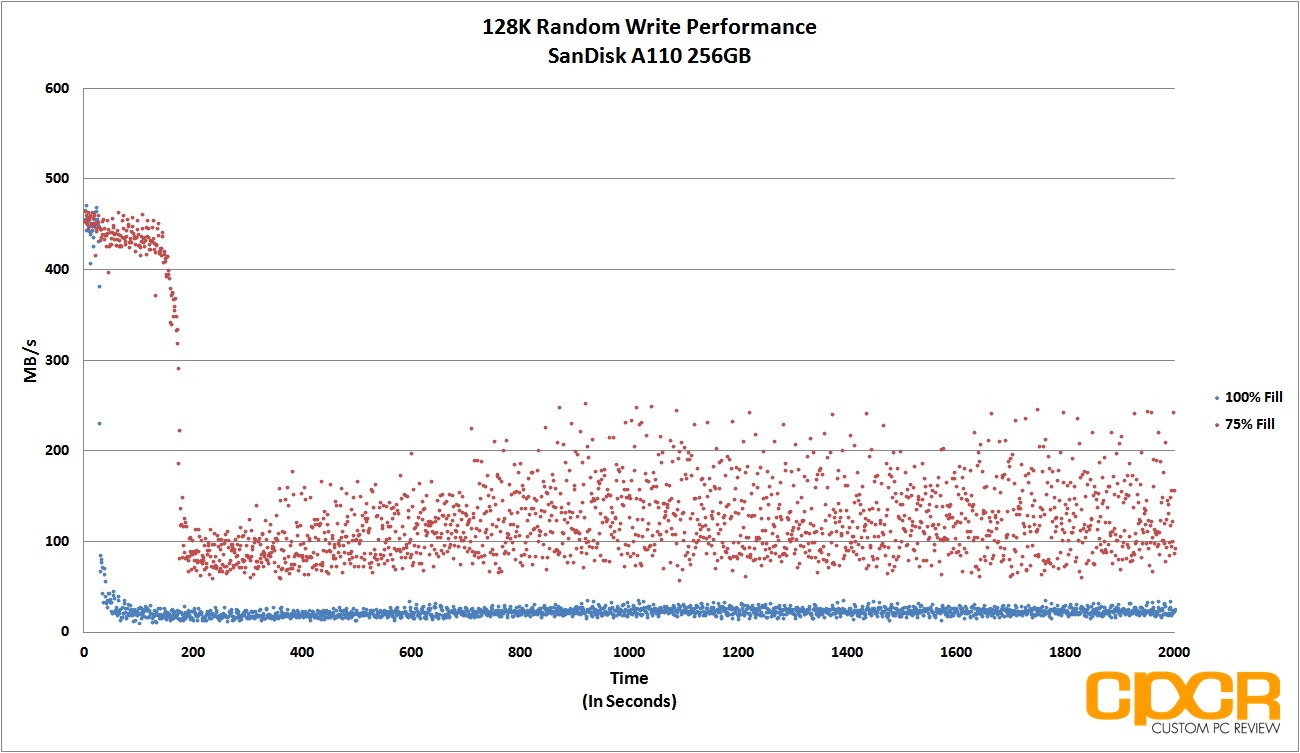
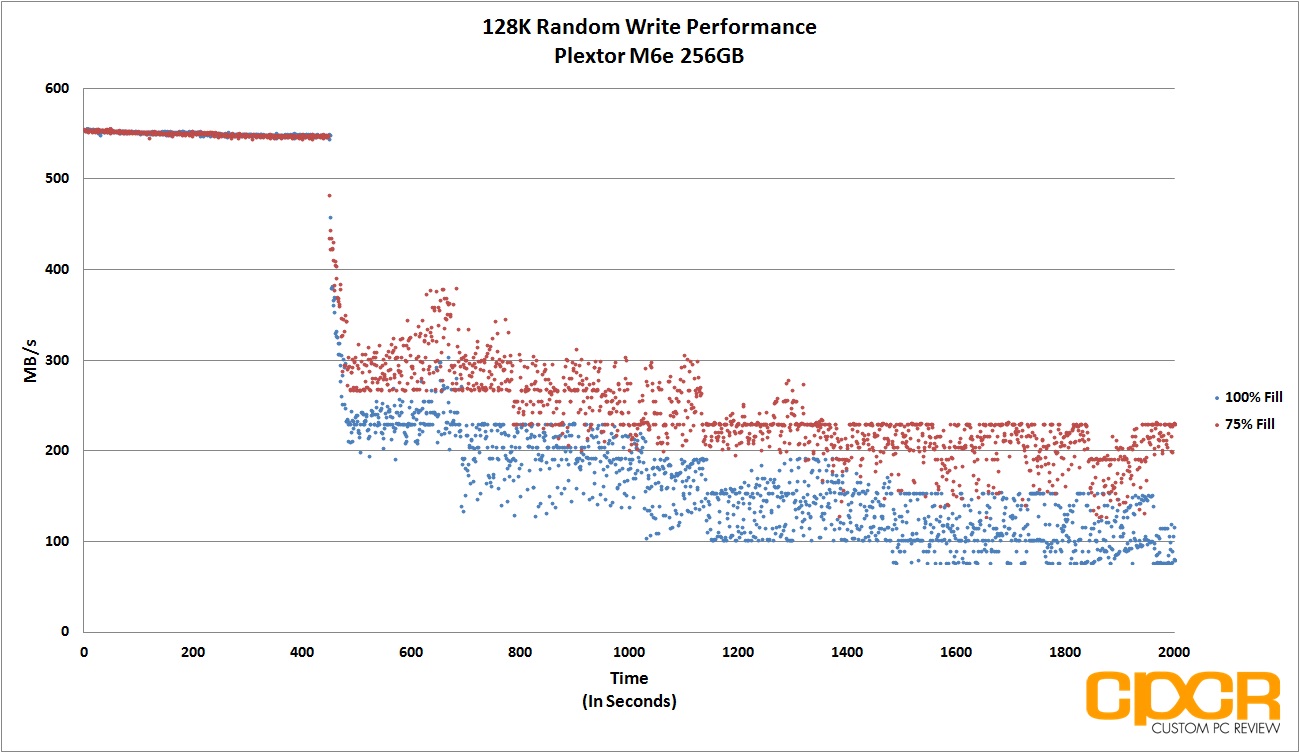
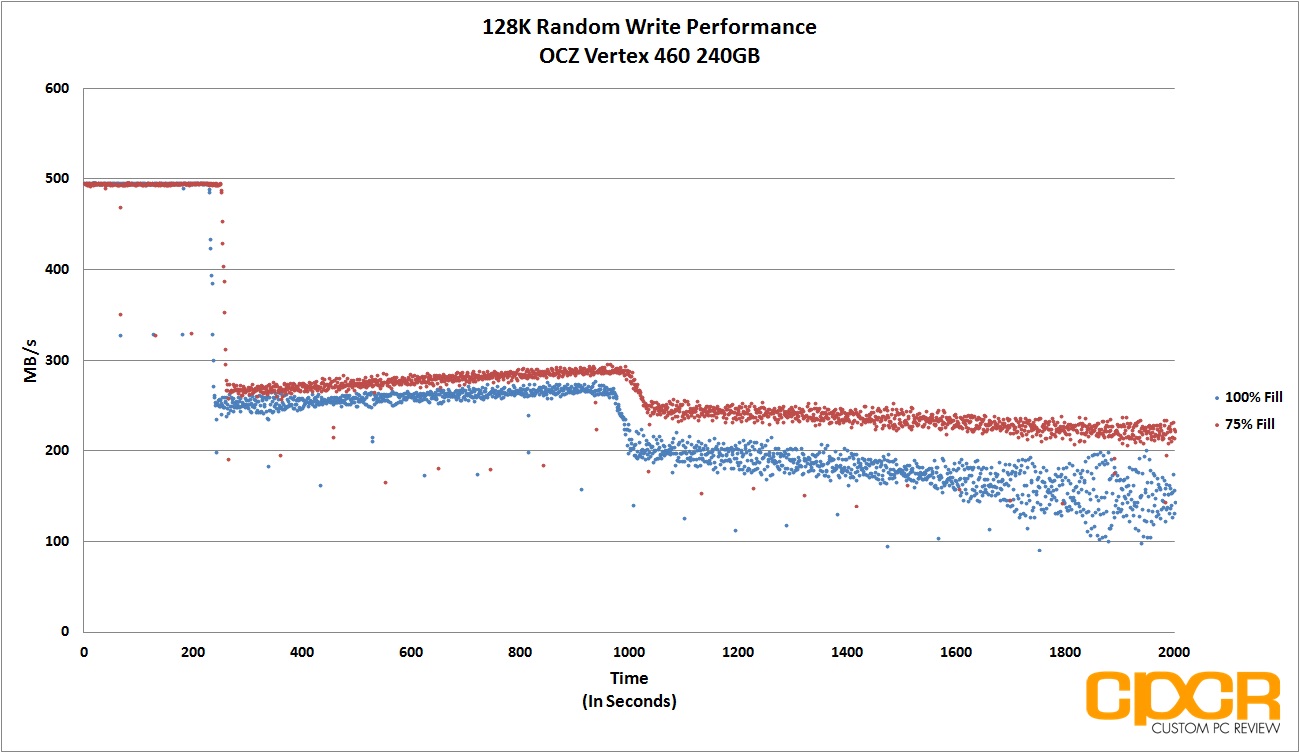
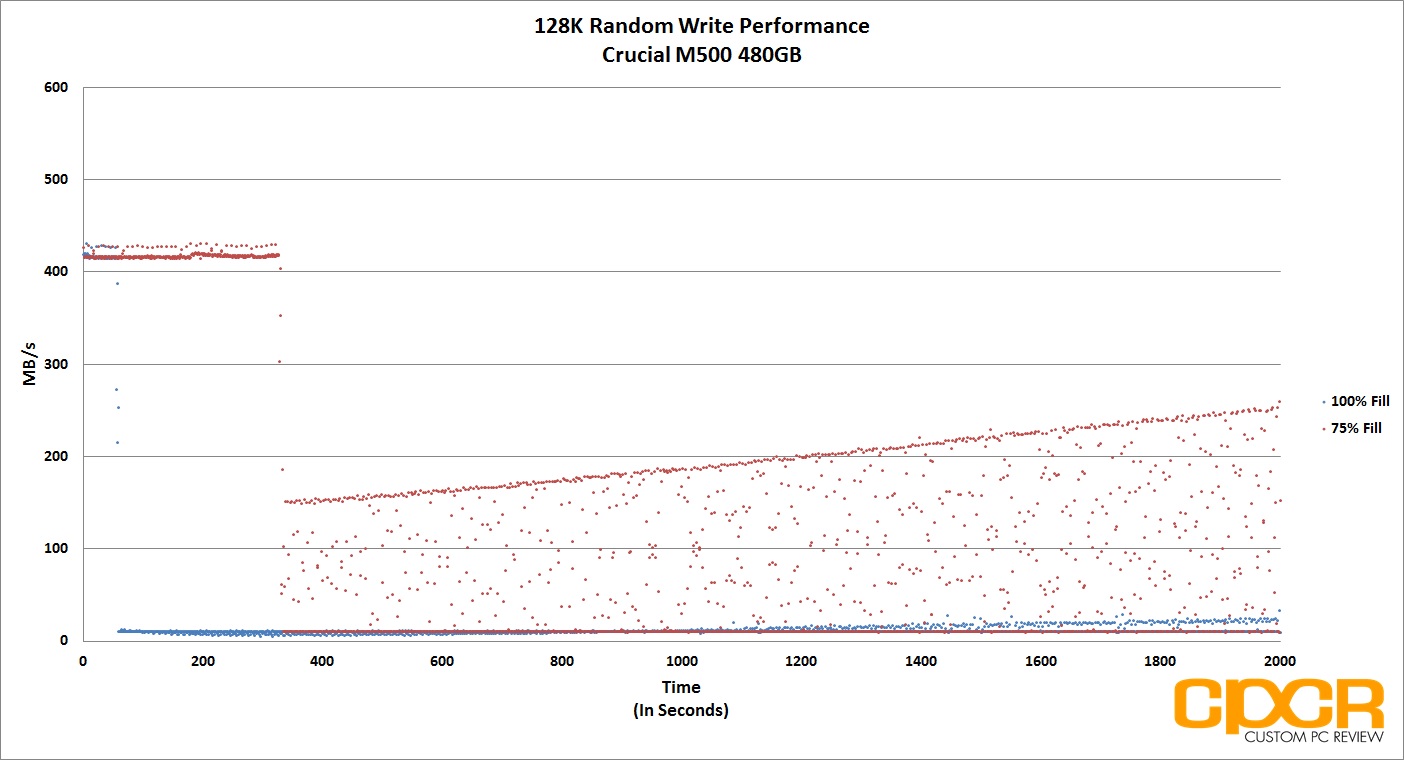
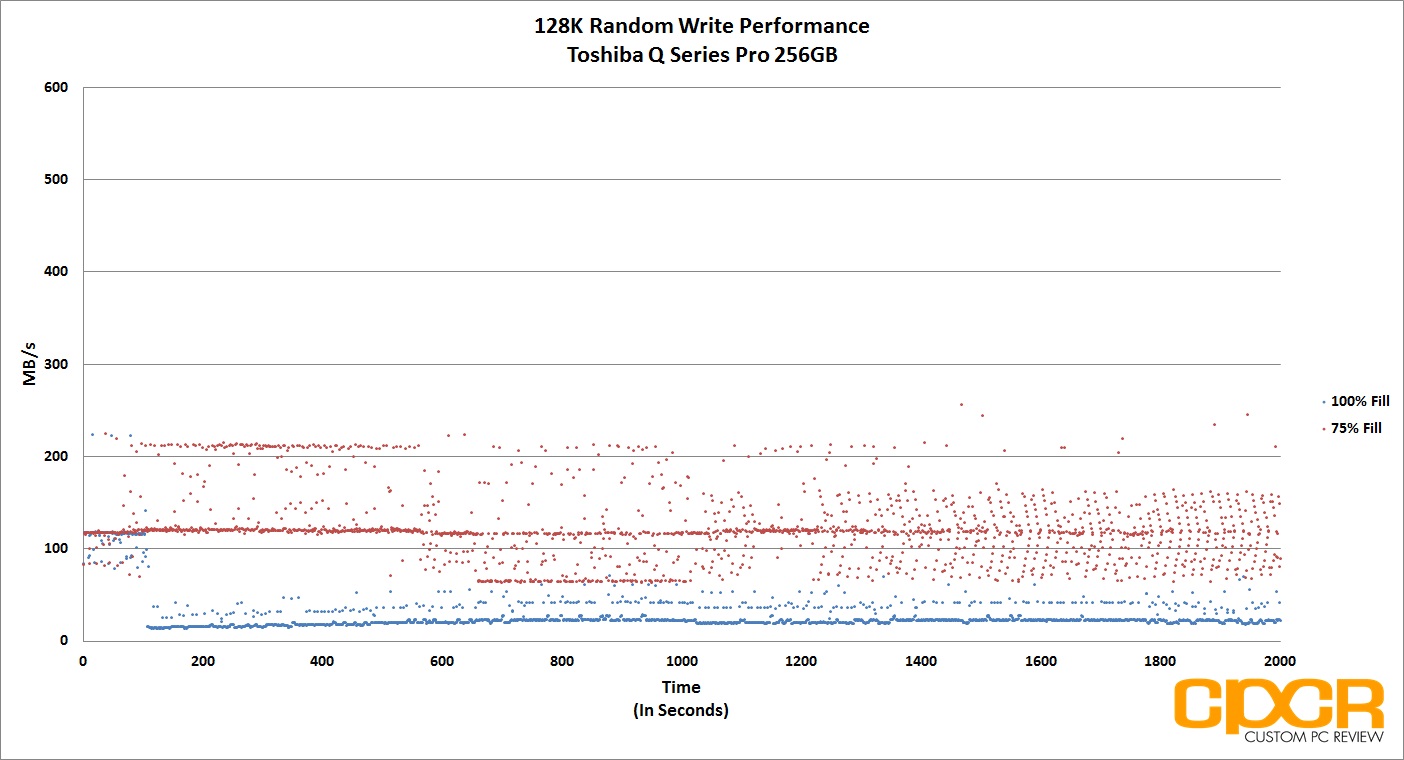
Performance Analysis
With 128K writes, the OCZ Trion 100 does slightly better on consistency, but performance becomes the big problem. As the drive reaches steady state with 100% fill, performance averages a mere ~4MB/s – a performance level that’s even slower than a hard drive. At 75% fill, performance is slightly better (between ~4MB/s – 200MB/s), but consistency still needs some work.
[section label=”11. Power Consumption”]
OCZ Trion 100 480GB Power Consumption
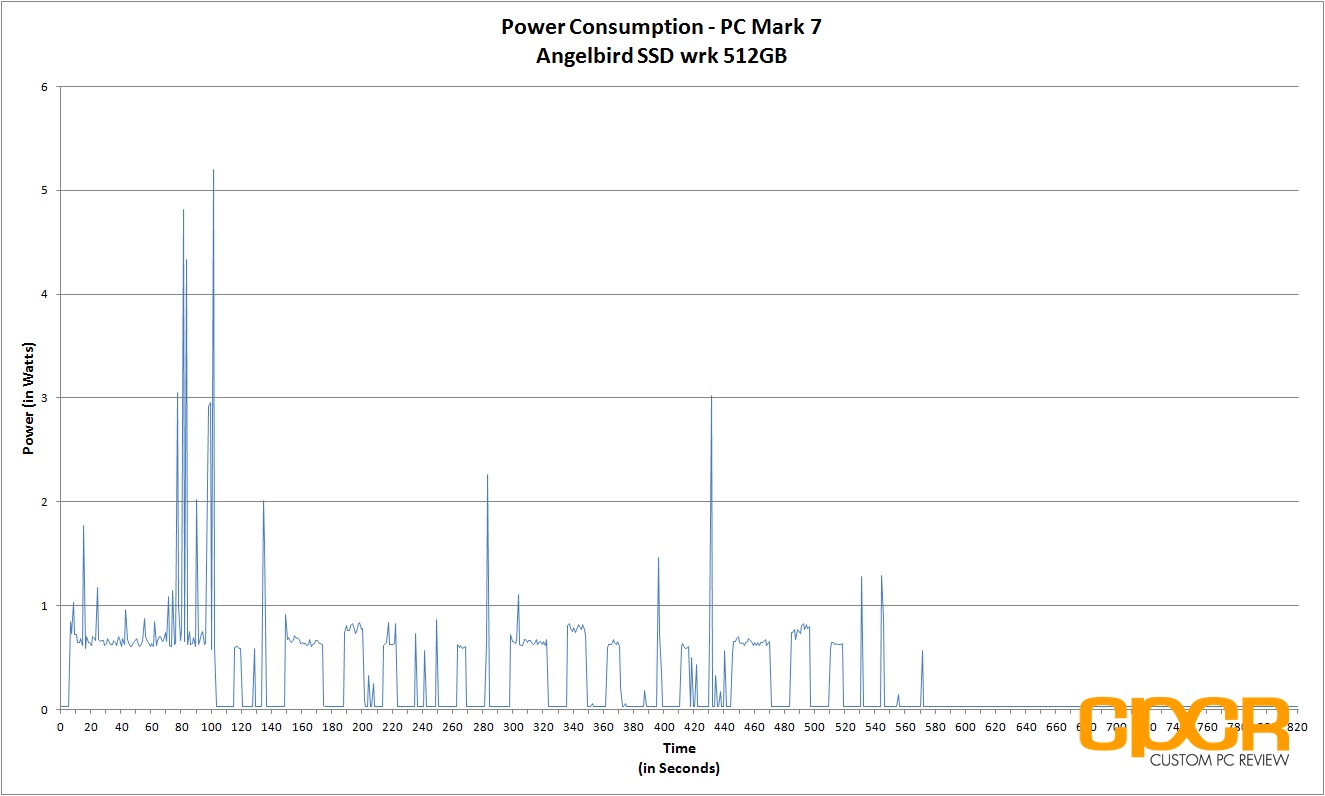
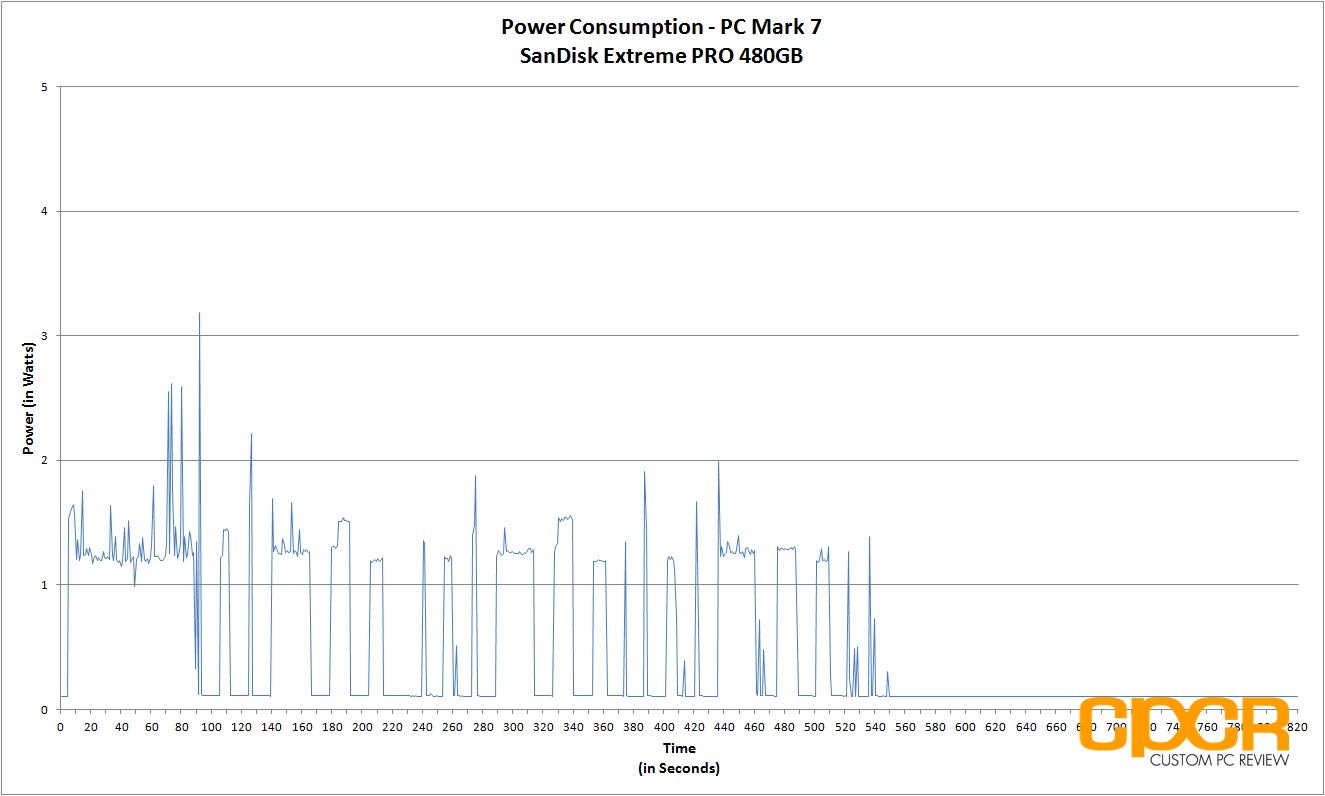
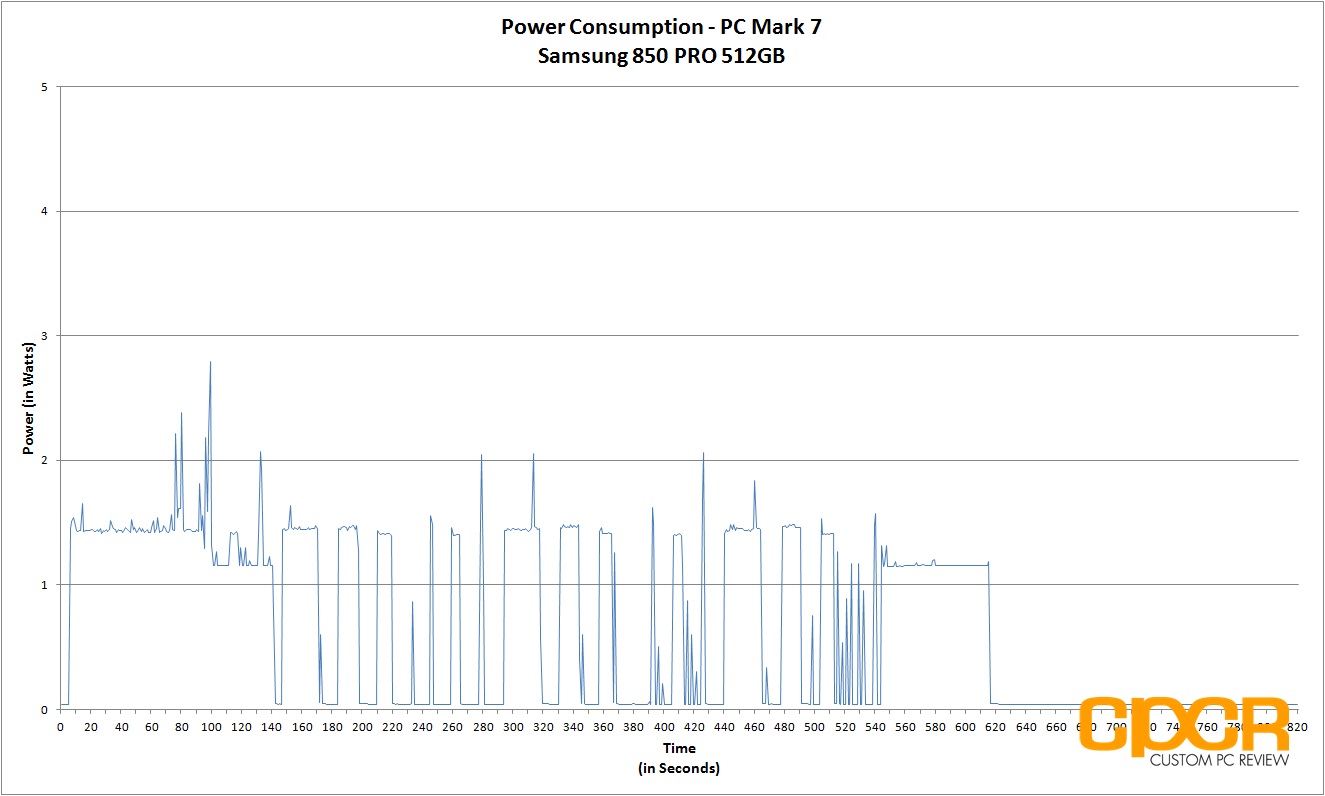
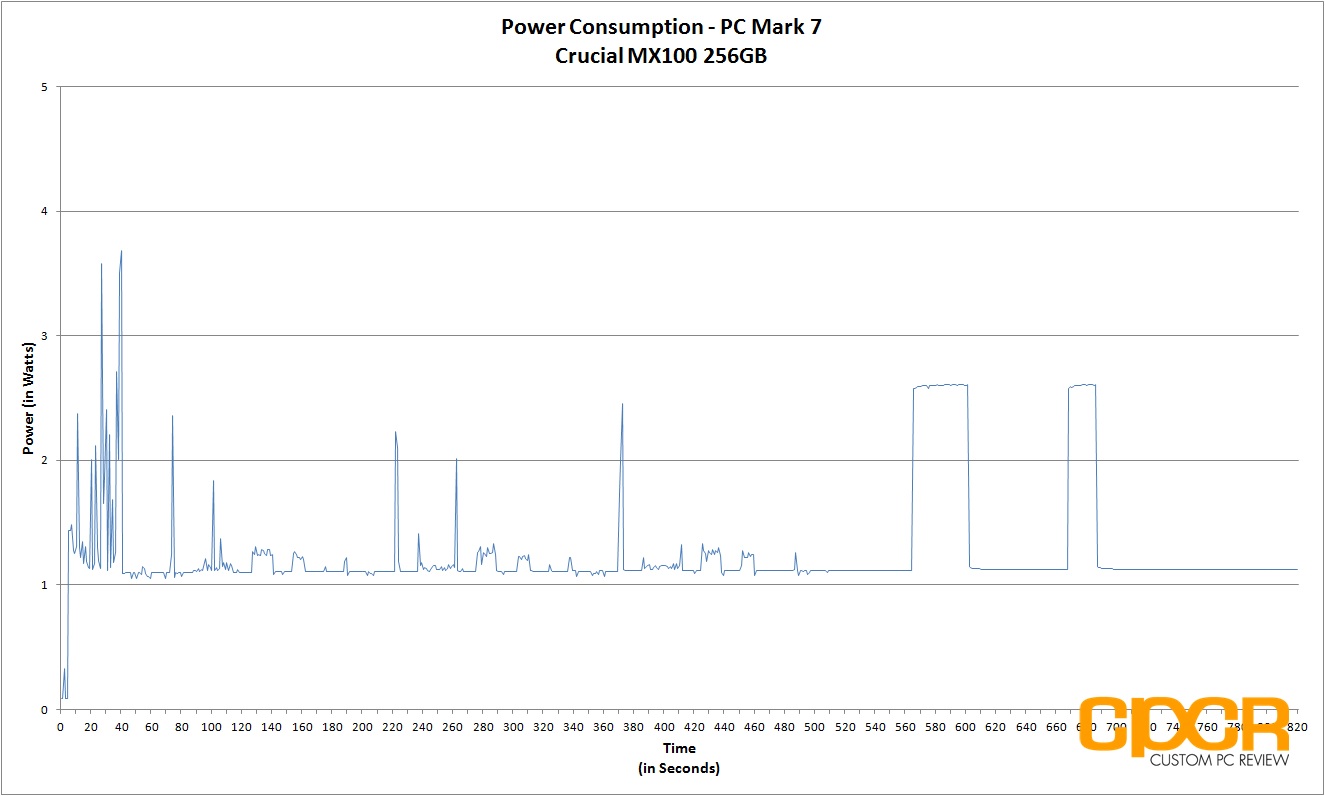
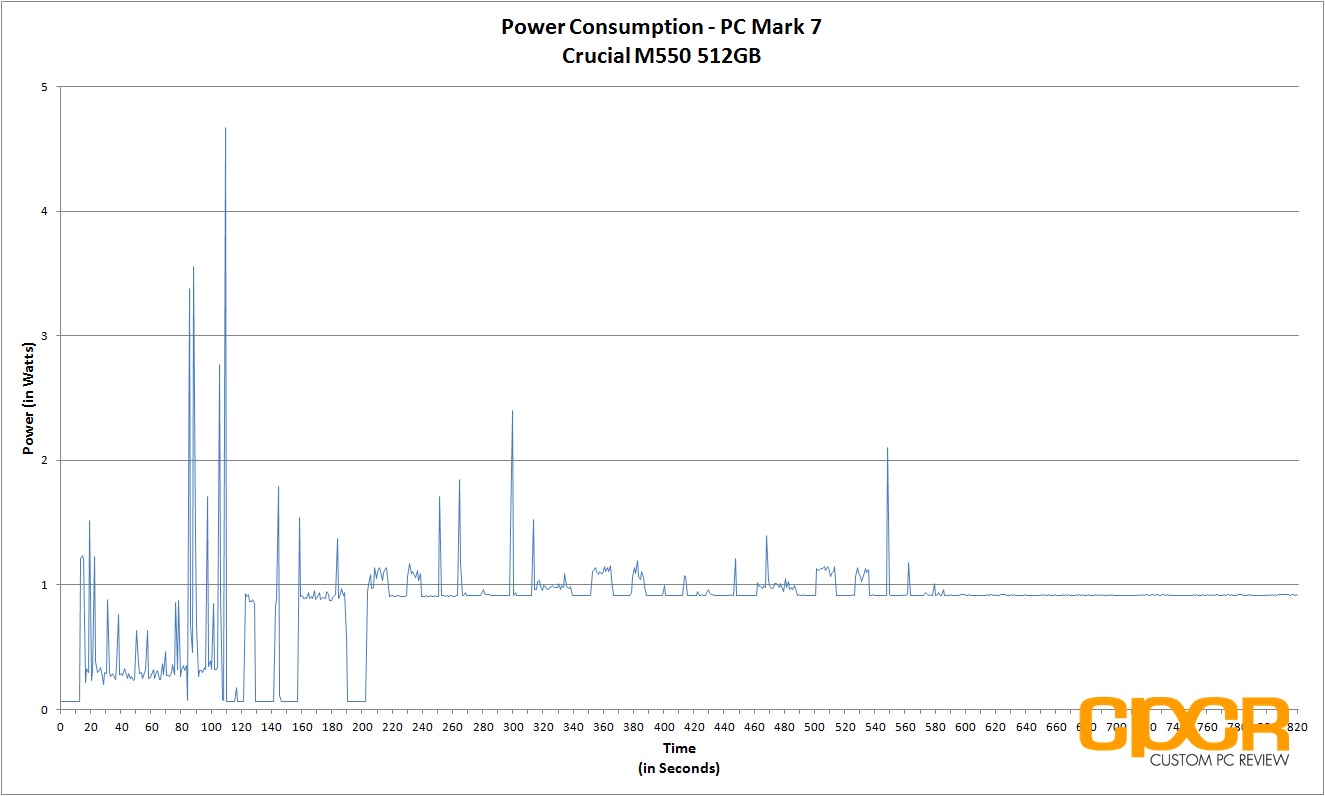
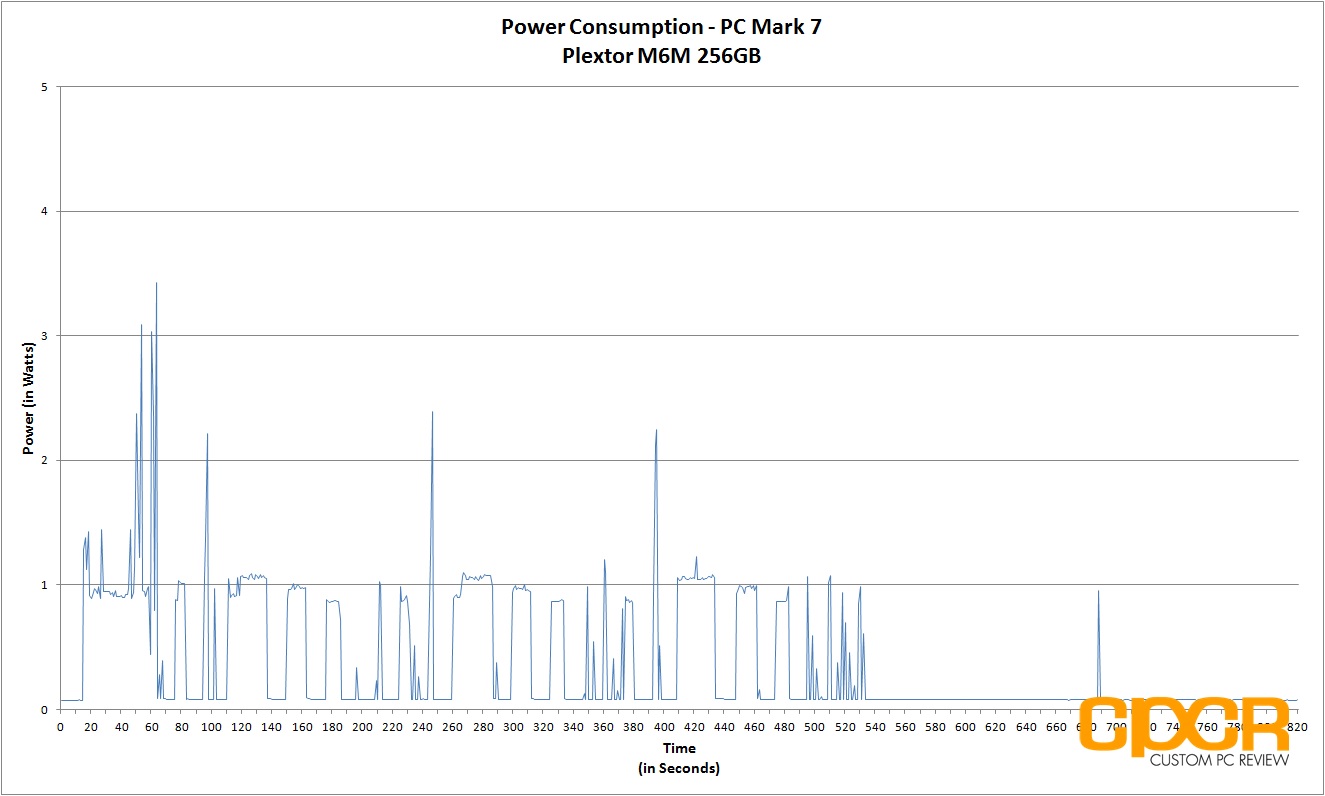
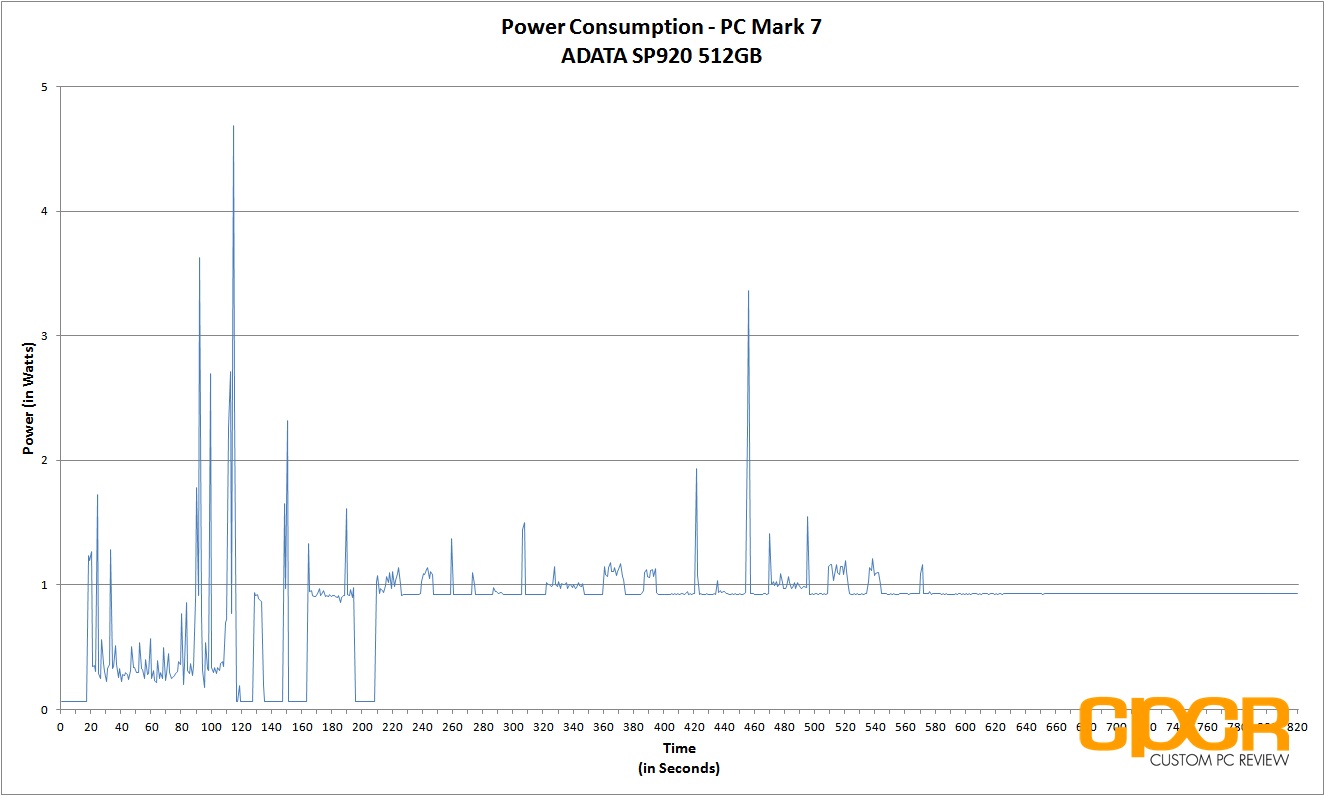
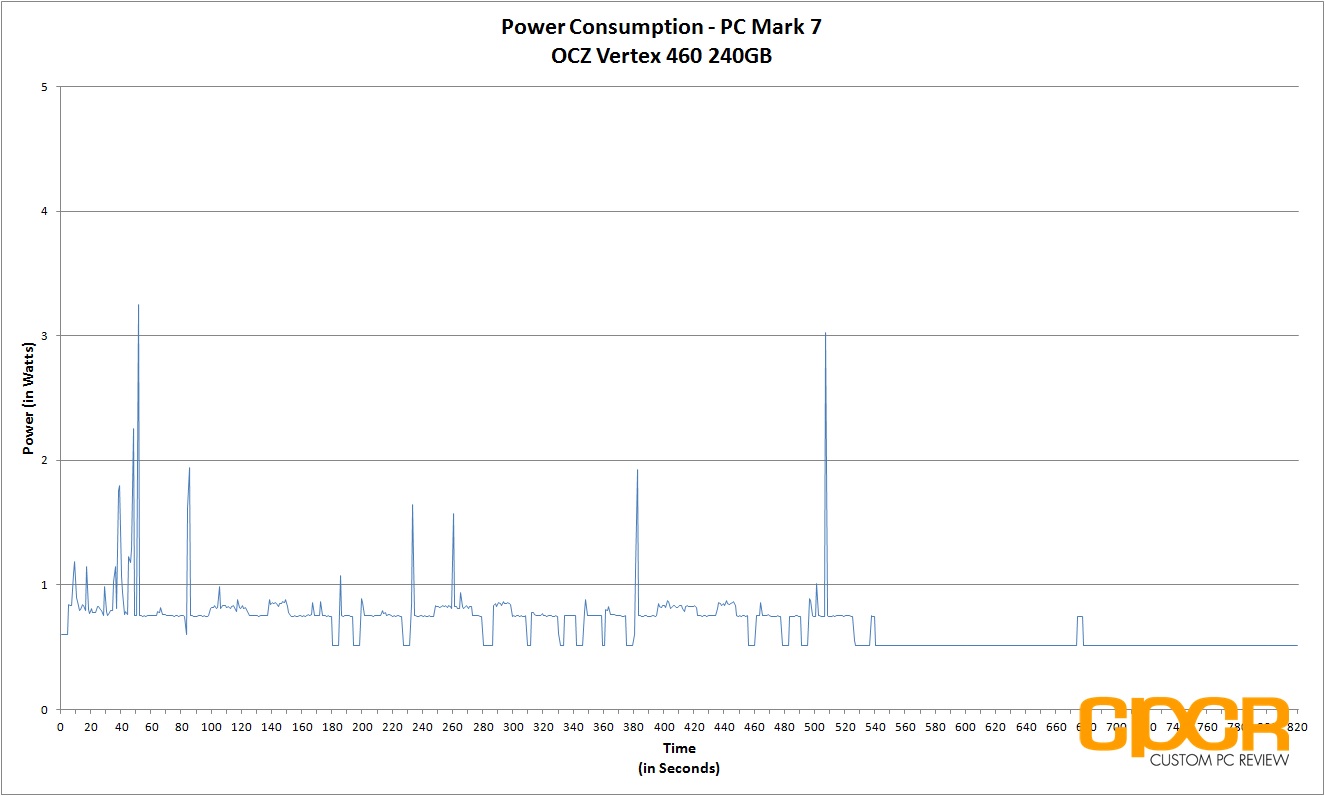
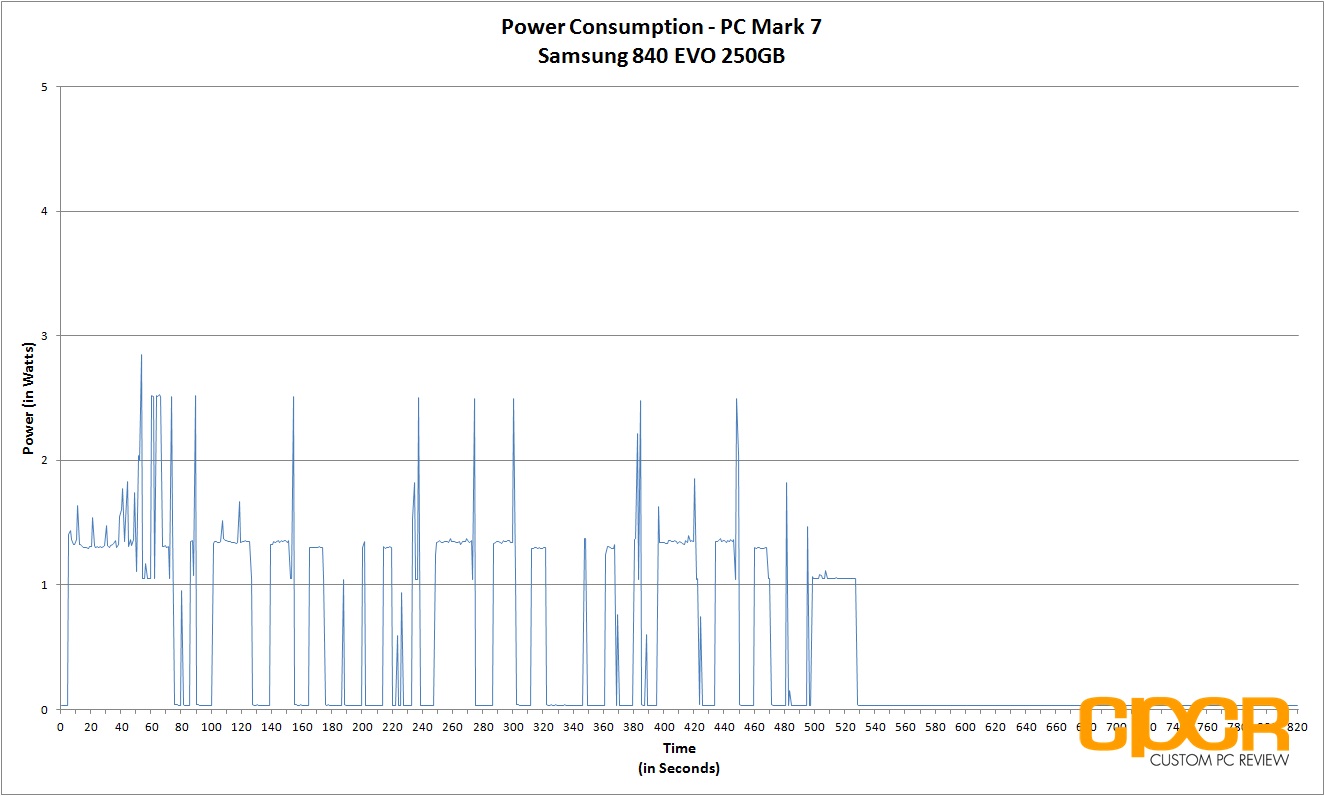
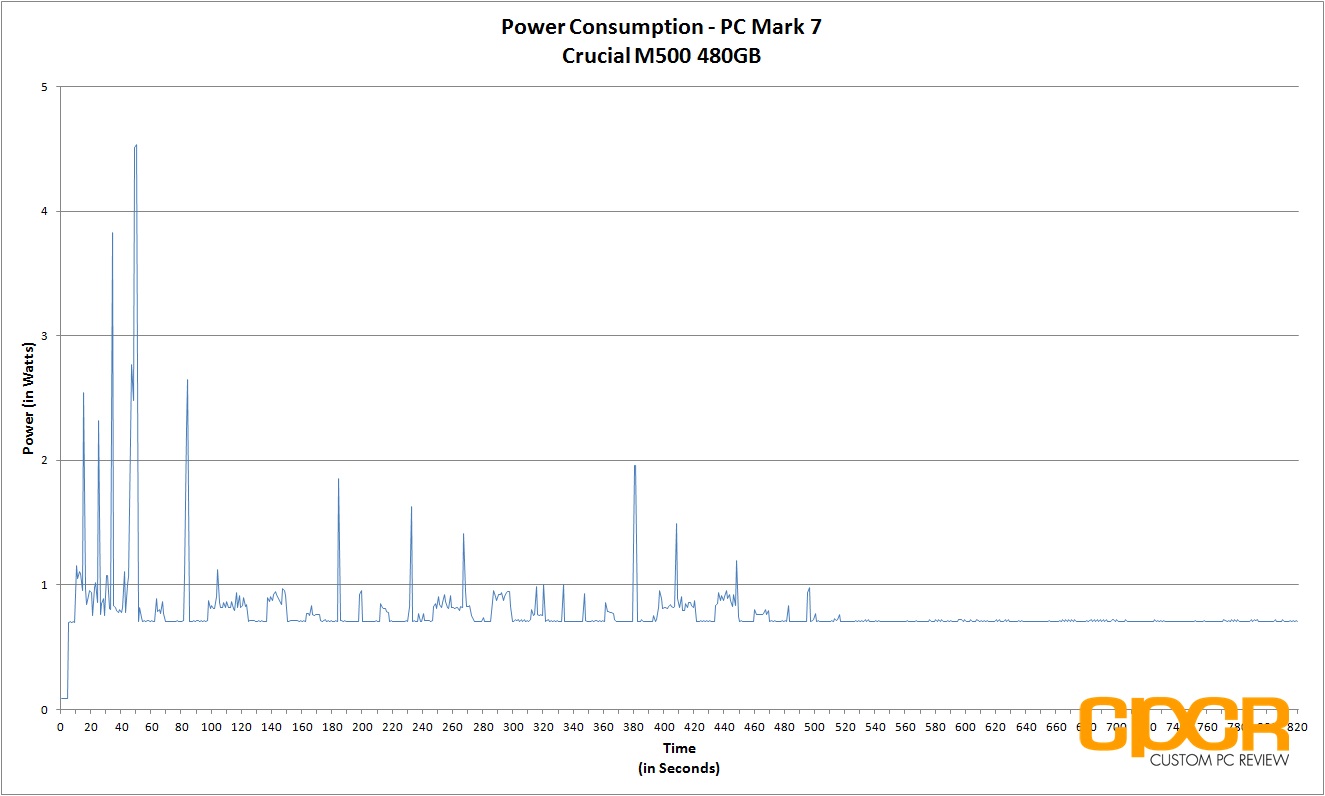
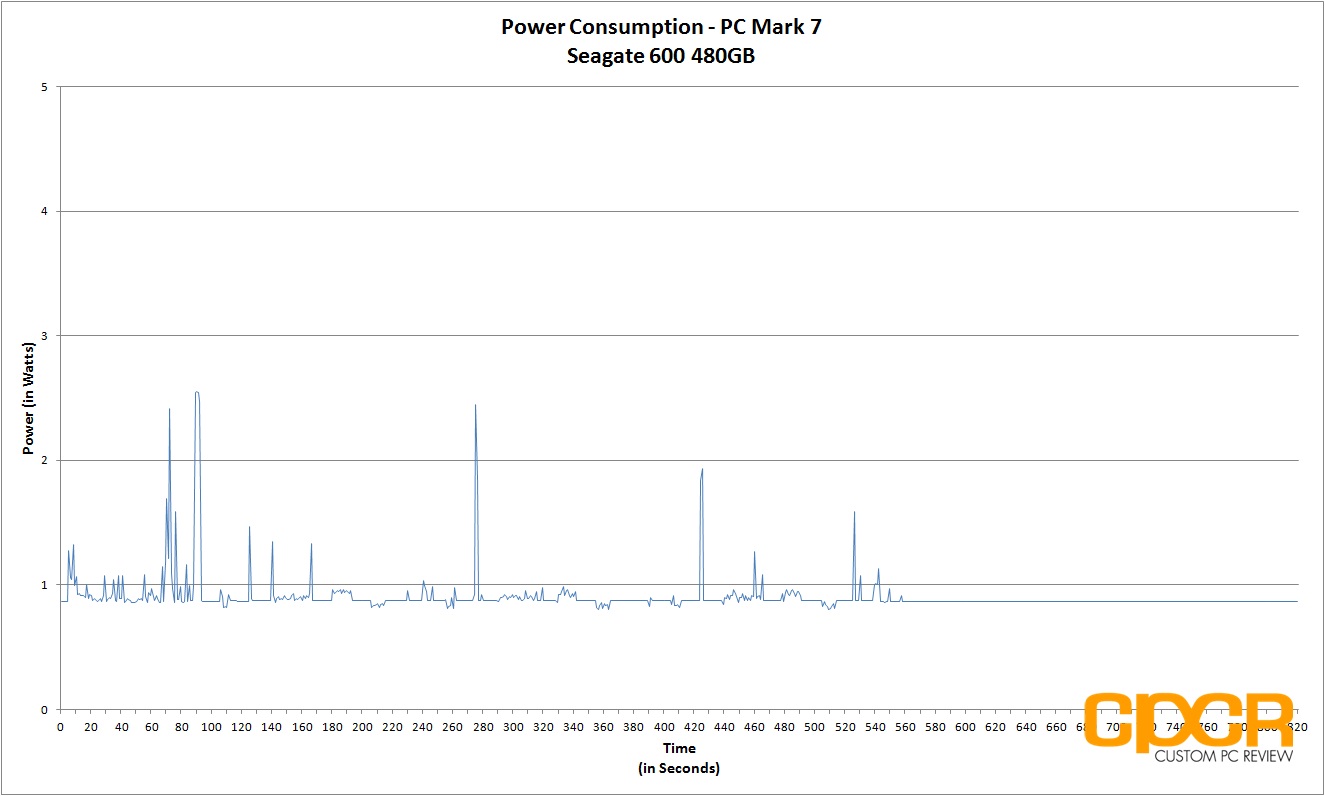
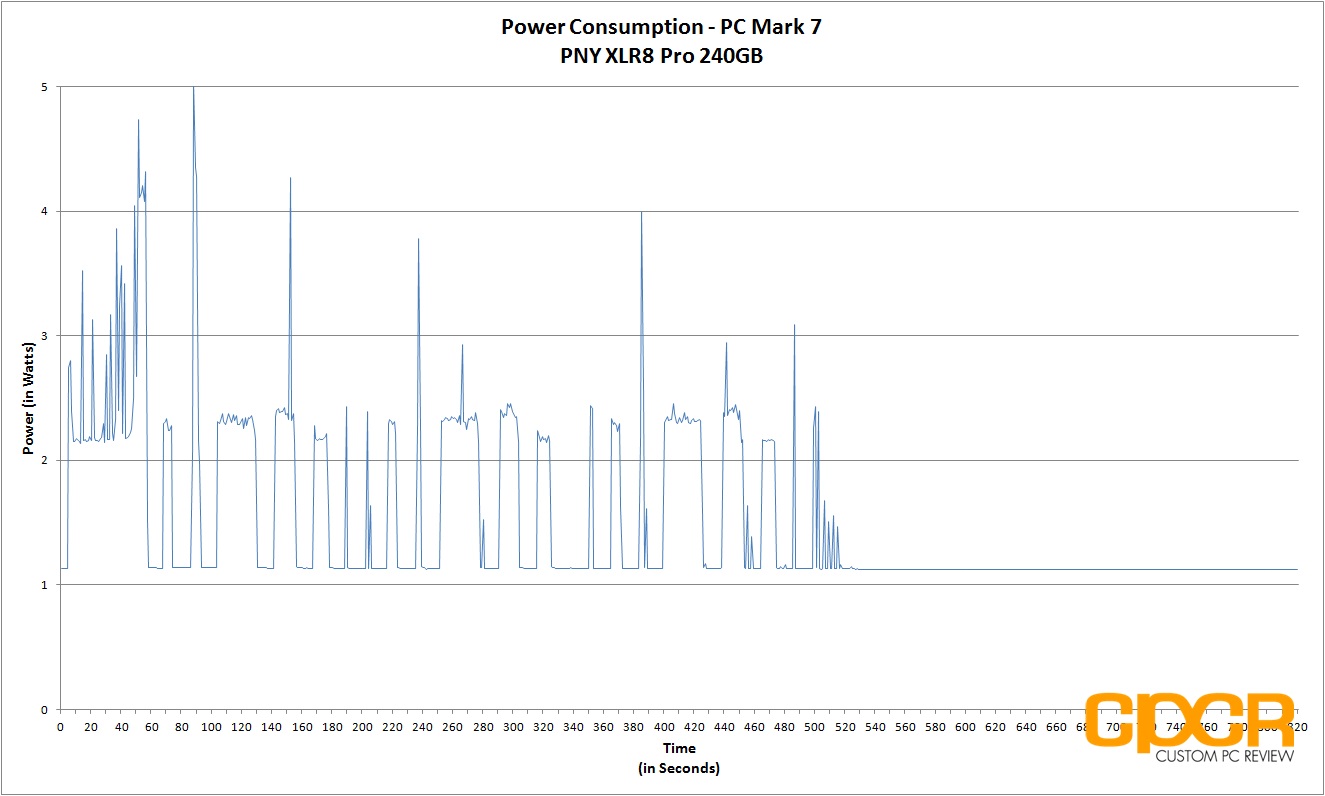
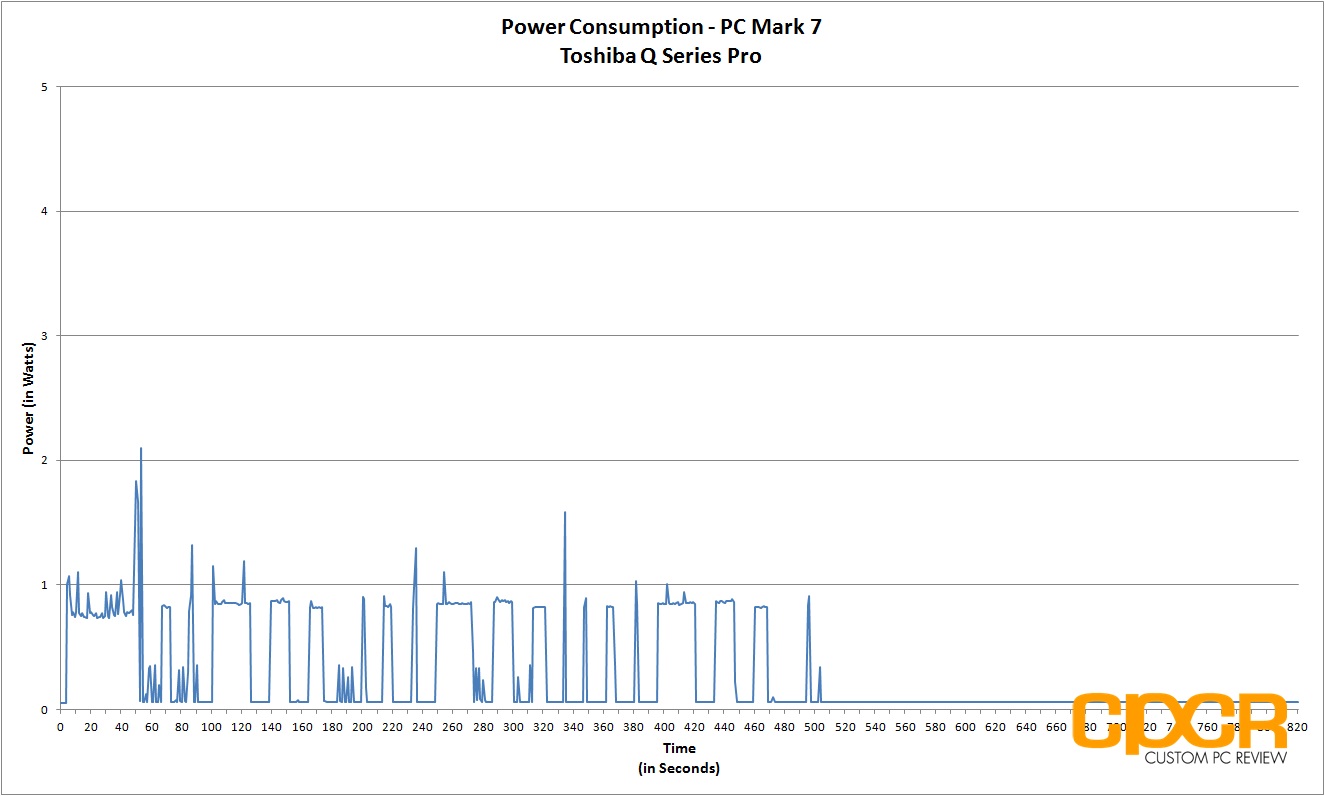
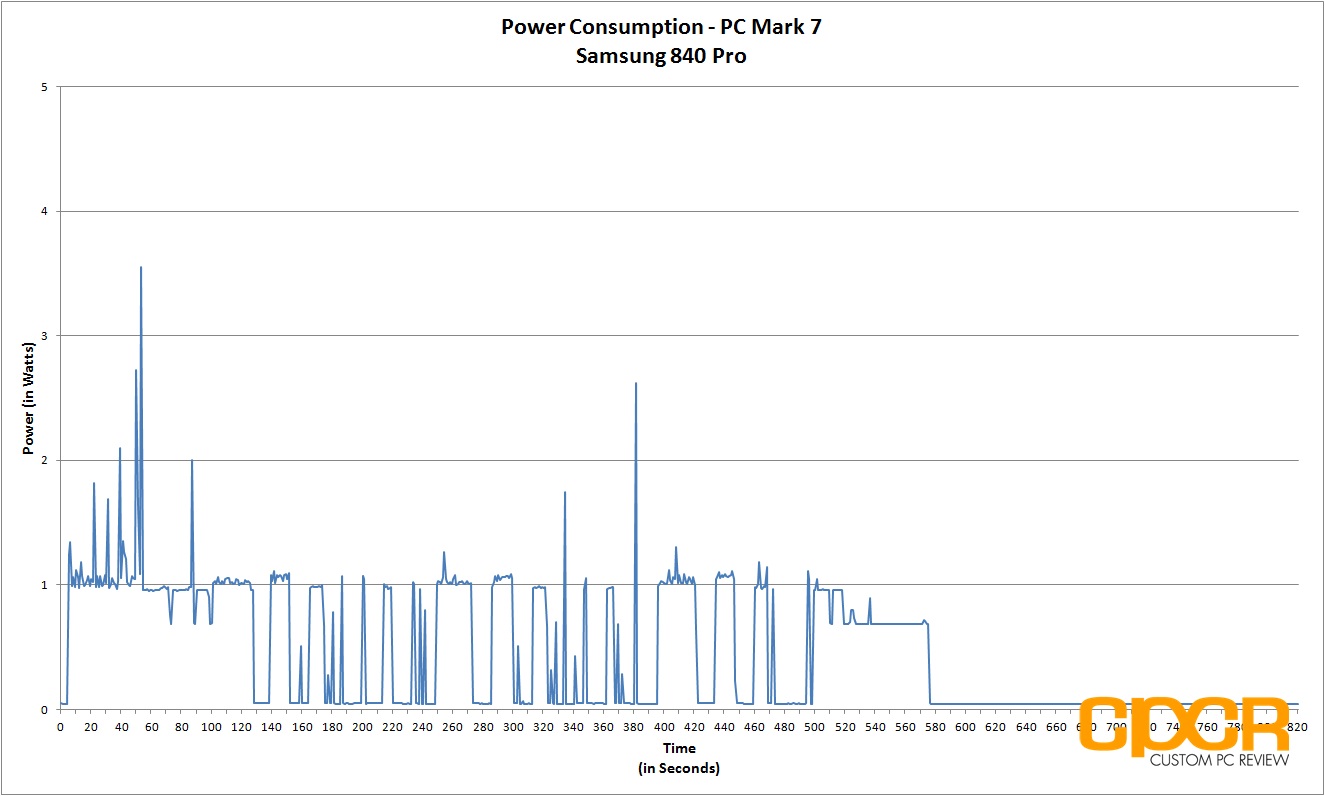
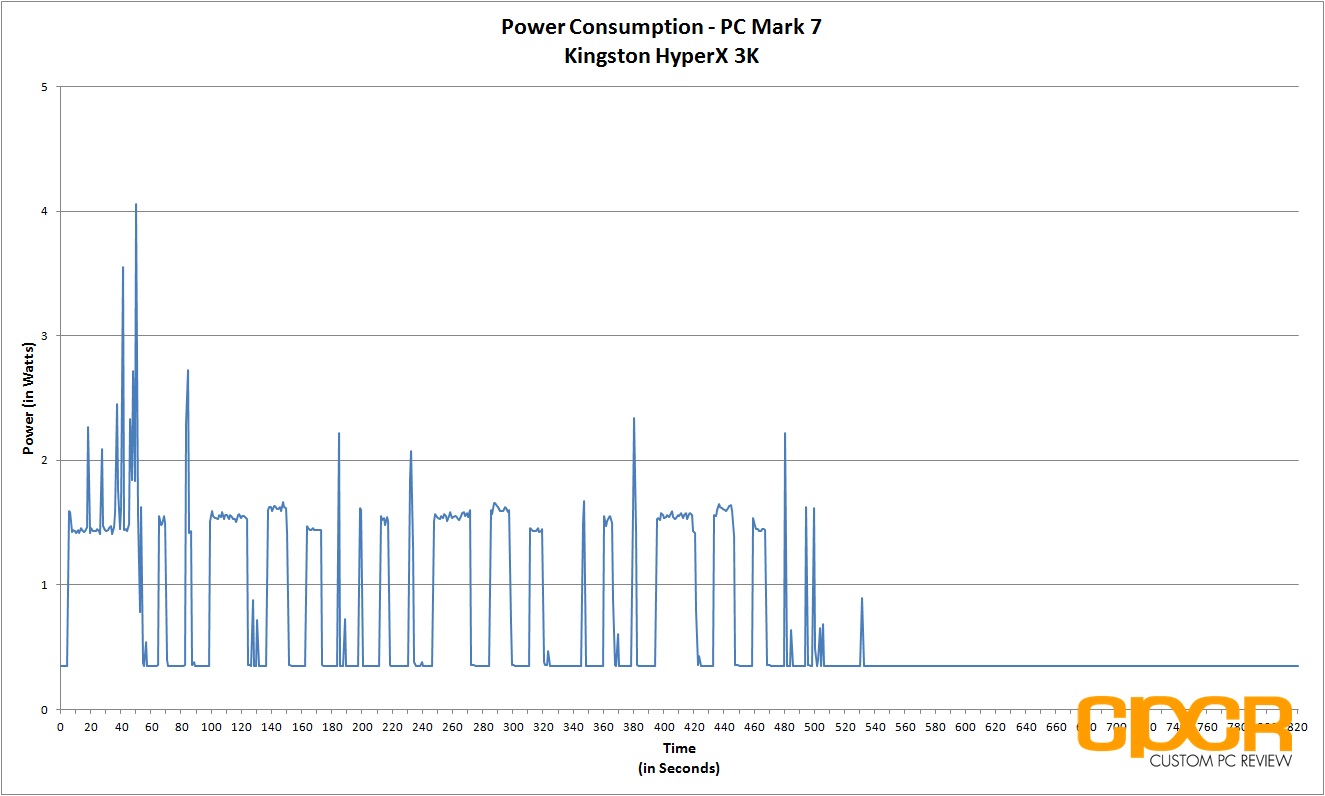
Previously, our power consumption analysis only tested for idle and maximum load power consumption, but we felt that this was a bad way to accurately measure power consumption. The reason for this is because SSDs tend to be bursty while in operation and will spike in power usage, but only for very short periods of time. As such, many of our SSDs appeared to have even higher power consumption than traditional hard drives, which is untrue.
In order to better represent a drive’s power consumption, our solution was to run a test closer to the real-world and record a trace of the exact power consumption during testing. Since PC Mark 7 has been recognized by the industry as a fantastic real-world benchmark, we’ll be recording the drive’s power consumption while running the benchmark.
All tests below are measured by our B&K Precision 5491B Bench Multimeter tapped directly into the 5v line running from the power supply to the drive. All testing here is conducted with “HIPM (Host Initiated Power Management)/DIPM (Device Initiated Power Management)” enabled and “AHCI Link Power Management – Adaptive” set to 0 milliseconds for maximum power efficiency.
[tabgroup]
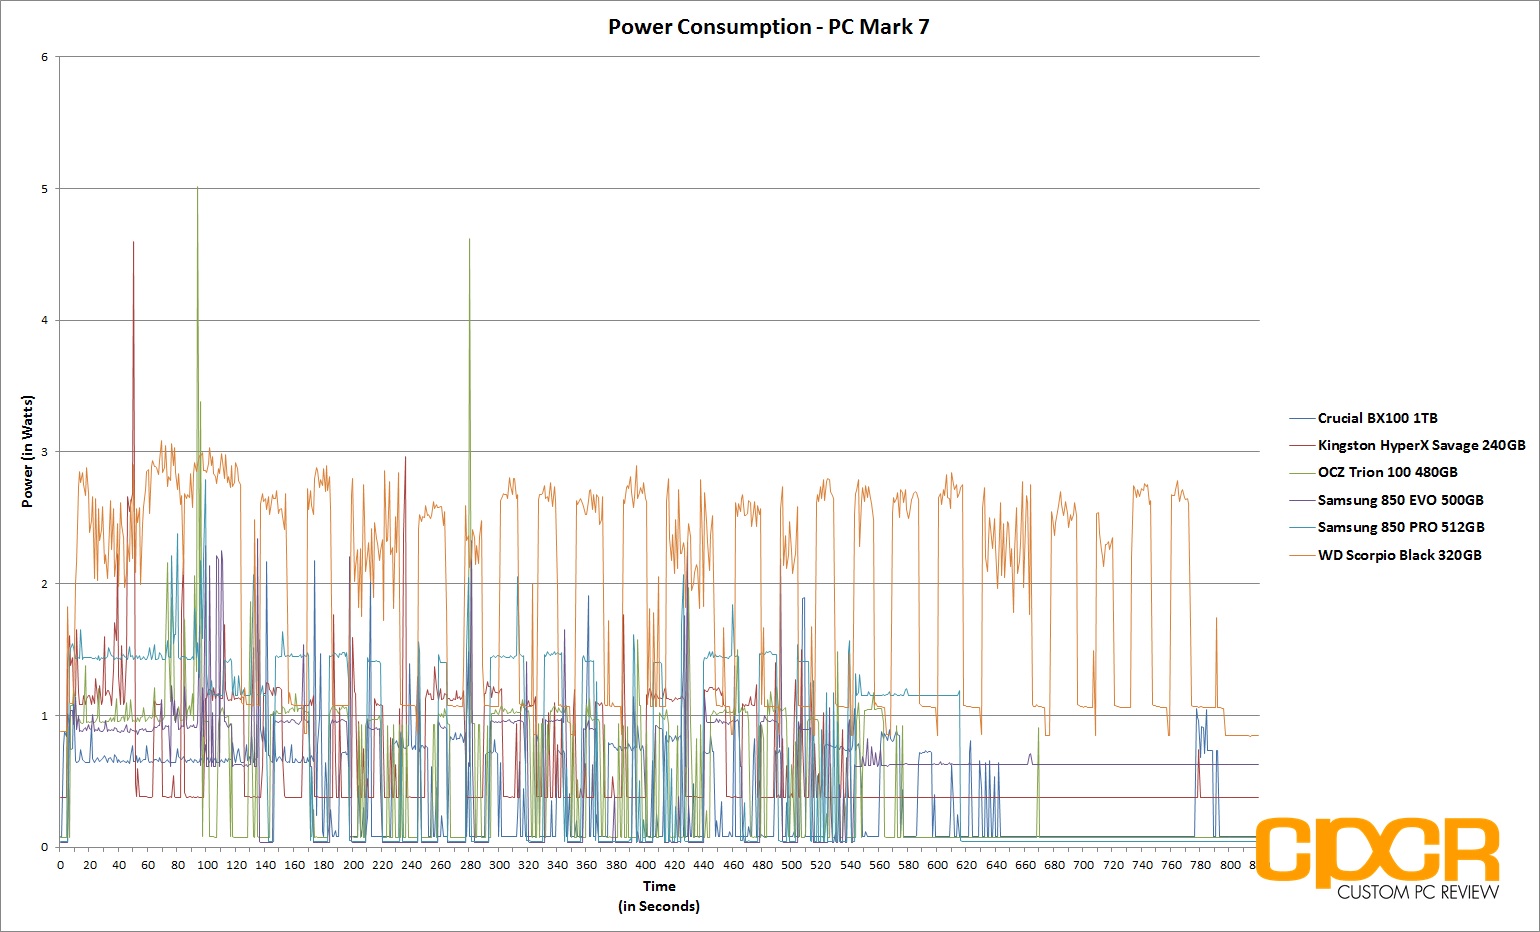

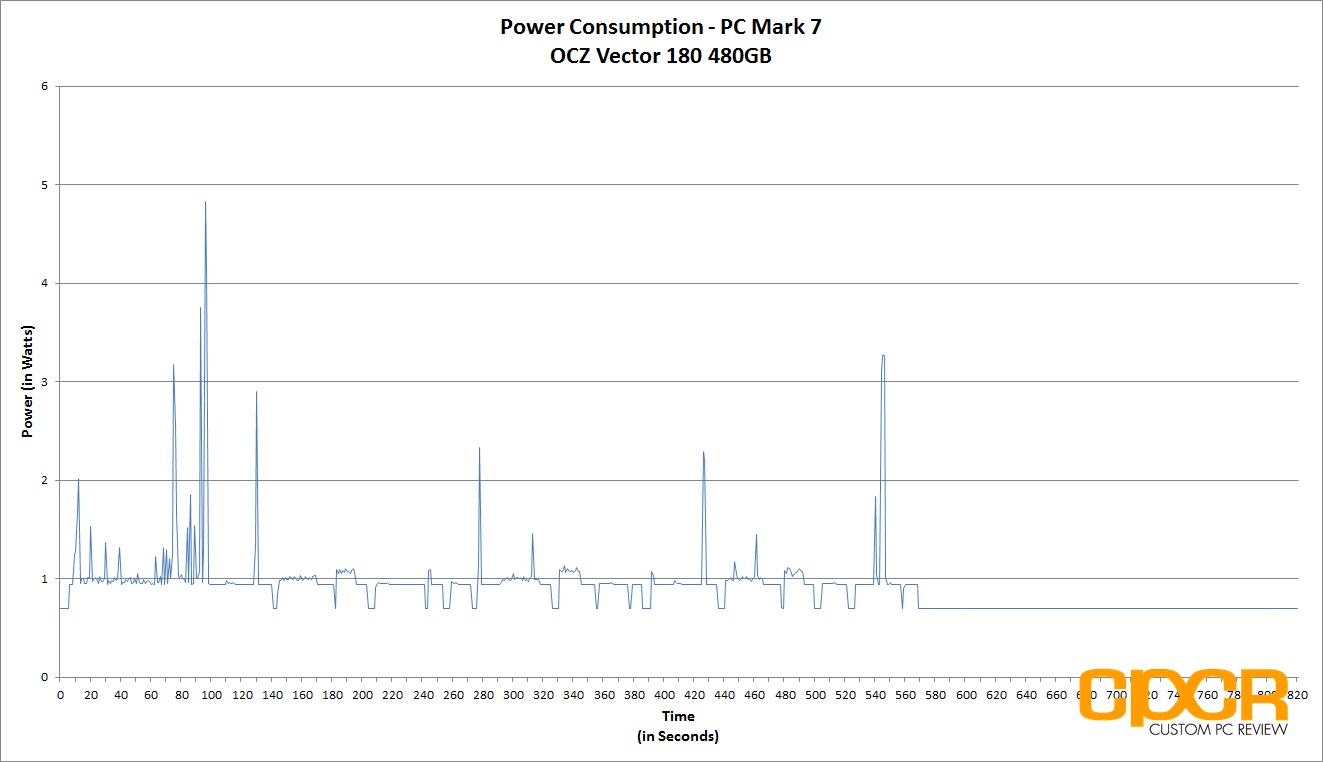
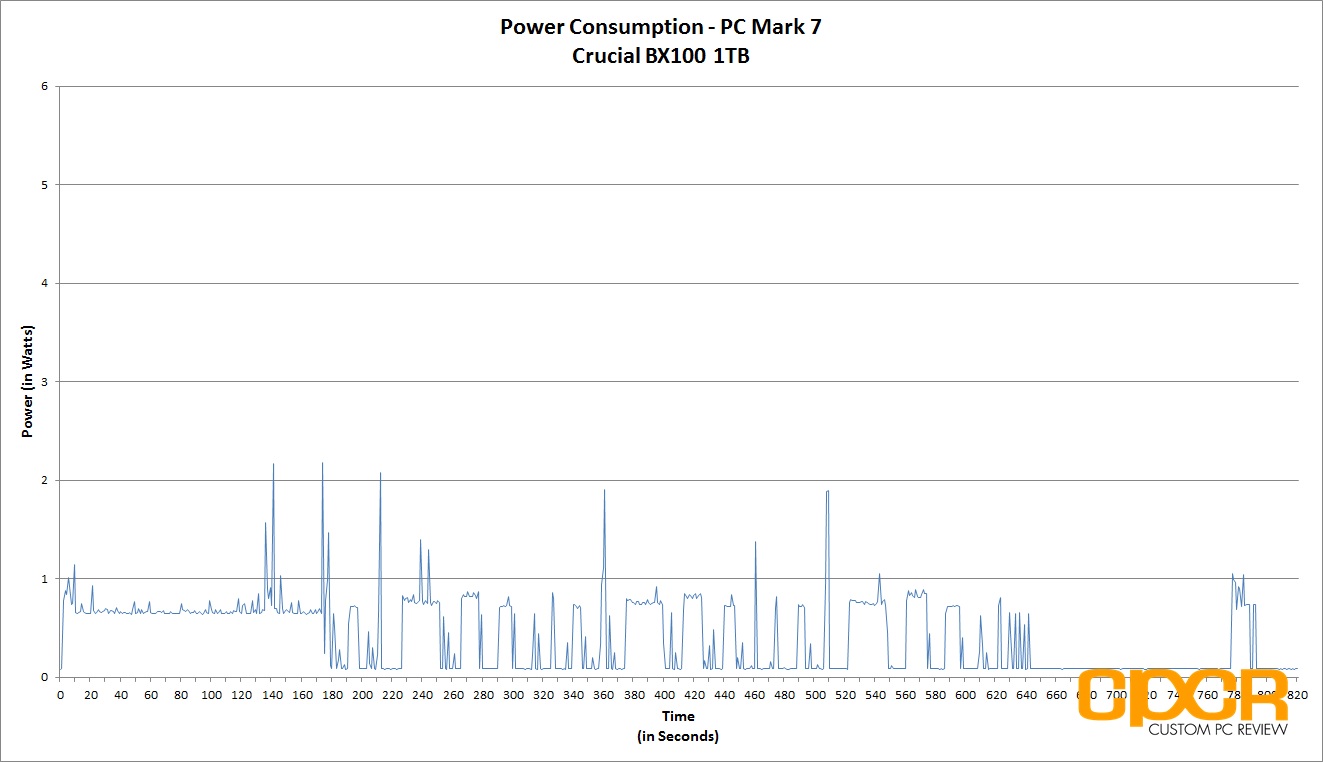
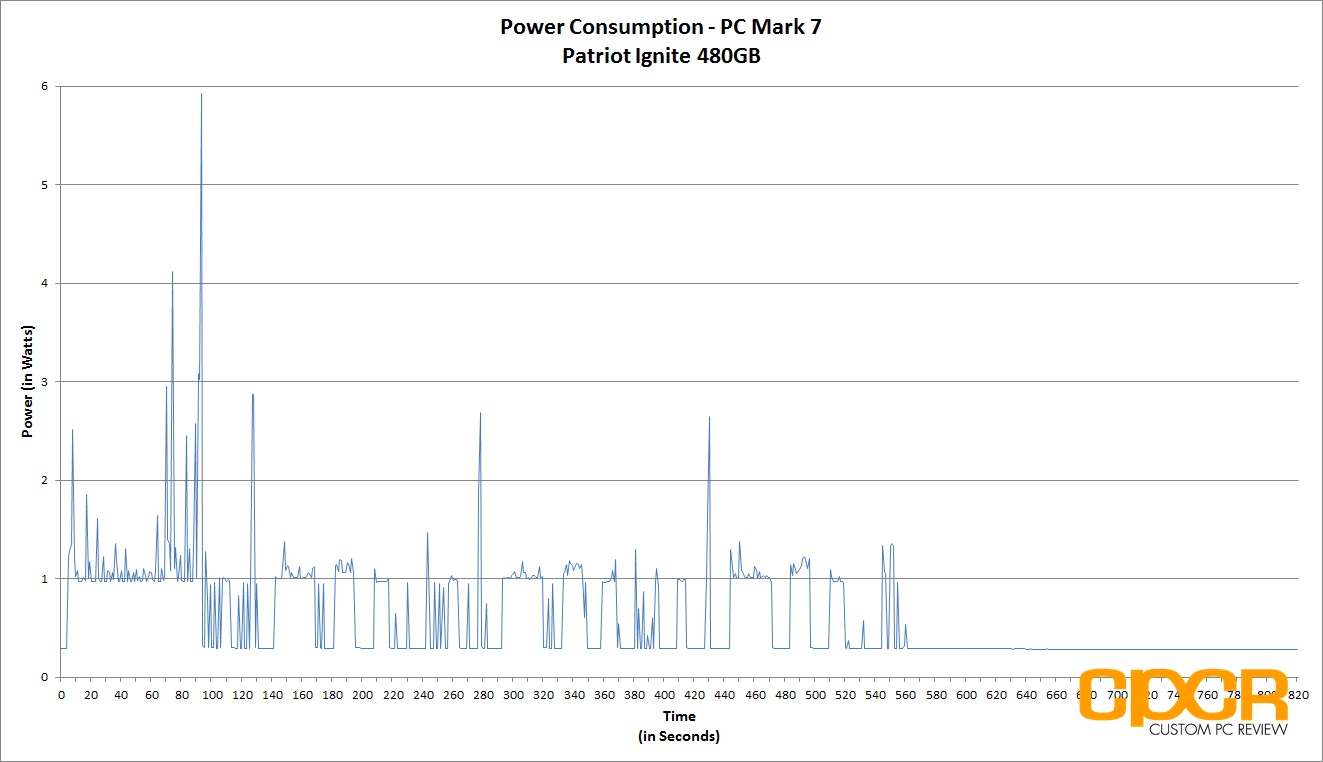
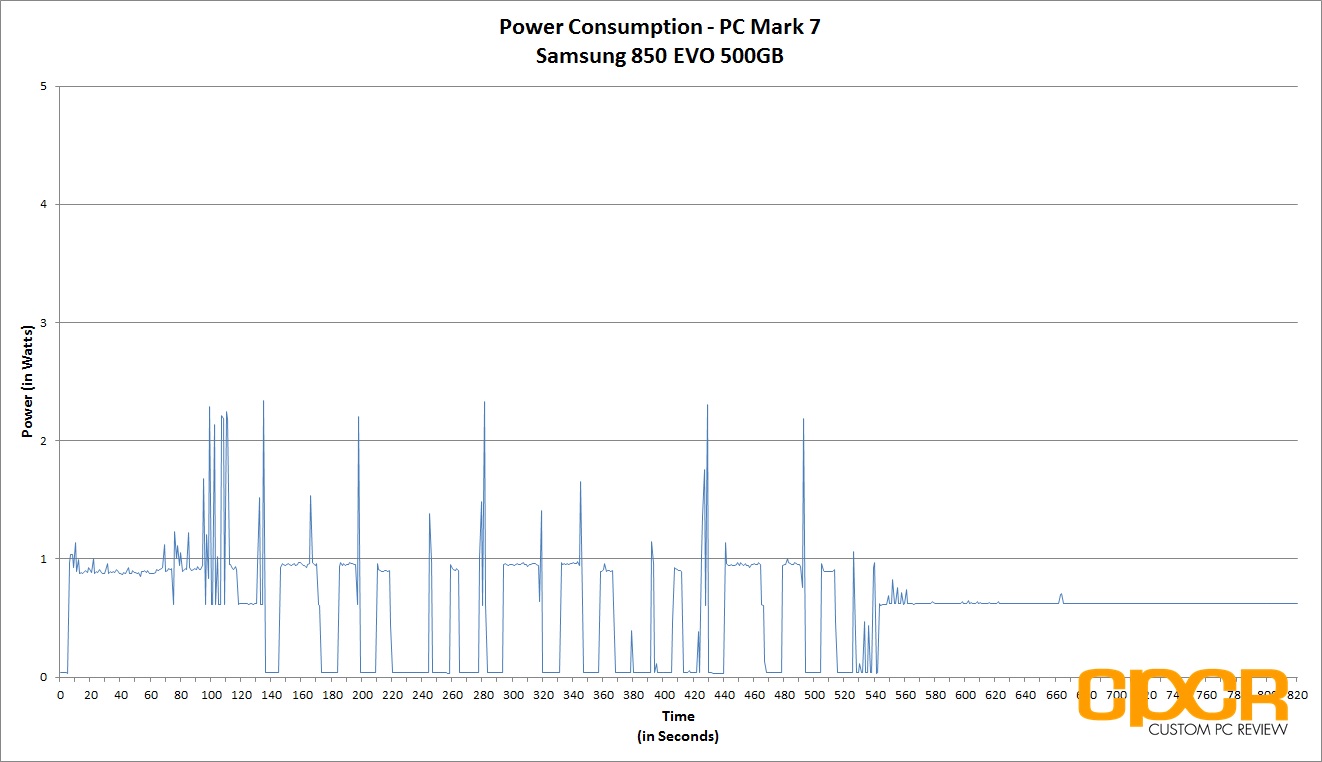
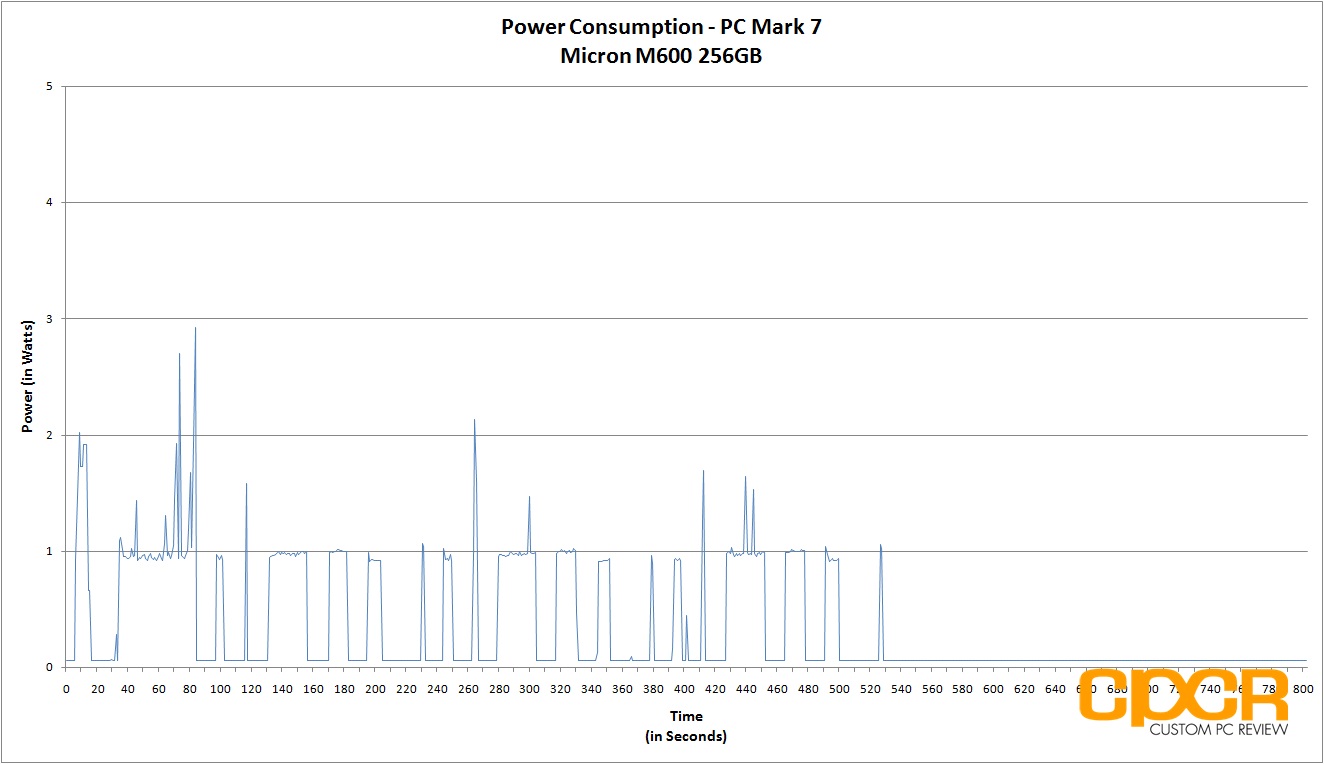
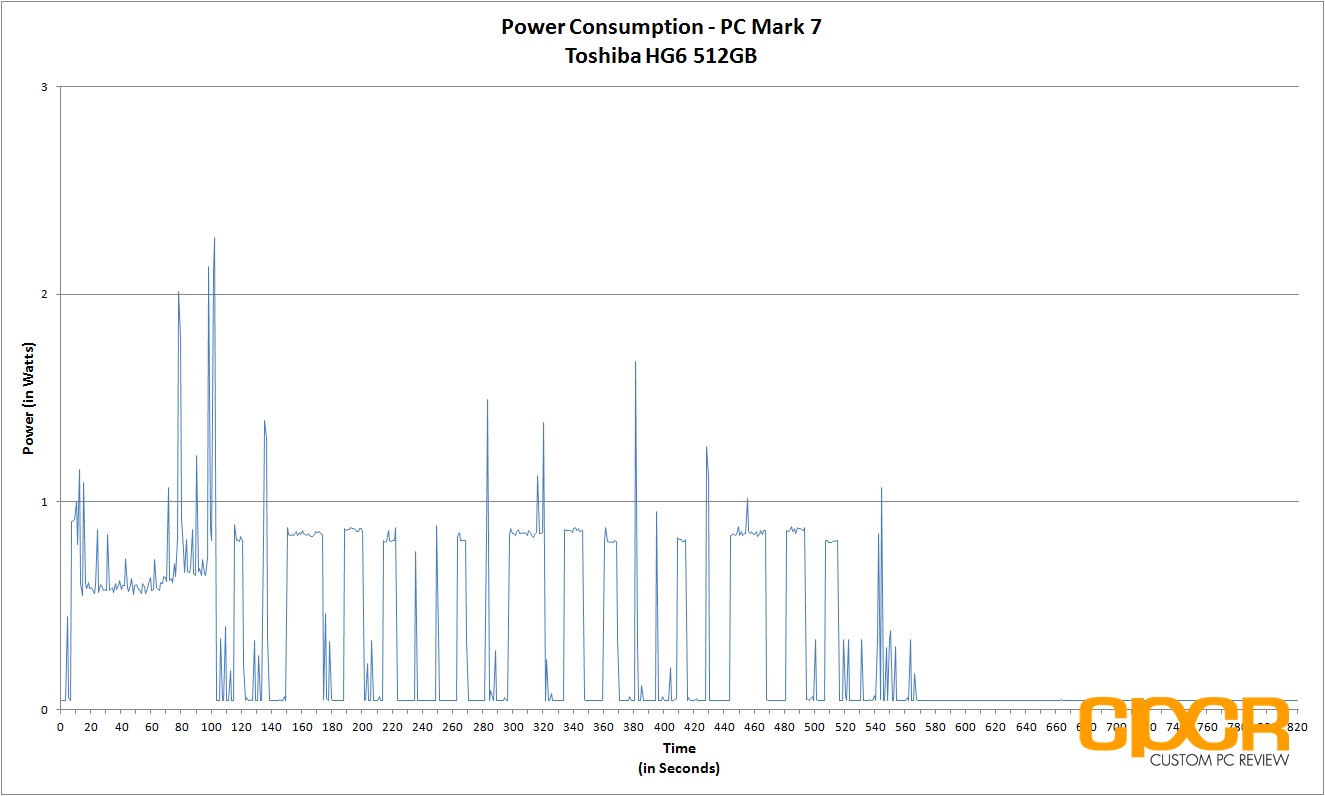

Performance Analysis
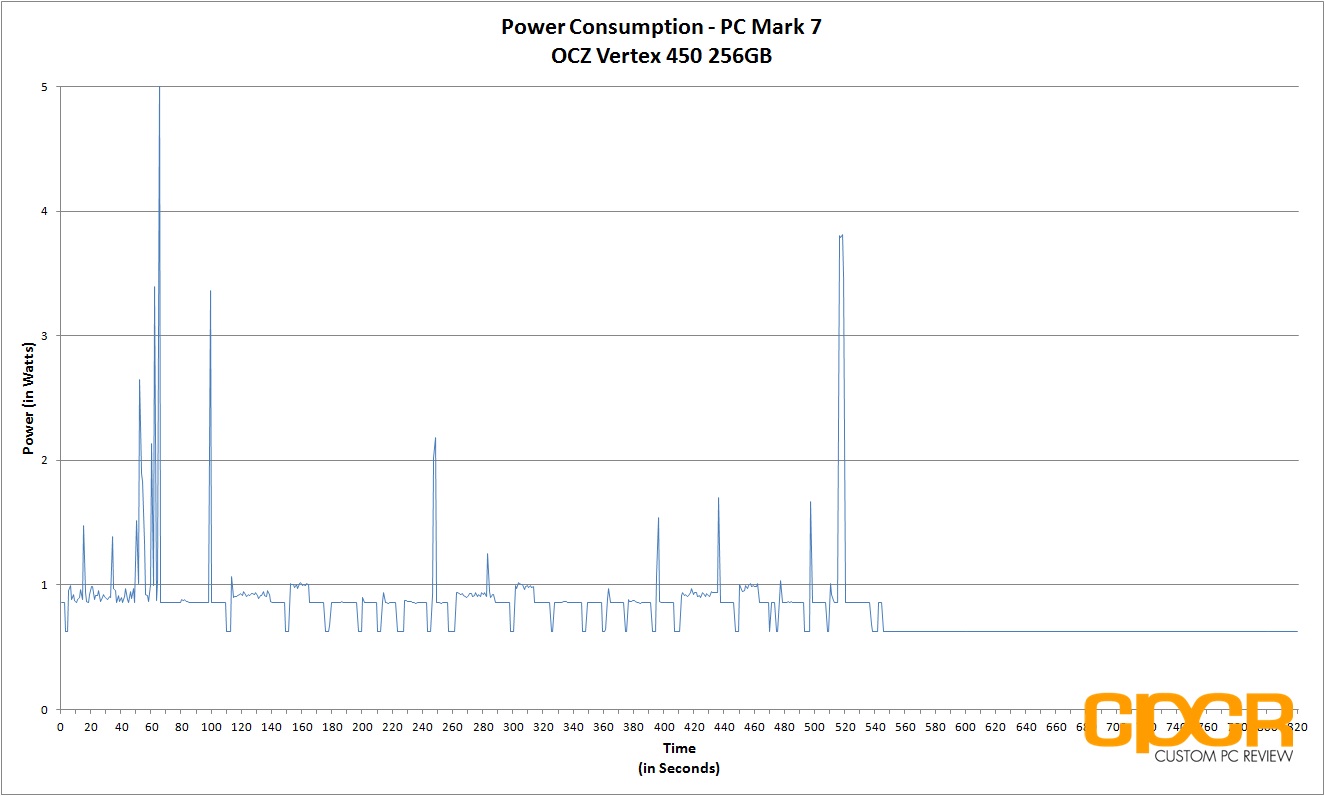
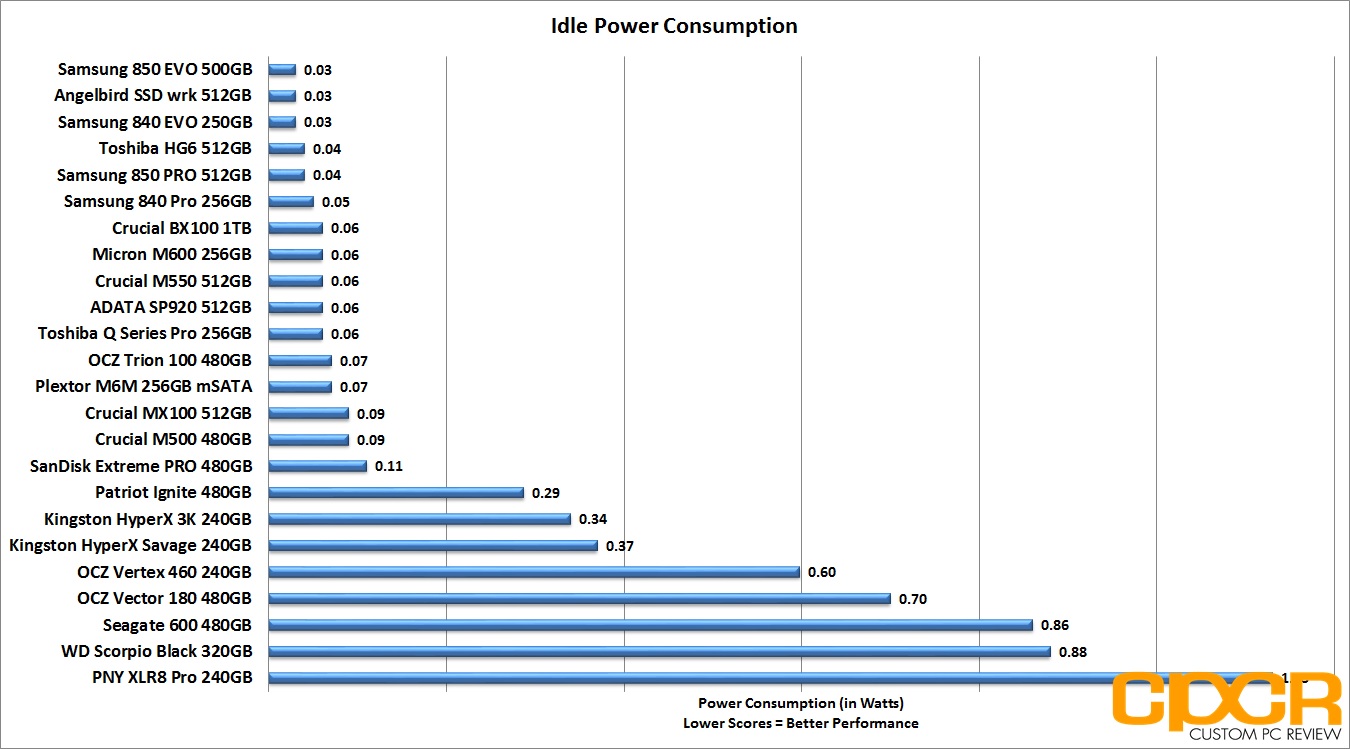
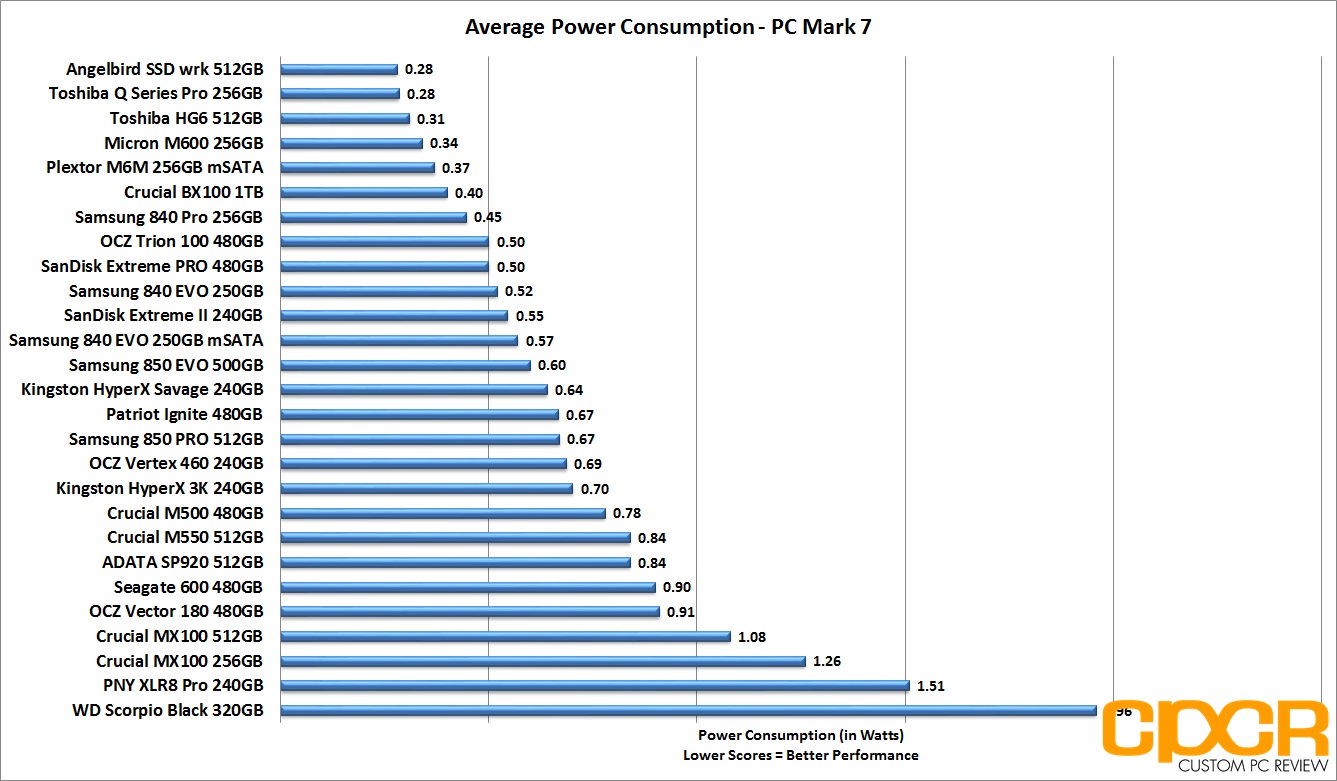
One of the biggest benefits of using Toshiba controller technology rather than OCZ’s own Barefoot 3 is power consumption. In testing, the Toshiba TC58 controller was significantly more power efficient than OCZ’s Barefoot 3, with the Toshiba TC58 drawing just ~0.07w at idle compared to OCZ Barefoot 3’s 0.40w or higher. Average power consumption was significantly lower as well with the Trion 100 coming in at just 0.50w.
While power consumption using Toshiba’s TC58 is significantly better than OCZ’s Barefoot 3, it still needs work compared to SSDs powered by Samsung, Silicon Motion, some Marvell, and even some of Toshiba’s own controllers.
[section label=12. Conclusion]
OCZ Trion 100 480GB Conclusions
 Back at FMS 2014, all of the SSD vendors I talked to were all working on some sort of TLC NAND based product. Touting the cost benefits and the growing entry level market, everyone had something on their roadmaps. While TLC NAND has taken a lot longer than expected to develop, it’s finally here and the OCZ Trion 100 represents just one more drive proving the viability of the technology.
Performance on the OCZ Trion 100 480GB is unfortunately mediocre at best, and at worst, it’s one of the slowest SSD I’ve tested in a long time. I guess I was kind of expecting that from a TLC based value SSD. That being said, the only vendor who has really successfully commercialized TLC NAND is Samsung and they did it so far back that it seems odd that companies are still struggling with getting TLC NAND to perform at a competitive level. However, it is important to remember that when the original Samsung 840 was launched back in 2012, it was slow. It wasn’t until a year after that that they really got it right with TLC and I think this will be the case for other SSD manufacturers as well.
Power consumption on the OCZ Trion 100 is quite a bit better than we’re used to with OCZ SSDs, but it’s still a work in progress compared to some of its competitors on the market. If you’re looking for a SSD to slot into your laptop or tablet, I’d probably look into Samsung or Silicon Motion based drives first.
| Manufacturer | OCZ | OCZ | OCZ | OCZ |
|---|---|---|---|---|
| Model | Trion 100 | Trion 100 | Trion 100 | Trion 100 |
| SKU | TRN100-25SAT3-120G | TRN100-25SAT3-240G | TRN100-25SAT3-480G | TRN100-25SAT3-960G |
| Capacity | 120GB | 240GB | 480GB | 960GB |
| Street Price | $59.99 | $89.99 | $179.99 | $359.99 |
| Price/GB | ~$0.50 | ~$0.37 | ~$0.37 | ~$0.37 |
| Check Price | Click Here |  Click Here Click Here |
Click Here | Click Here |
The OCZ Trion 100 can currently be found online at $59.99 for 120GB, $89.99 for 240GB, $179.99 for 480GB, and $359.99 for 960GB. While pricing on the Trion 100 is relatively competitive against many mainstream drives, it’s still the same story here as with many other drives in the mainstream segment. The MLC based Crucial BX100 is even more competitive in terms of pricing and the Samsung 850 EVO is just as competitive in terms of price, but offers better features, warranty and performance. If OCZ can drop the price on the Trion 100 by ~$0.10/GB across the board, it’ll be a much different story, but as it stands it’s an “entry, entry” level product priced at the entry level.
Overall the OCZ Trion 100 is another offering in the TLC SSD market, further proving that TLC NAND is a viable NAND technology for SSDs. However, high initial pricing and low performance make the Trion 100 difficult to recommend right now. With that said, FMS is coming up soon and hopefully some more development on TLC SSDs may pave the way to lower pricing and better performance. Until then, stay tuned.
Sample provided by: OCZ Storage Solutions
Availability: Amazon
