[section label=1. Introduction]
The Fastest M.2 Drive You Can Buy Today
 Earlier this year I visited Kingston at CES, and while it’s typically uncommon with memory companies to unveil a ton of new stuff, Kingston actually had quite the showing with the centerpiece of it all being their new HyperX Predator PCIe SSD. Of course, this wasn’t the first time Kingston had showed off the HyperX Predator. Back at Computex last year, Kingston was extremely excited to show off early prototypes of the HyperX Predator although I had my doubts whether it’d come to market within a reasonable timeframe. The reason for this is because up until the HyperX Predator, Kingston had never been in the PCIe SSD market nor offered anything with a Marvell controller. Given the fact that Marvell generally only works with companies that develop their own firmware (and as far as I know, Kingston doesn’t have an internal firmware team), it seemed unlikely that Kingston would have something by 1H2015.
That being said, Kingston proved me wrong as they recently launched the HyperX Predator SSD to market and sent us one of their first samples for review.
Kingston HyperX Predator Specifications
| Manufacturer | Kingston | Kingston |
|---|---|---|
| Model | HyperX Predator PCIe SSD | HyperX Predator PCIe SSD |
| Model Number | SHPM2280P2/240G SHPM2280P2H/240G |
SHPM2280P2/480G SHPM2280P2H/480G |
| Form Factor | M.2 2280 | M.2 2280 |
| Capacity | 240GB | 480GB |
| Controller | Marvell 88SS9293 | Marvell 88SS9293 |
| NAND | Toshiba A19nm Toggle Mode MLC | Toshiba A19nm Toggle Mode MLC |
| DRAM Cache | 512MB DDR3 | 1GB DDR3 |
| Sequential Reads | 1,400 MB/s | 1,400 MB/s |
| Sequential Writes | 600 MB/s | 1,000 MB/s |
| 4K Random Read | 120,000 | 117,000 |
| 4K Random Write | 78,000 | 70,000 |
| Interface | PCIe Gen 2 x4 | PCIe Gen 2 x4 |
| Warranty | 3 Years, 415TBW (TeraBytes Written) | 3 Years 882TBW (TeraBytes Written) |
The Kingston HyperX Predator PCIe SSD is the first PCIe M.2 SSD offering from Kingston. It’ll initially be offered in capacities of 240GB and 480GB, but will also be offered in the 960GB capacity down the line. Sequential read performance is rated at 1,400 MB/s across the board, but sequential write performance maxes out at 600 MB/s for the 240GB model and 1,000 MB/s for the 480GB model. Either way, it’ll have peak performance that’s significantly faster than your average SATA based SSD.
Internally, the Kingston HyperX Predator will utilize Marvell’s new “Altaplus”88SS9293 controller paired with Toshiba A19nm Toggle Mode NAND. This is our first opportunity to test a drive equipped with the long awaited Marvell Altaplus controller, so we’re extremely excited to see what the HyperX Predator has to offer.
Let’s take a closer look!
[section label=2. A Closer Look]
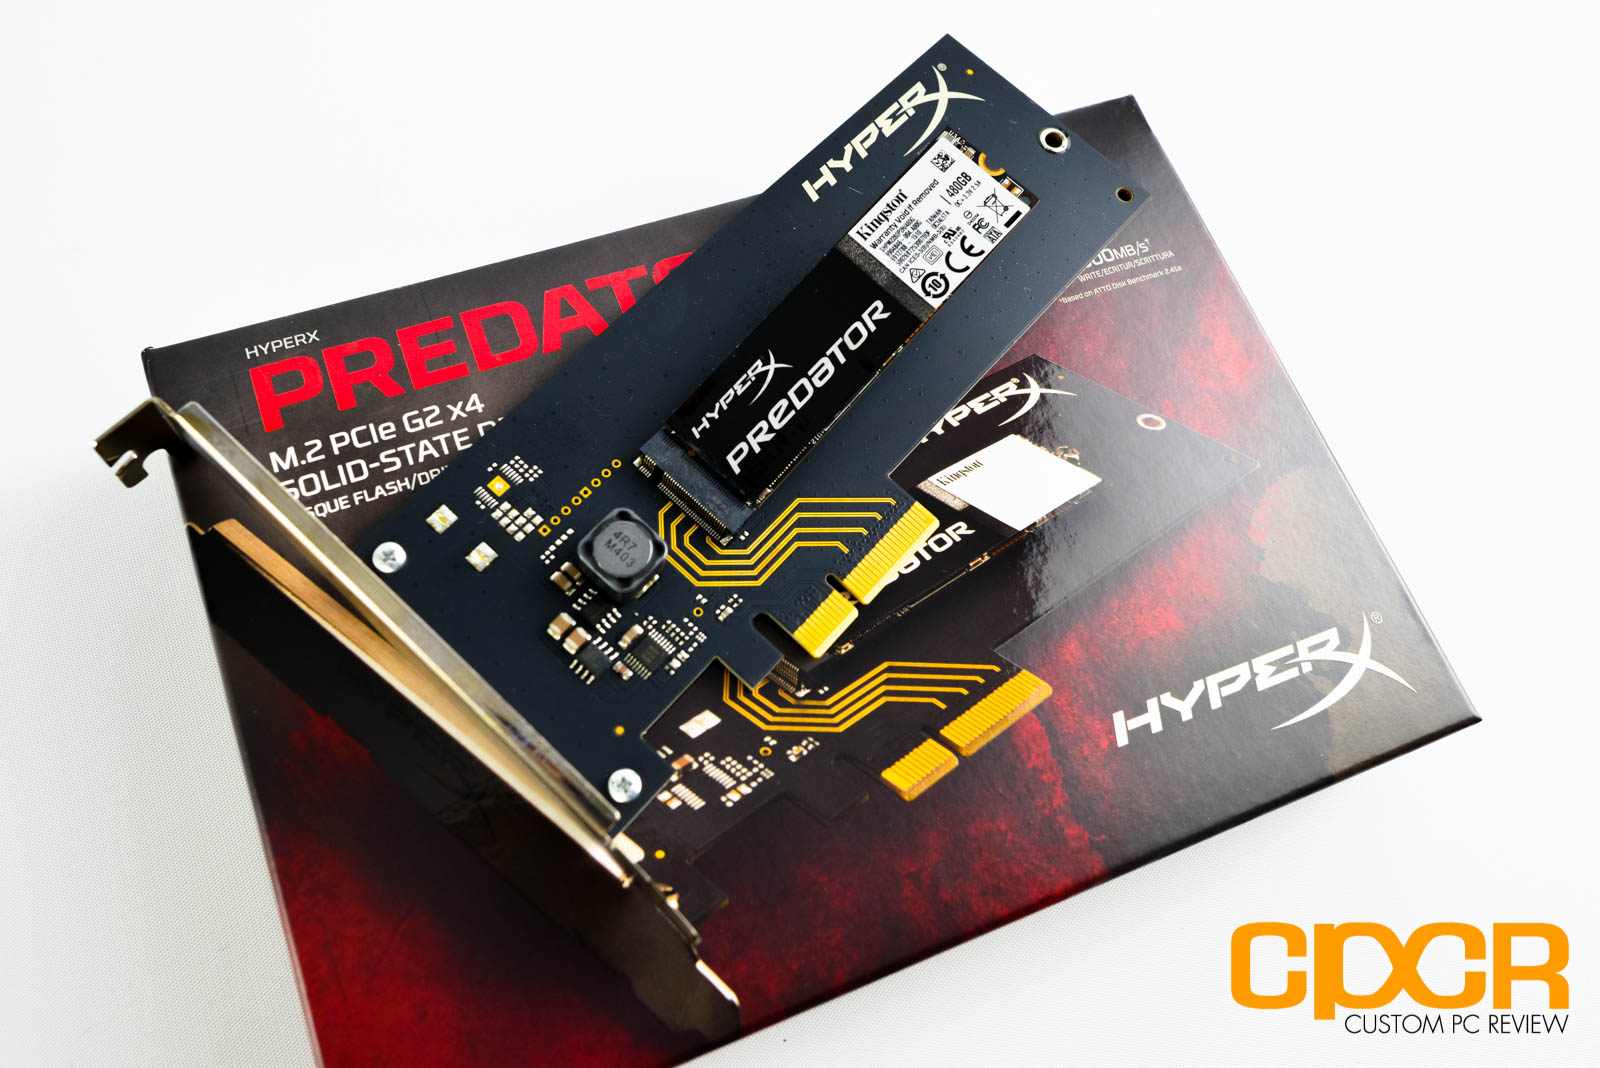
A Closer Look at the Kingston HyperX Predator 480GB
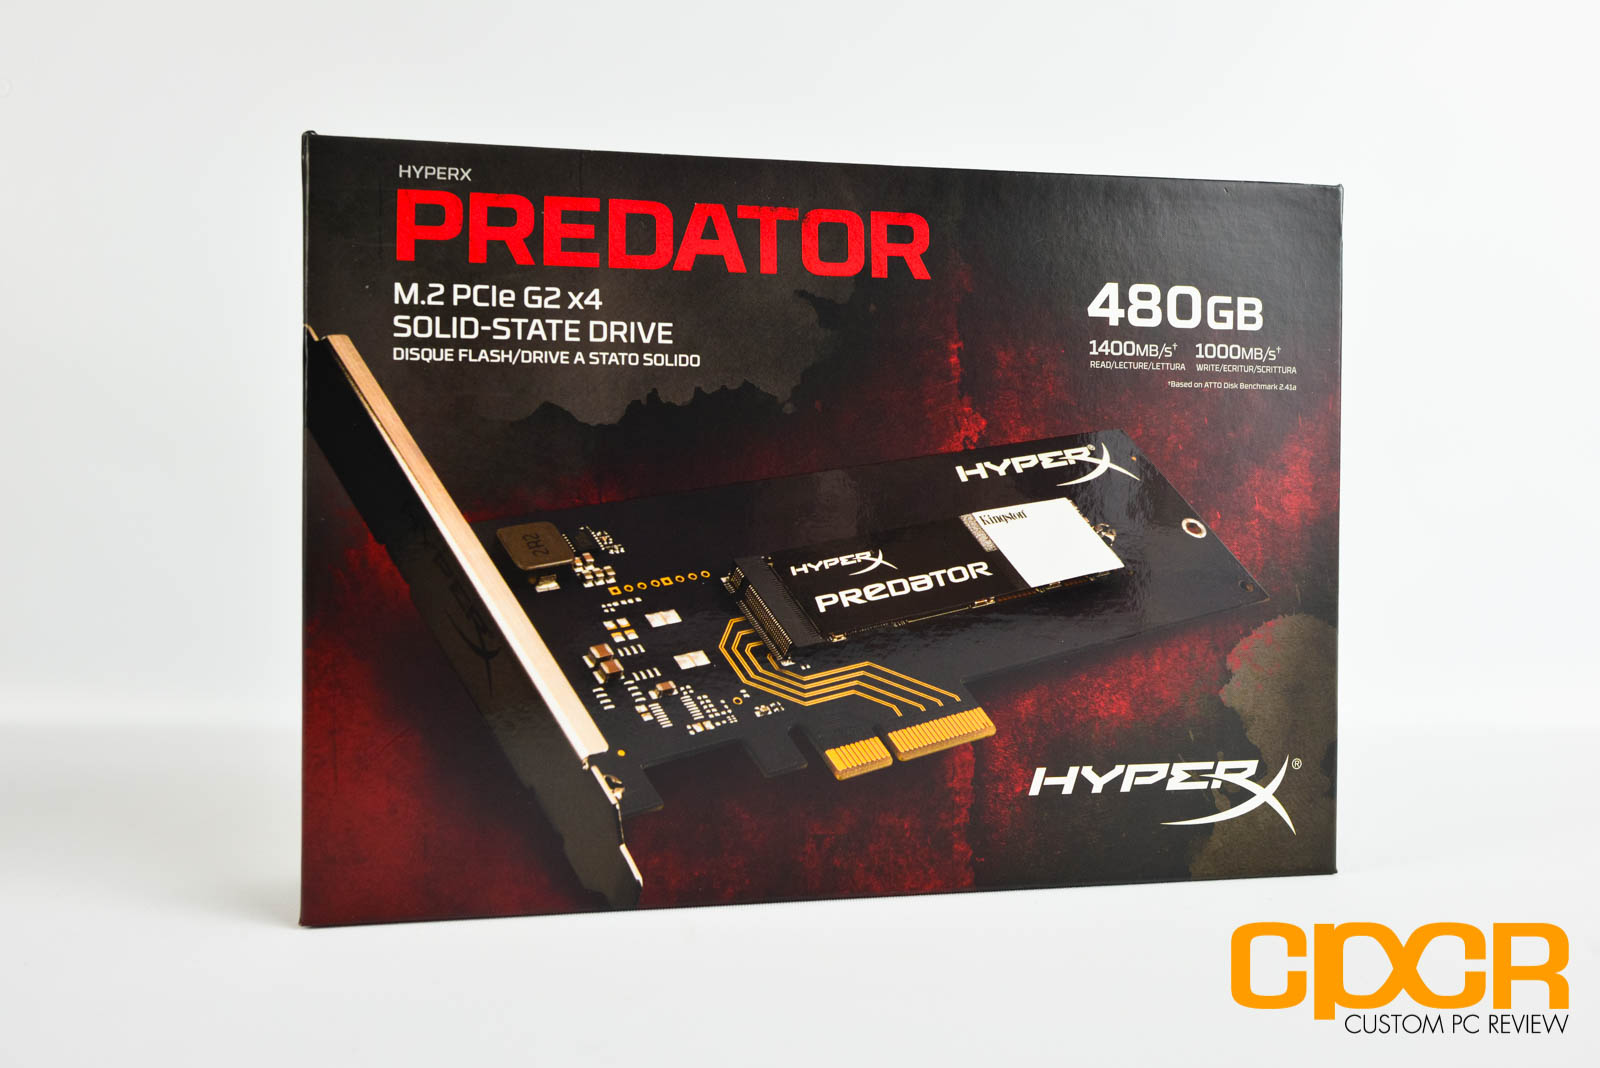
Here’s a look at the packaging for the Kingston HyperX Predator 480GB M.2 PCIe SSD.
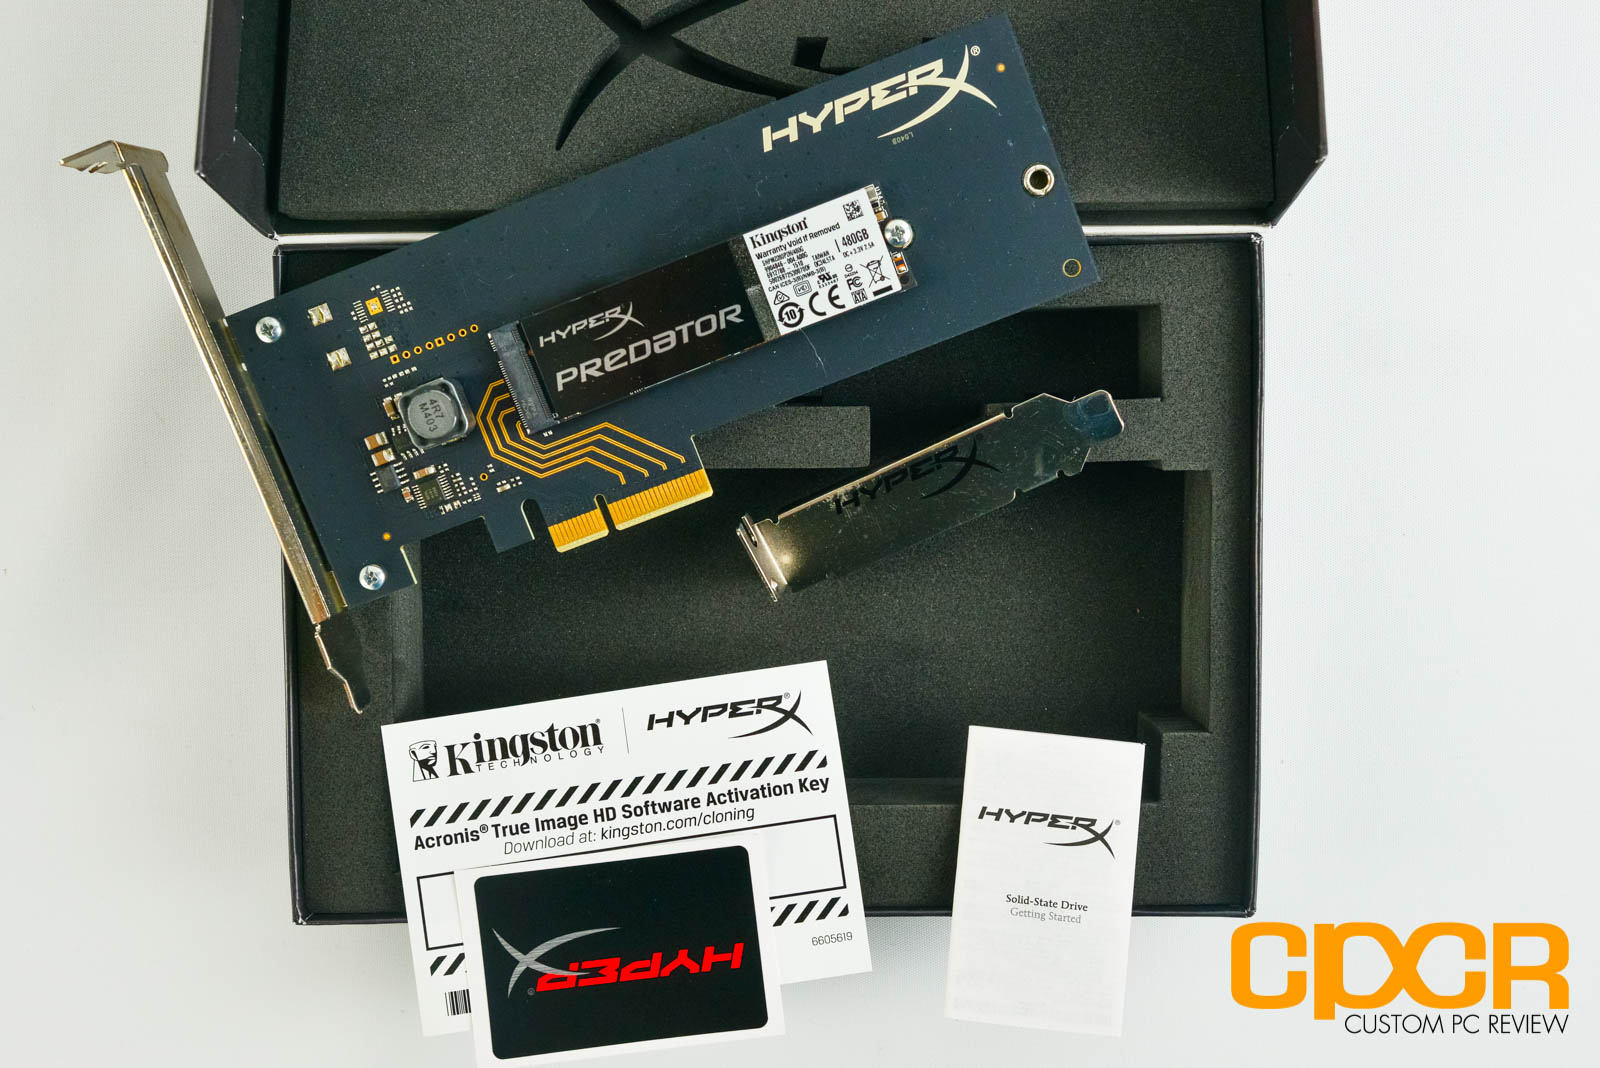
Included in the packaging we get some documentation, a HyperX sticker, Acronis True Image HD key, HHHL low profile bracket adapter, and M.2 to PCIe Gen 2 x4 HHHL adapter with HyperX Predator SSD attached.
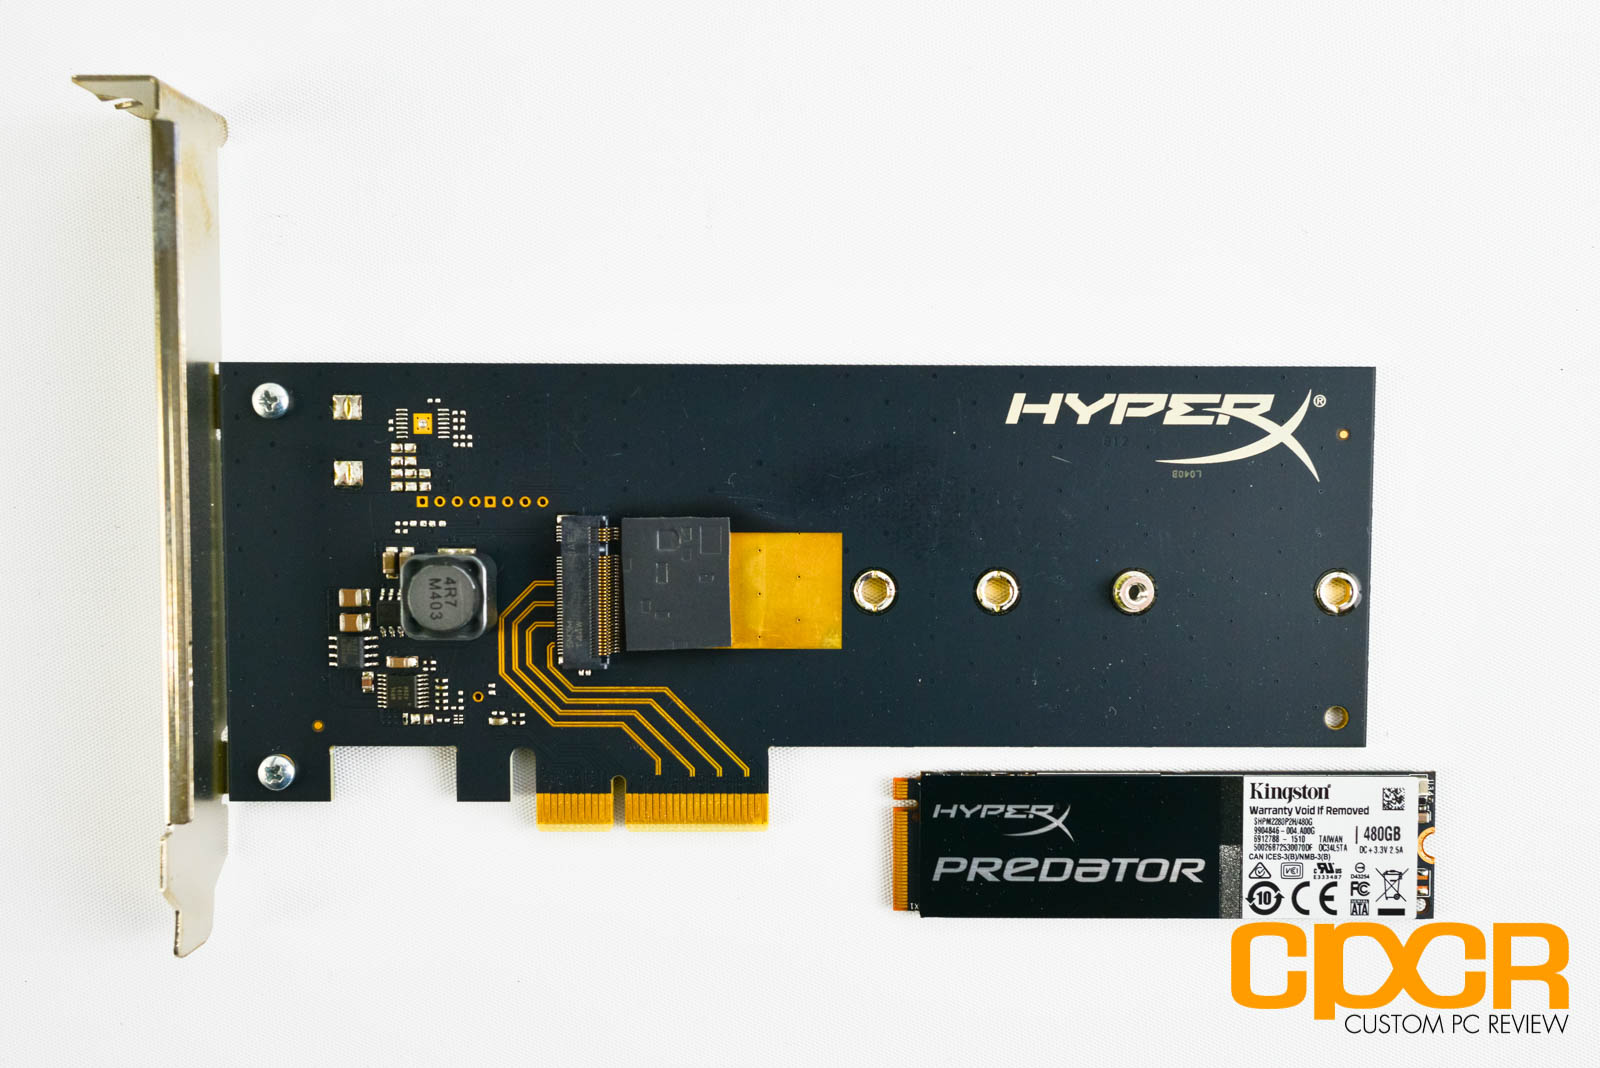
Currently Kingston offers the HyperX Predator SSD in either a bare M.2 drive package or with a HHHL adapter. Our specific sample included the HHHL adapter. Those who purchase the package with the HHHL adapter then later purchase a system with a M.2 slot included can remove the drive.
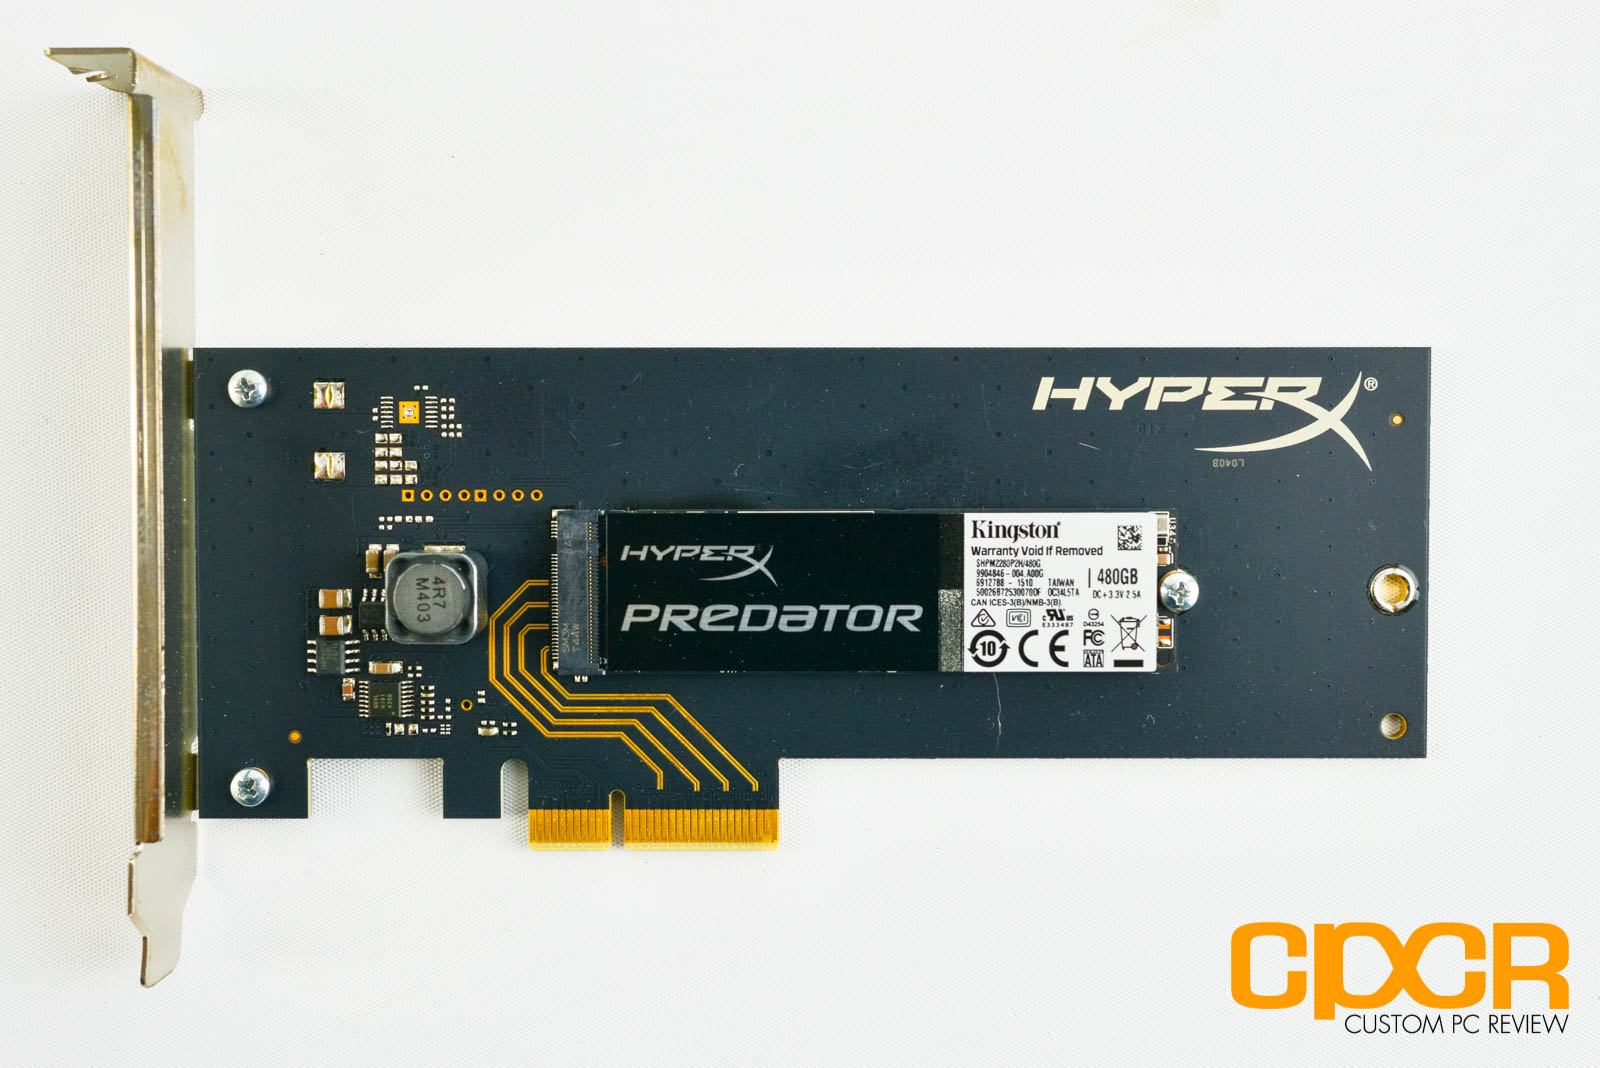
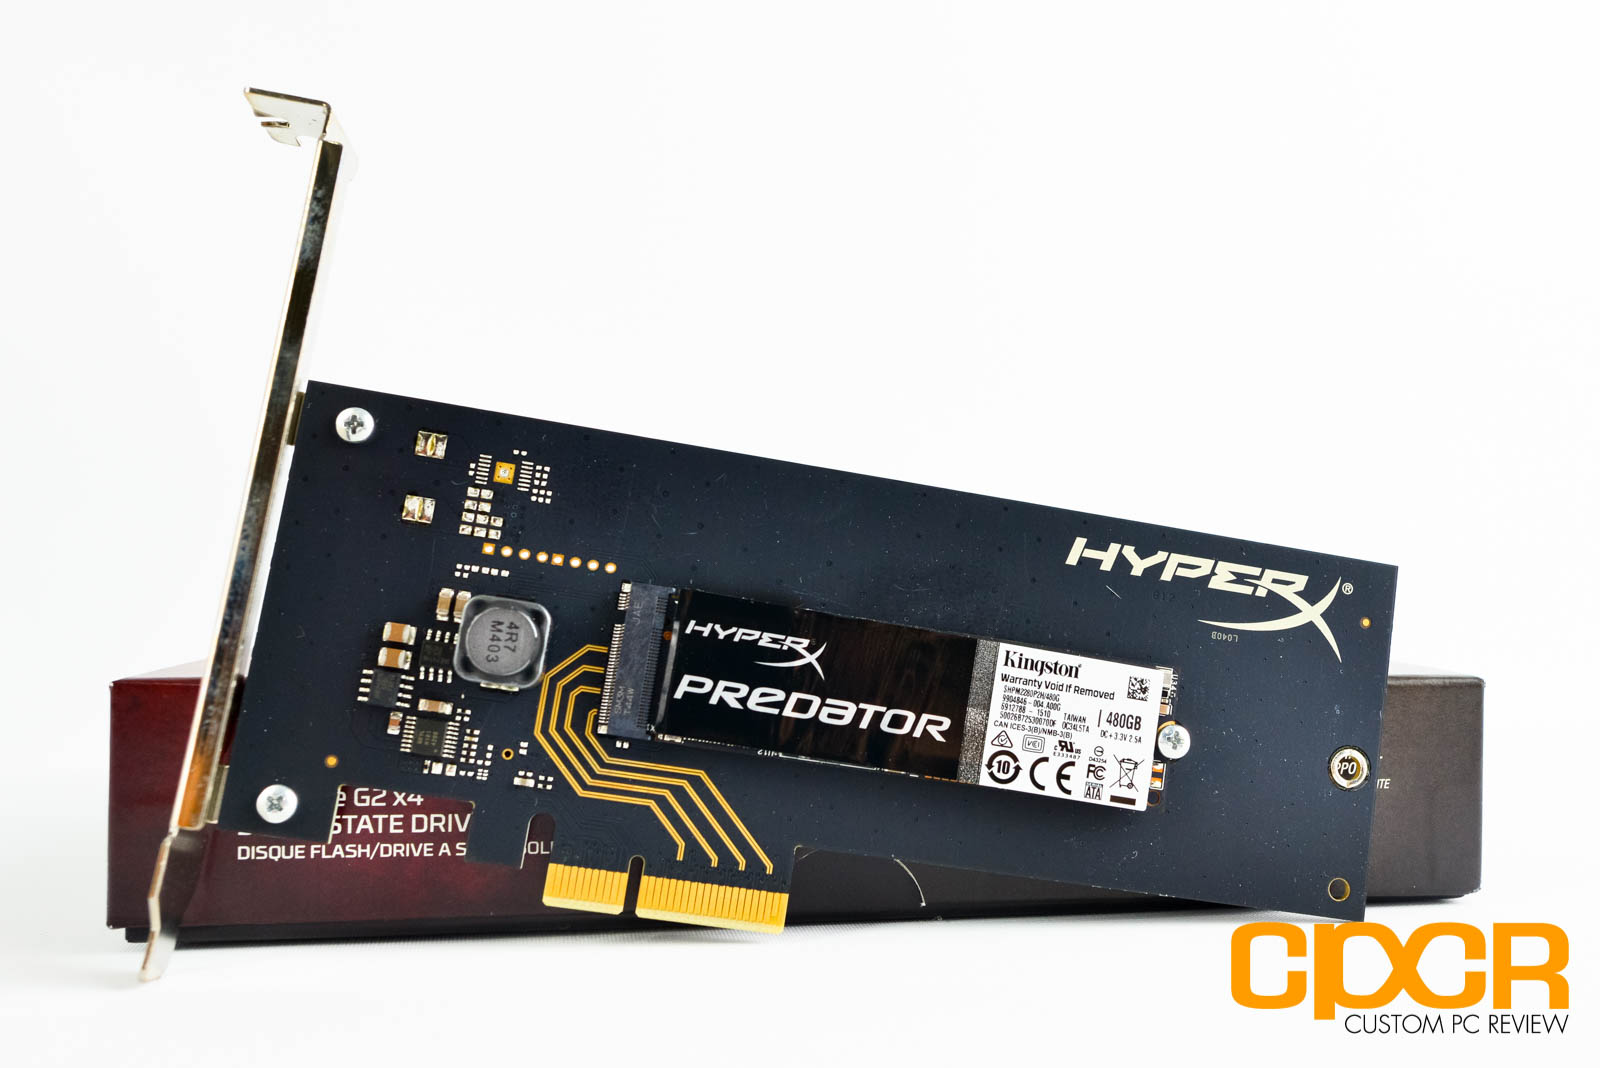
Here’s a look at the Kingston HyperX Predator PCIe SSD. The drive is in the M.2 2280 form factor and it utilizes the M edge connector keying which only supports a PCIe interface. This may cause issues for those with M.2 slots that use the B edge connector keying or the B & M edge connector keying.
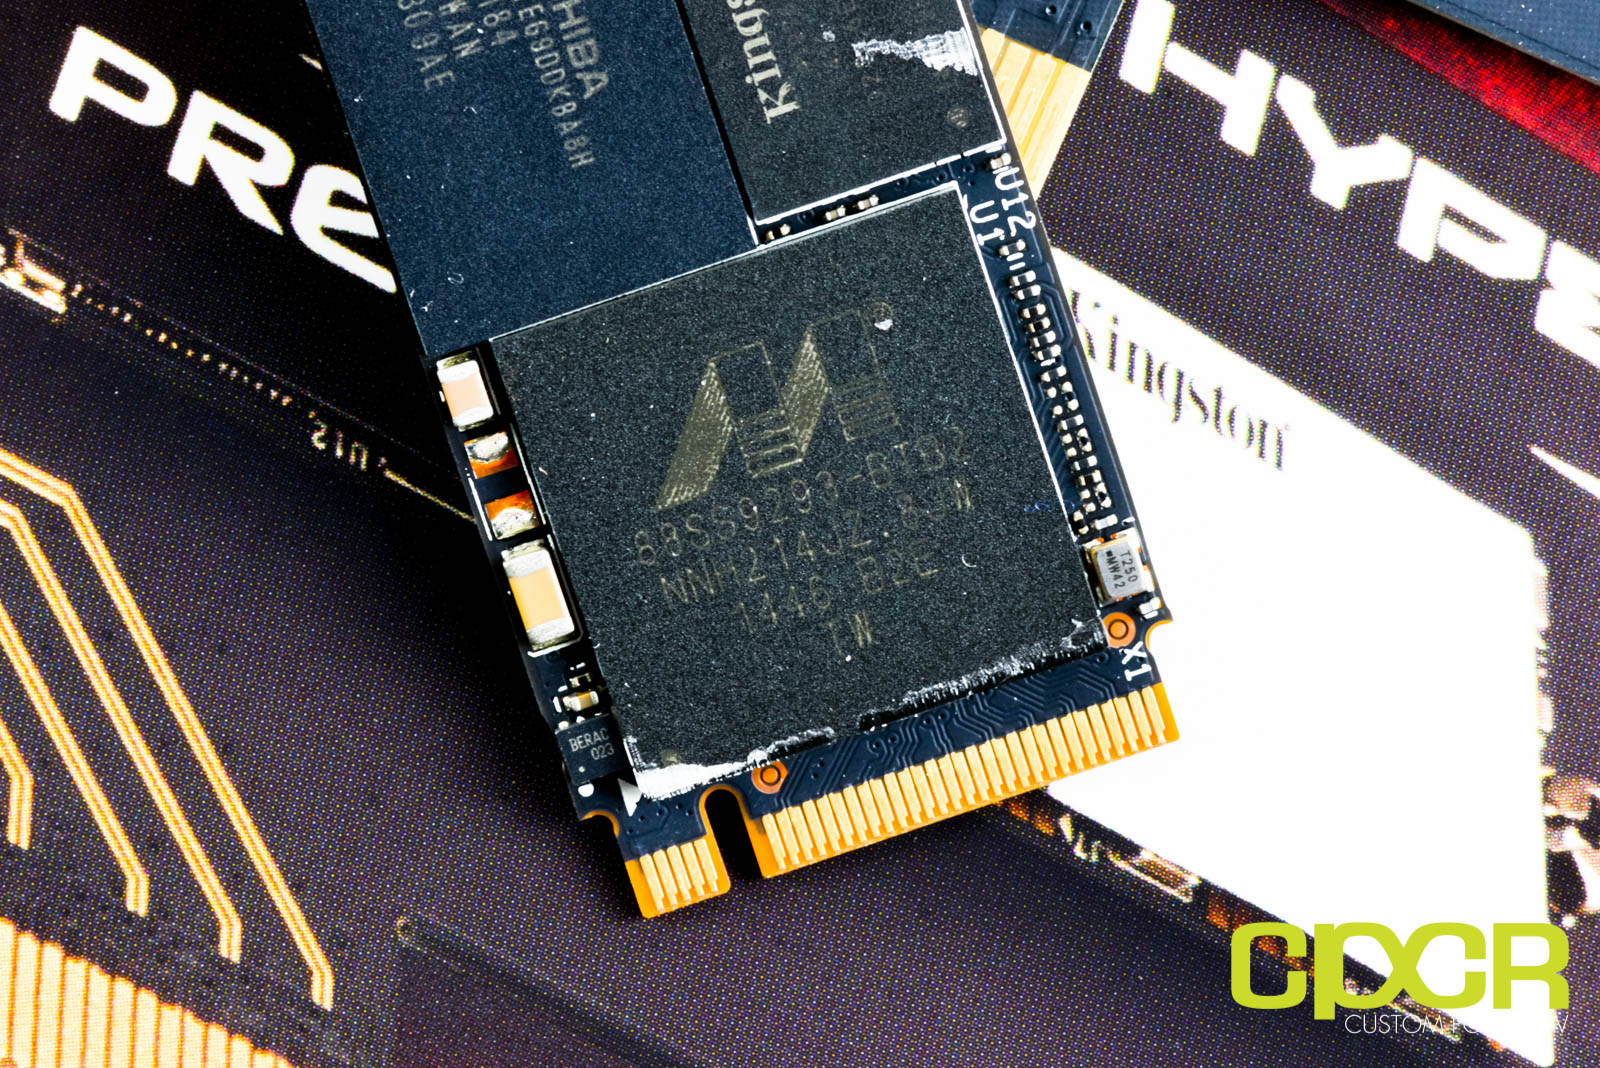
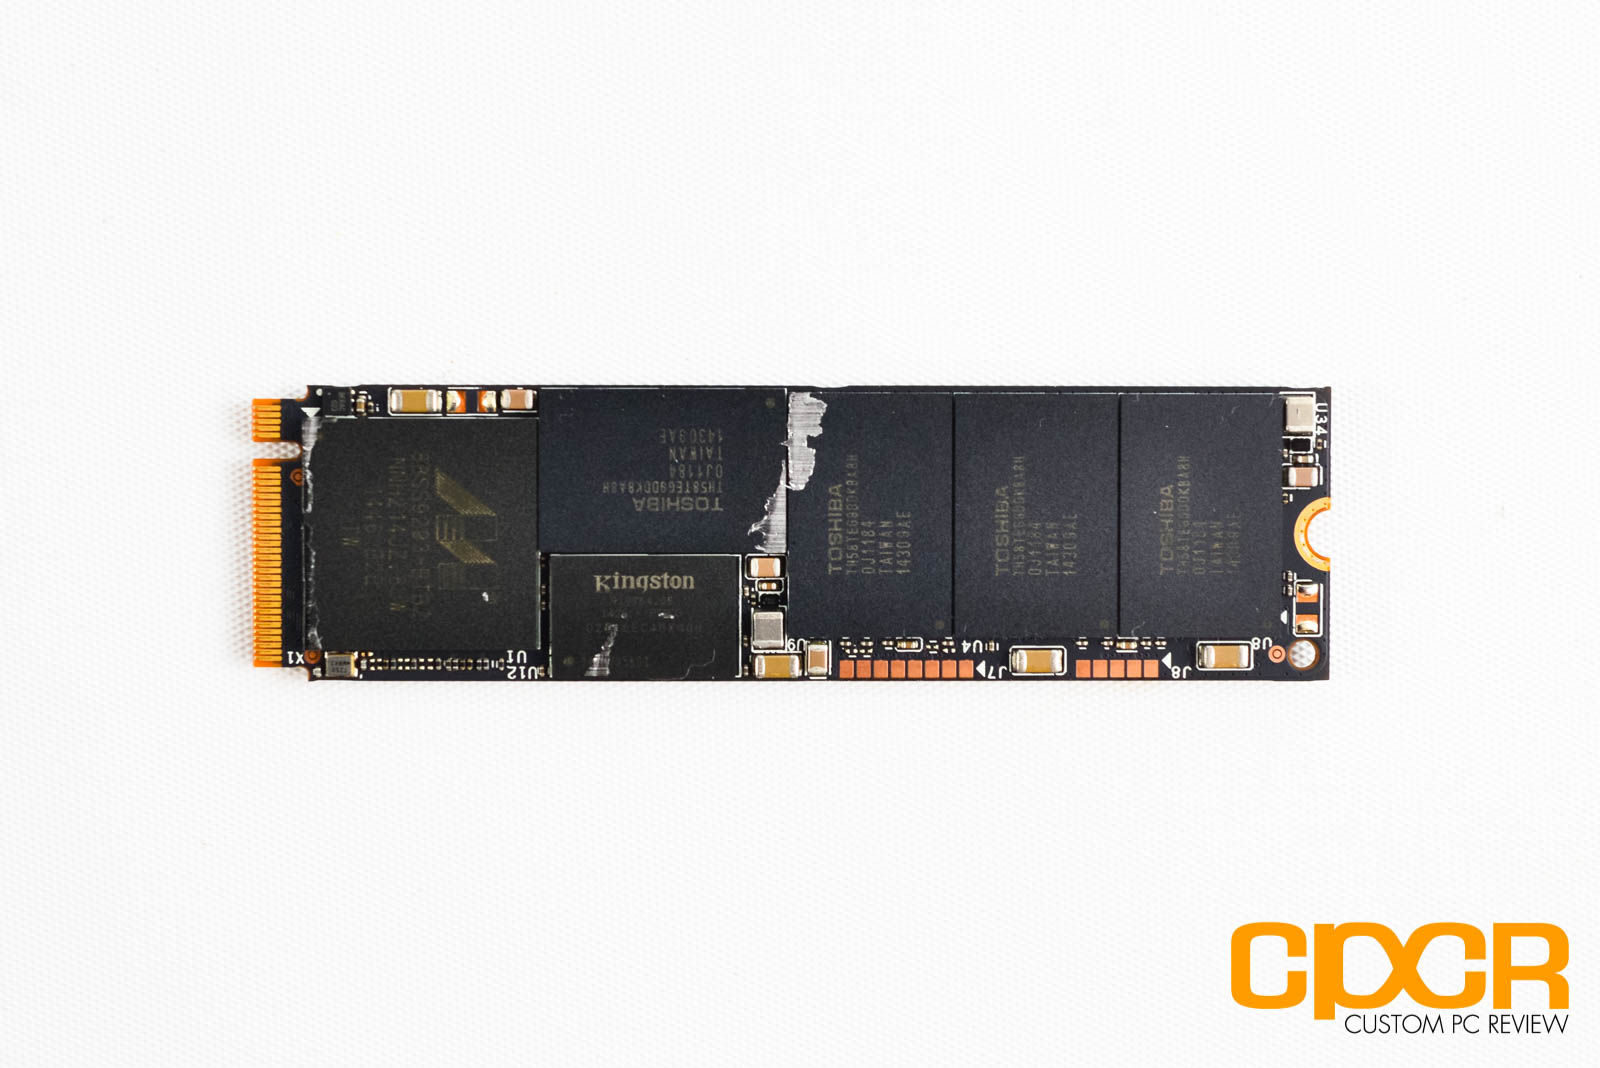
Kingston’s HyperX Predator is the first Marvell 88SS9293 (Codename Altaplus) based SSD we’ve had the opportunity of checking out. There’s not too much information about the new controller just yet, but what we do know is that it’s an 8-channel controller that natively supports PCIe Gen 2 x4.
We’ve reached out to Marvell for more information on the controller and we’ll be sure to update the article when/if we receive it.
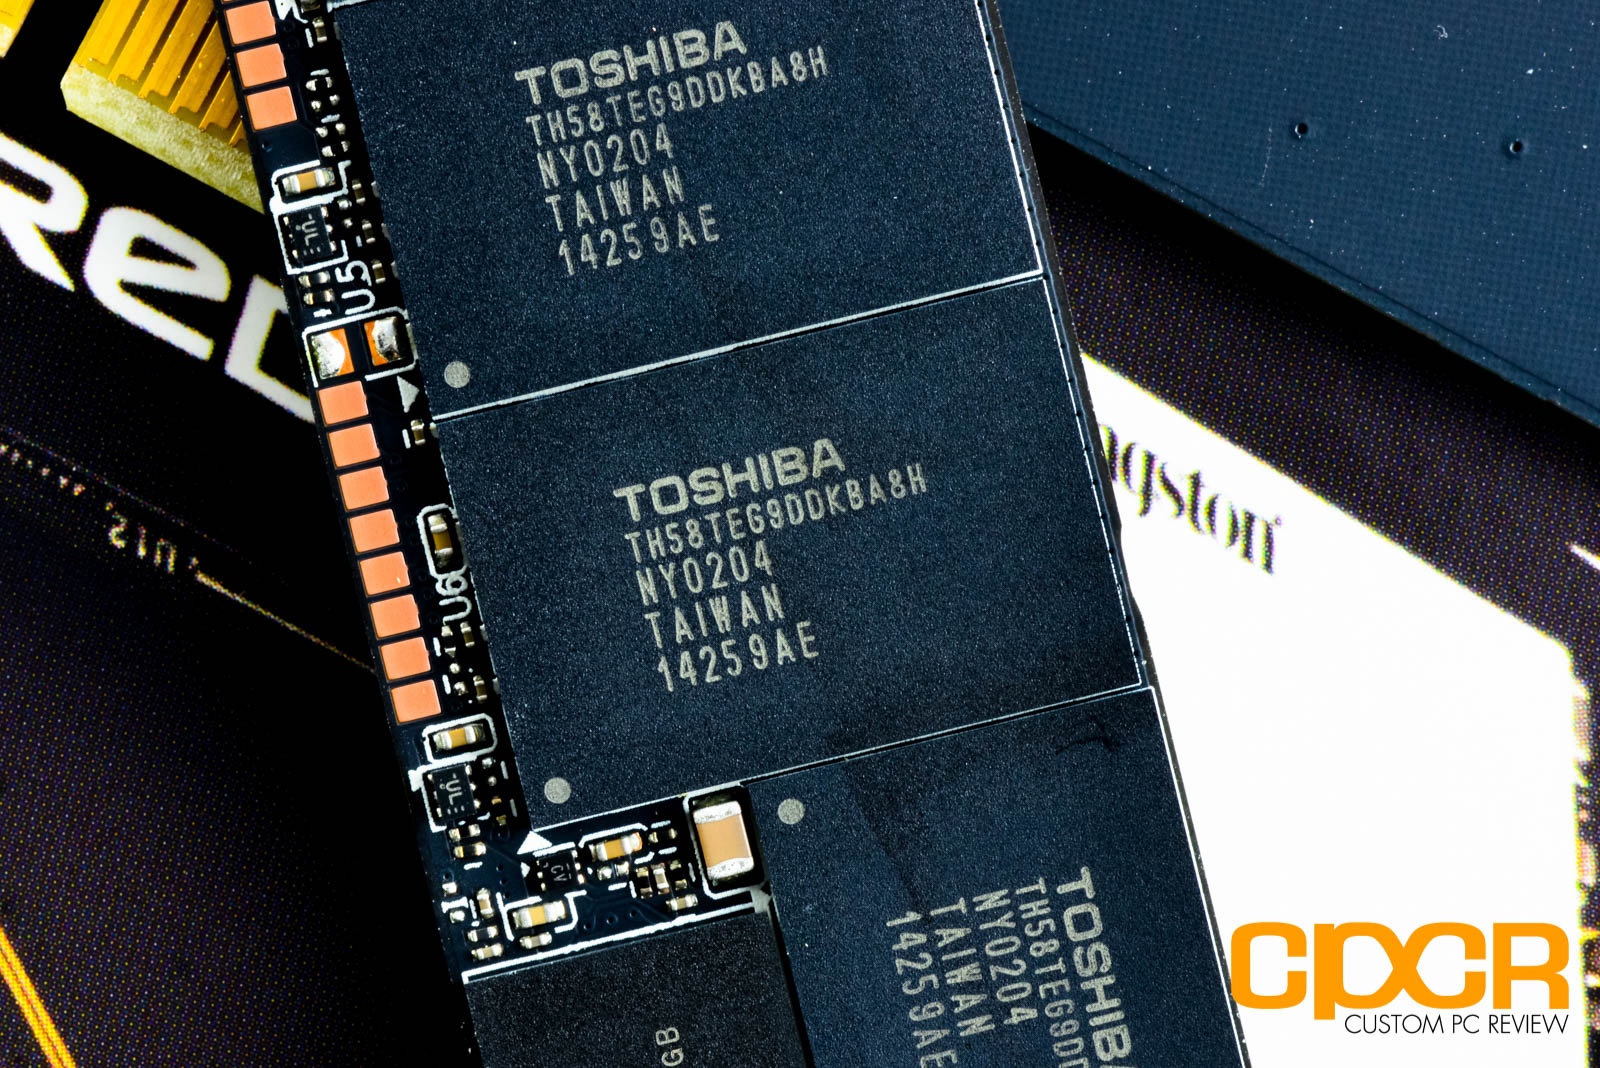
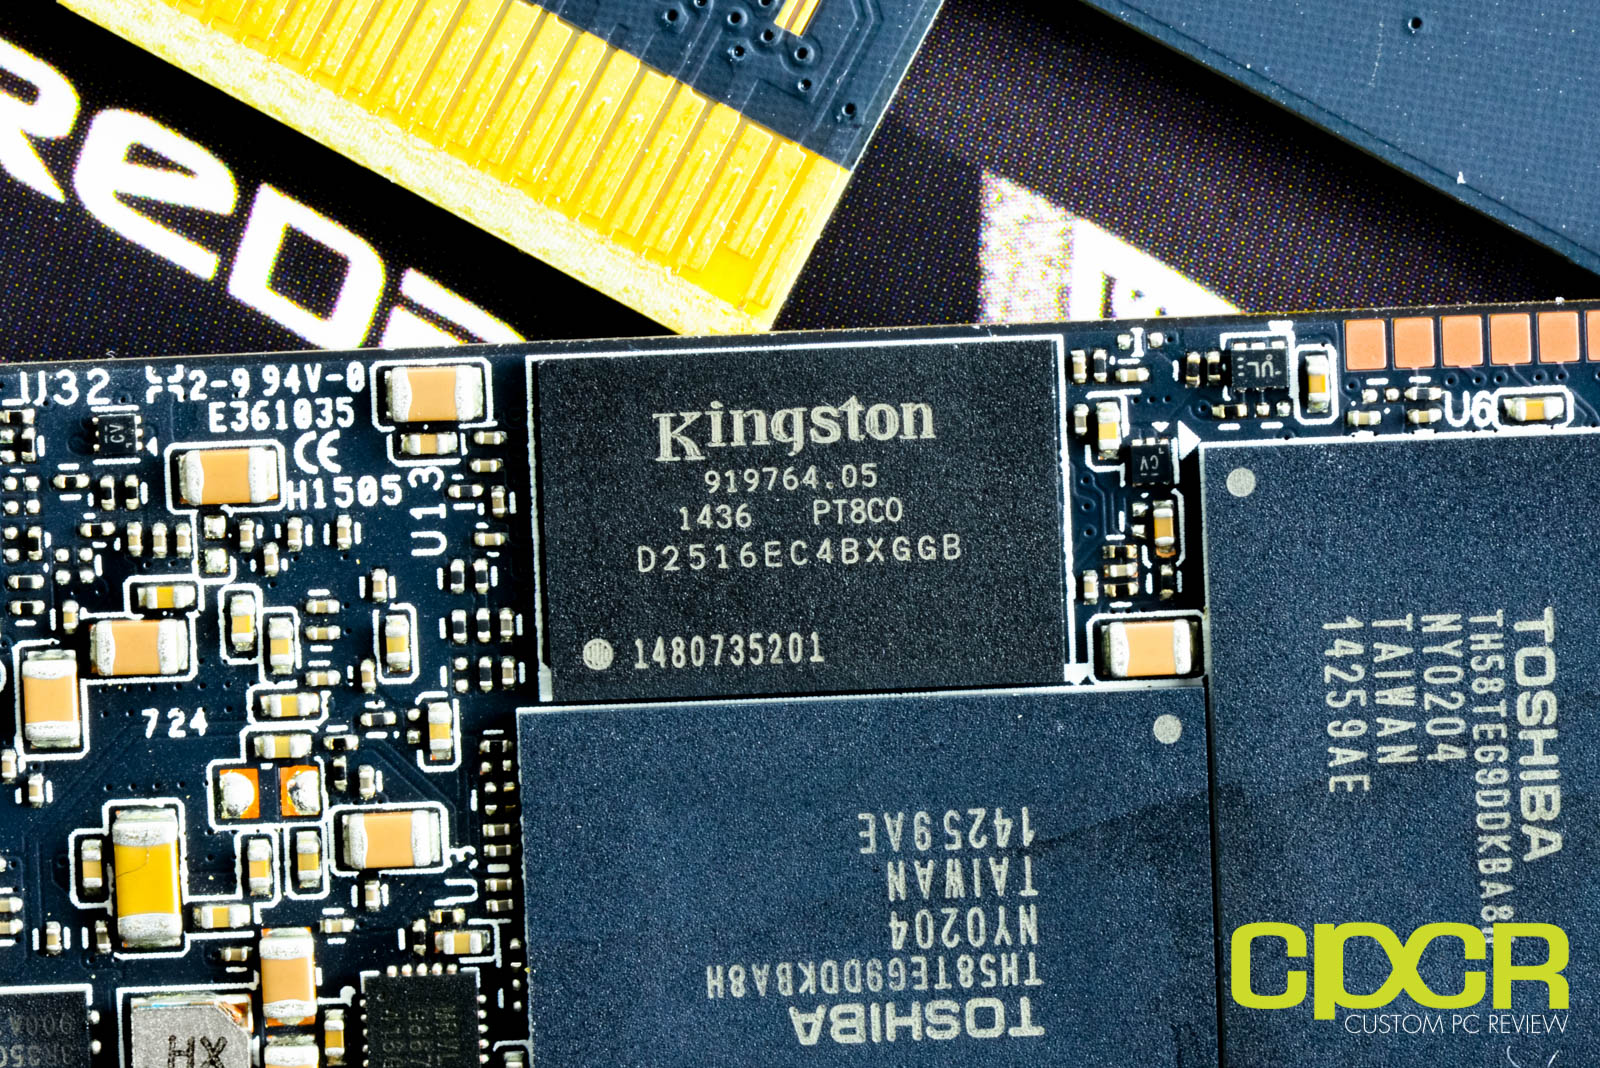
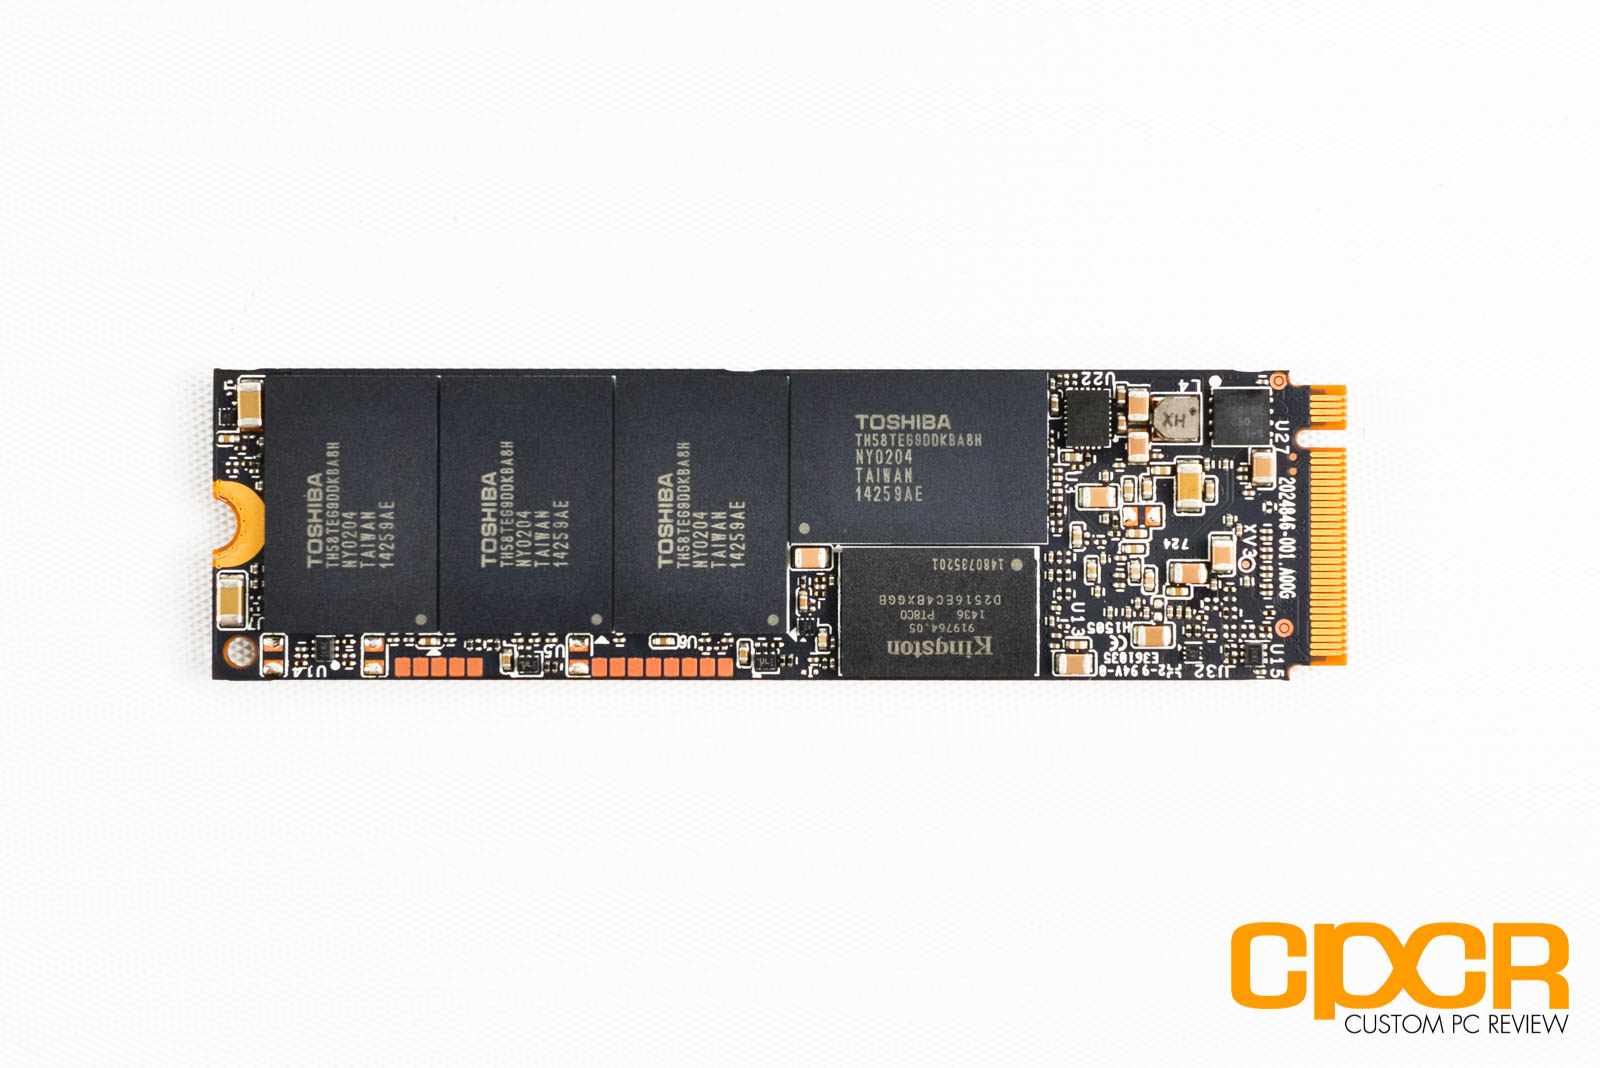
For the Kingston HyperX Predator PCIe SSD, Kingston uses 64Gb Toshiba A19nm Toggle Mode MLC. Toshiba uses 8x 64GB packages for a total of 512GiB. Kingston also employs two 512MB DDR3 DRAM chips for a total of 1,024MB DRAM buffer.
[section label=4. Testing Setup and Drive Info]
Testing Setup
| System | CyberPowerPC Gamer Xtreme 4200 |
|---|---|
| CPU | Intel Core i7-4770K |
| Motherboard | ASUS Z87-A |
| Memory | Kingston HyperX Genesis 16GB DDR3 2133MHz |
| Graphics | Intel HD4600 Graphics |
| Storage | OCZ Vertex 4 256GB |
| Power Supply | Corsair HX650 |
| Case | HSPC High Speed Tech Station |
| Optical Drive | ASUS OEM DVD Drive |
| Operating System | Windows 8 64 bit & CentOS 6.4 |
Special thanks to CyberPowerPC, Kingston, OCZ Storage Solutions and HSPC for sponsoring our test bench!
Crystal Disk Info
Kingston HyperX Predator 480GB
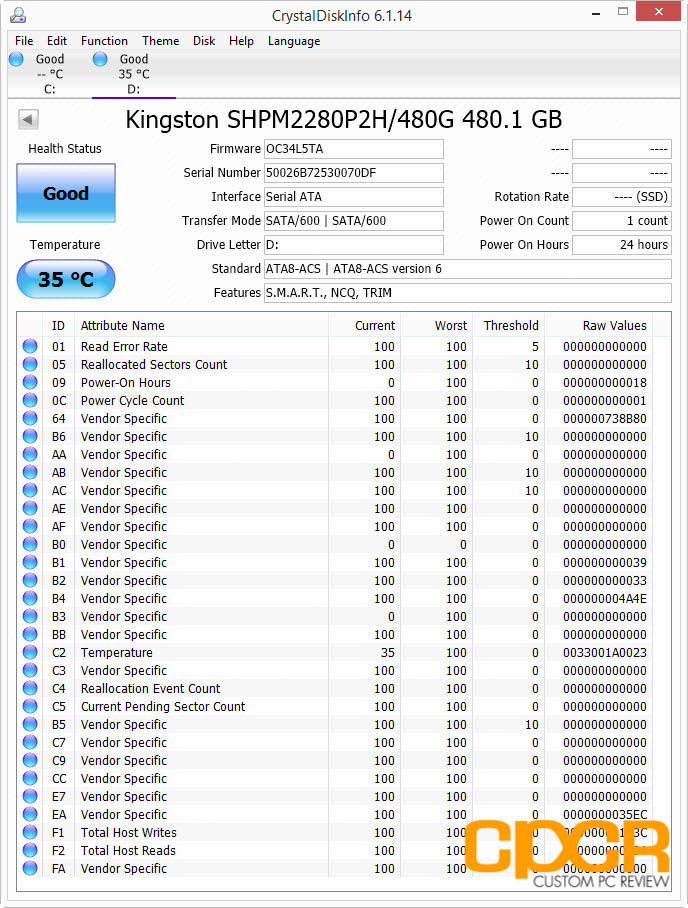
Today we’ll be reviewing the Kingston HyperX Predator 480GB PCIe SSD with the firmware OC34L5TA. The drive natively supports the AHCI protocol so it’s able to be recognized by Windows out of the box without any special drivers.
[section label=5. ATTO Disk Benchmark / AS SSD / Crystal Disk Mark]
Kingston HyperX Predator 480GB Performance
ATTO Disk Benchmark v2.46
ATTO Disk Benchmark is one of the industry’s oldest and most popular benchmarks for testing disk read/write speeds. This benchmarks allows read and write testing using predefined block sizes and gives us a good idea of read/write speeds with different sized files. Most SSD manufacturers prefer using this benchmark when advertising SSDs as it tests using compressible data, which tends to yield best performance.
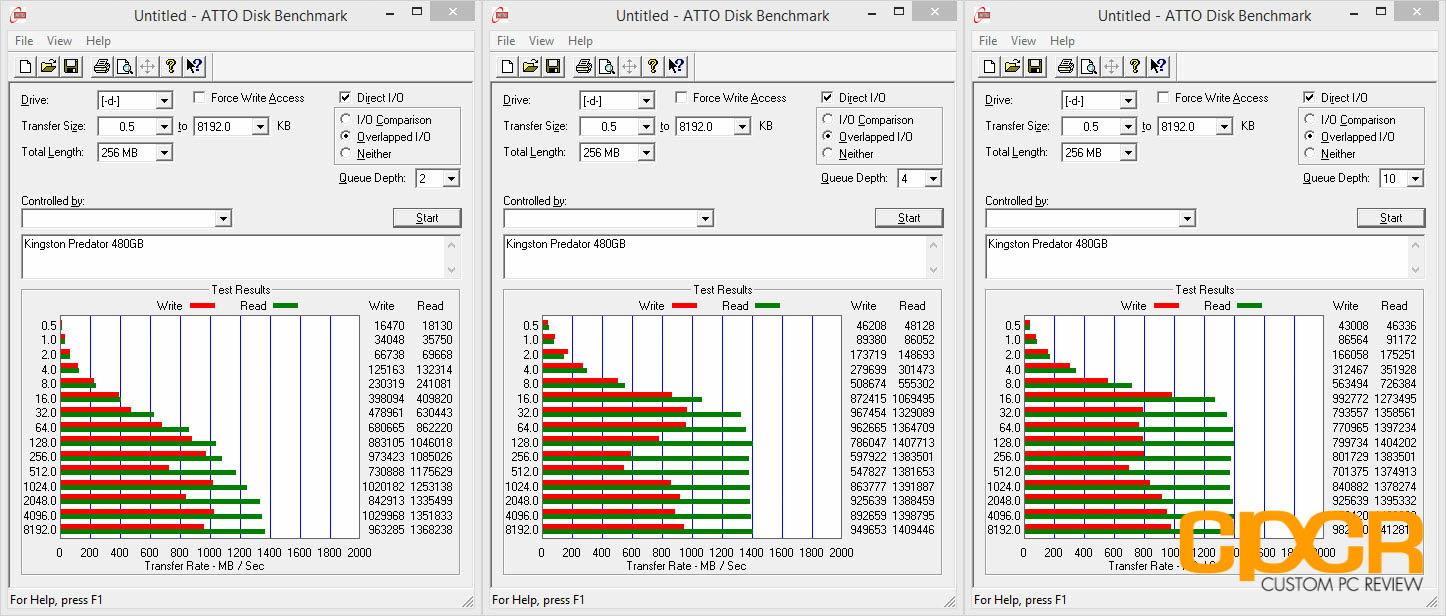
Performance Analysis
Since Kingston’s HyperX Predator uses a PCIe Gen 2 x4 bus, it’s capable of significantly faster speeds than your average SATA drives which are currently bottlenecked by the SATA 6Gb/s interface. In ATTO Disk benchmark, the Kingston HyperX Predator 480GB was able to reach a maximum performance of up to 1,411 MB/s sequential reads and 1,020 MB/s sequential writes.
AS SSD Benchmark
AS SSD is a very commonly used benchmark used to measure SSD performance in sequential, 4K, 4K QD64 and latency. Tests are run using 100% incompressible data. AS SSD also outputs a final score at the conclusion of the test based off the overall performance of the drive.
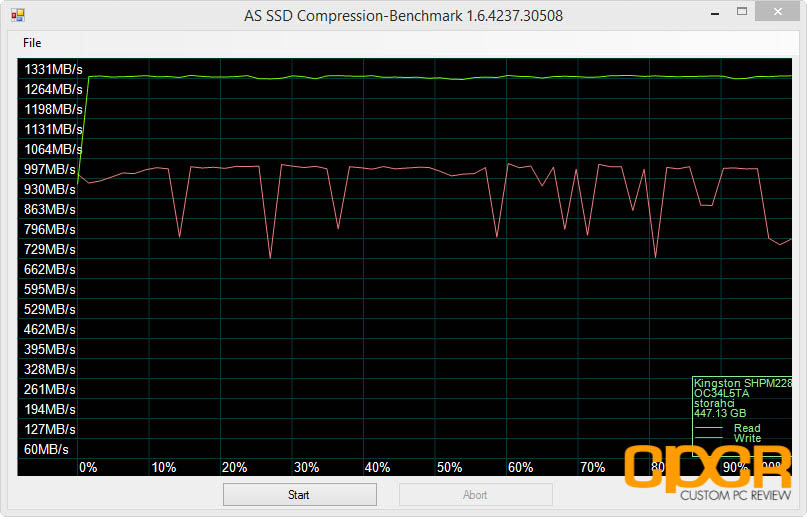
Additionally, we also run AS SSD’s included compression benchmark which tests the drive using data of varying compressibility. Some SSDs such as SandForce based SSDs tend to perform significantly better when the data is compressible.
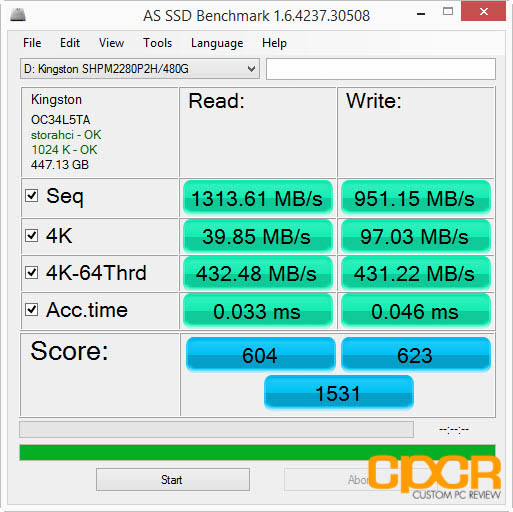
Performance Analysis
Again, the Kingston HyperX Predator is incredibly quick here, clocking 1,314 MB/s sequential reads and 950 MB/s sequential writes.
Crystal Disk Mark 3.0.1 x64
Crystal Disk Mark is another popular benchmark which allows us to measure both sequential read/write speeds as well as random read/write speeds. With this benchmark, tests can be run using both random fill (incompressible data) and 0 fill (compressible data). Realistically in typical computer usage scenarios, data being transferred will consist of a mixture of both incompressible and compressible data.
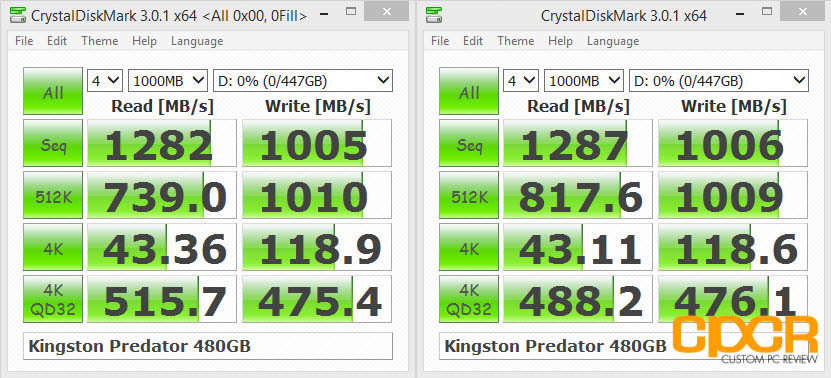
Performance Analysis
Crystal Disk Mark mirrors the results we’ve seen previously as well. It’s always awesome to see performance northwards of 1GB/s.
[section label=6. PC Mark 7 / PC Mark 8]
Kingston HyperX Predator 480GB Performance
PC Mark 7 Storage Benchmark
The PC Mark 7 storage benchmark is a trace based benchmark that evaluates the SSD under many different real world environments such as gaming, multimedia editing, etc. PC Mark 7 uses a relatively light workload, which represents a typical mainstream client storage sub-system workload.
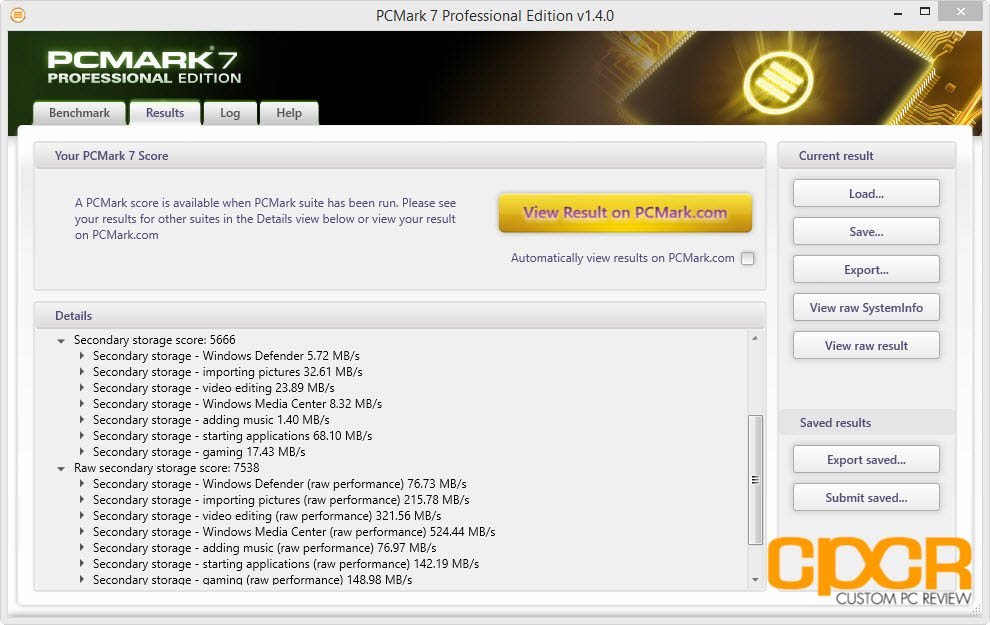
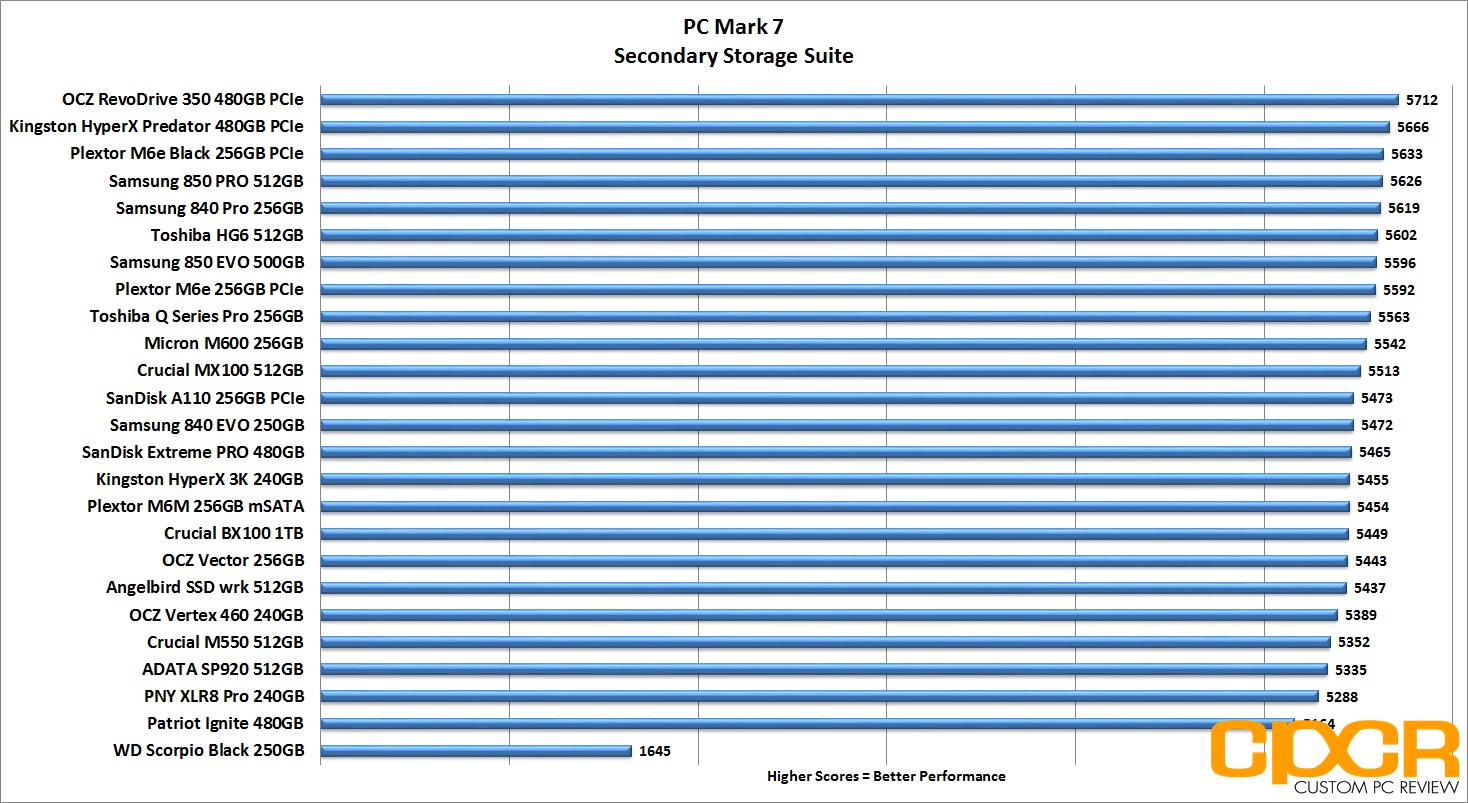
Performance Analysis
There’s no doubt that the Kingston HyperX Predator is fast, and our PC Mark 7 testing reflects this very well. The Kingston HyperX Predator was able to beat both the fastest SATA and M.2 drives we’ve tested to date coming in just behind the monstrous 4x SandForce SF-2281 powered OCZ RevoDrive 350.
PC Mark 8 Expanded Storage Benchmark
With the introduction of PC Mark 8 2.0.228, Futuremark added the option for an Expanded Storage Benchmark which is literally designed to bring any storage system its absolute limits. The new PC Mark 8 Expanded Storage Benchmark takes around 24 hours to run and for our purposes, we’ll be using the consistency test which measures performance consistency, degradation tendency, and recovery speed of a storage system.
Consistency Test
Full details on the consistency test can be found in the PC Mark 8 Technical Guide here. For the more simplified version, the test is basically a near 24 hour, five phase benchmark – three of which we’ll be reporting on in our results below.
- Phase 1 is a precondition phase designed to “dirty” the drive with random data. The entire drive is filled twice to the capacity of the drive.
- Phase 2 is a degrade phase where the drive is hammered with tons of random data followed by a performance test run. This is done 8 times.
- Phase 3 is the steady state phase where the drive is once again hammered with tons of random data followed by a performance test run. This is done 5 times.
- Phase 4 is the recovery phase where the drive is given 5 minutes to rest followed by a performance test run. This is done 5 times.
- Phase 5 is the clean up phase where the drive is simply secure erased.
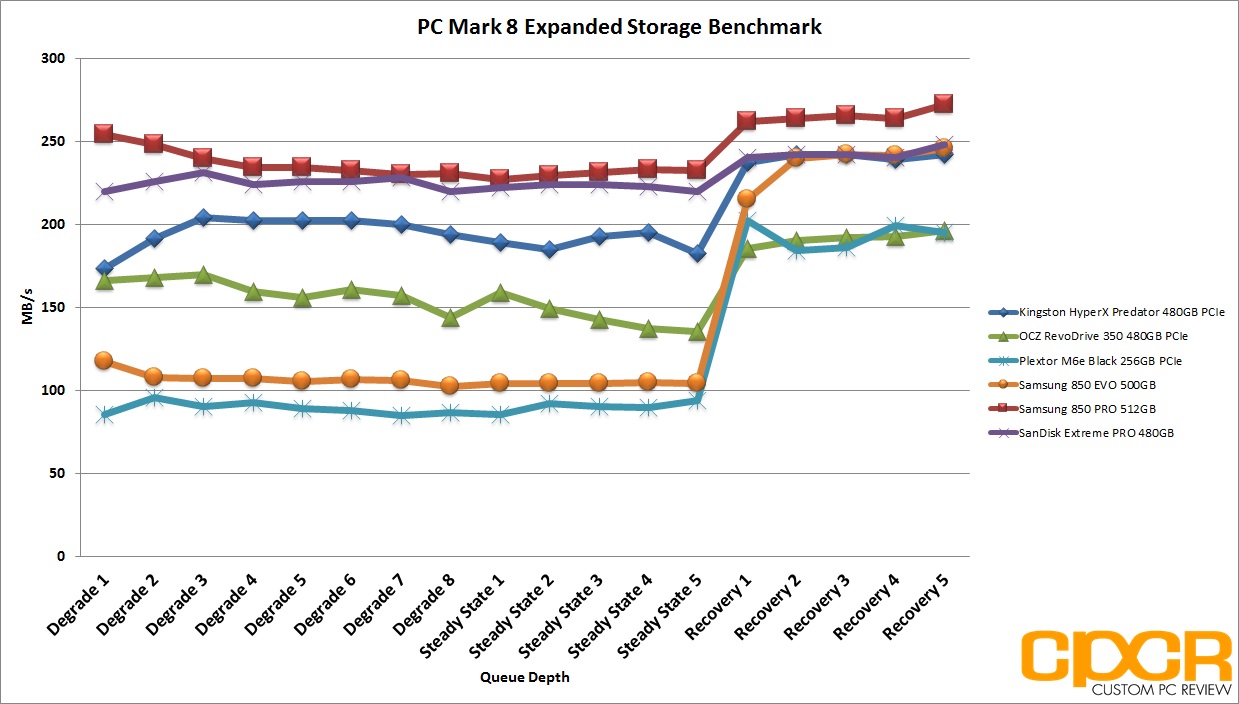
Performance Analysis
Although the Kingston HyperX Predator is still outperformed by the Samsung 850 PRO and SanDisk Extreme PRO when faced with extremely heavy loads, its performance is still very good, outperforming the rest of the drives tested today. The drive also does a very good job at recovery, which is indicative of good garbage collection and drive maintenance routines.
[section label=7. FIO – FOB]
Kingston HyperX Predator 480GB Performance
FIO (Flexible I/O Tester)
FIO, which stands for Flexible I/O Tester, is basically what its name says – a flexible I/O tester / I/O workload generator. Whereas all the benchmarking tools we’ve used previously are fantastic, easy to use benchmarking tools that provide a good snapshot of SSD performance, they do lack a lot of versatility, especially for more complex and in-depth operations such as custom queue depths, block sizes, test run times, etc. While the testing that follows may not pertain to typical consumer usage, they do help give us a much more in-depth look at each individual product’s strengths and weaknesses when they’re pushed to the limits.
FIO – FOB (Fresh Out of the Box) Testing
When SSDs are brand new and Fresh Out of the Box, they’re generally able to perform at or outperform their advertised speeds, but unlike traditional hard drives, performance on SSDs begin to degrade over time as they become more and more used. This is because while SSDs are new, all bits on the SSD are empty, so they can instantly be programmed with data. However, once data gets programmed in, even if it’s deleted in the filesystem the actual data will still stay programmed on the NAND itself unless some sort of garbage collection routine comes in to wipe the data. Unfortunately, in order to write new data onto “dirty” NAND, the NAND first needs to go through an erase cycle to erase the old data before a program cycle can happen to program new data, which as you may imagine takes more time than just a simple program cycle. As this only happens when writing new data onto the SSD, you’ll generally see less performance degradation on reads and more performance degradation on writes.
For our FOB testing, we run a secure erase on the SSD then run each test sans any preconditioning. This will provide us with the highest level of performance the SSD is capable of and is likely never to be seen ever again once the SSD goes into a used state.
Our testing will include 4K read testing, 4K write testing, and 4K 70/30 read/write mix testing at queue depths of 1,2,4,8,16,32,64,128,256. The reason we’ve also included 4K 70/30 read/write mix testing is simply because most real world workloads will always fall somewhere between 0% write and 100% write rather than one or the other. Since client usage is much more read heavy, we’ll be using the 70/30 read/write mix.
For general client usage, performance will fall somewhere between queue depths of 1-4 whereas servers and other enterprise applications will easily see queue depths of 32 or greater.
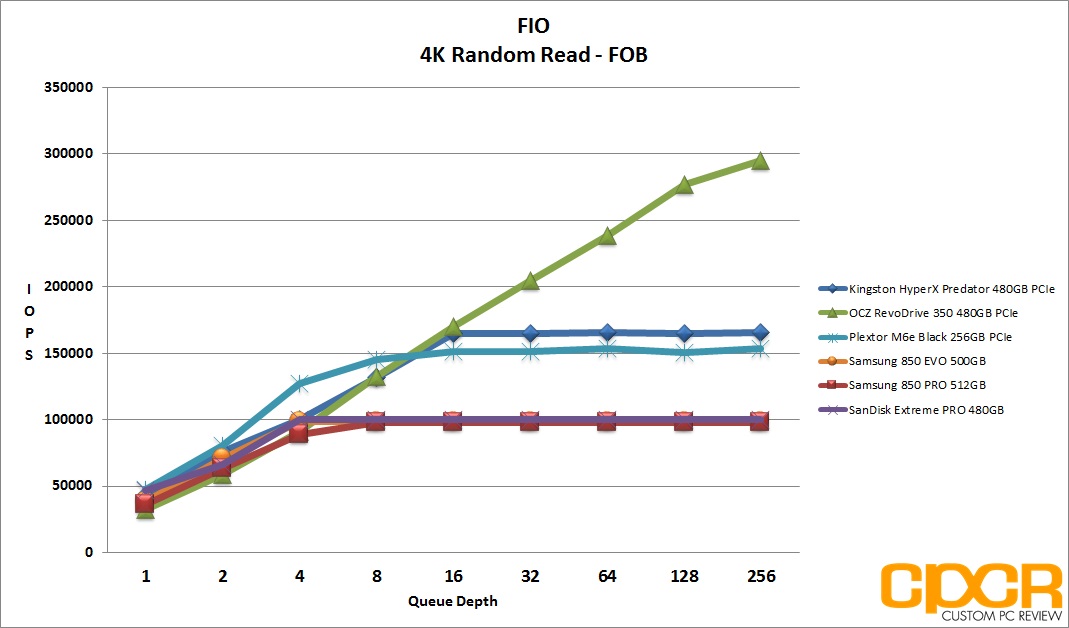
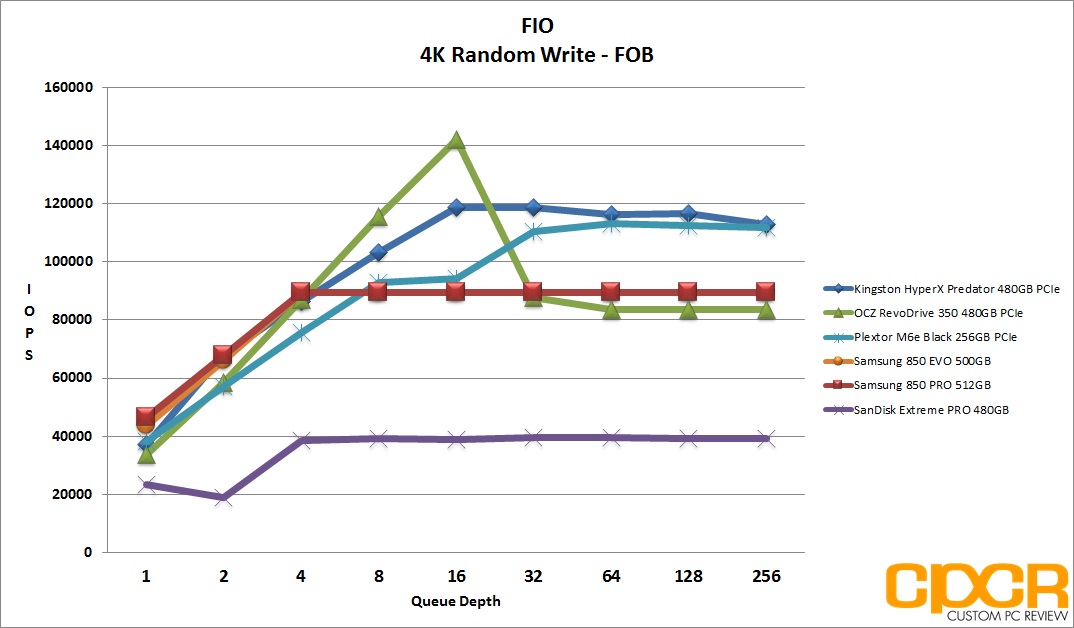
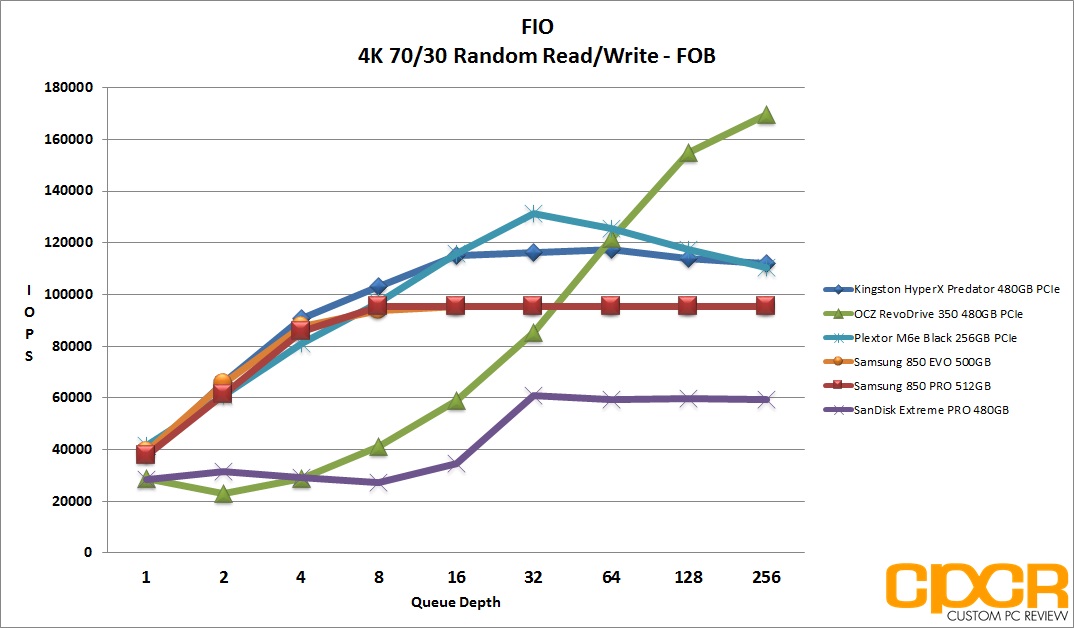
Performance Analysis
With the limitations of SATA removed, the Kingston HyperX Predator was able to blow by even the fastest SATA drives on the market with ease. In its fresh state, the HyperX Predator 480GB was able to reach an incredible 165,000 IOPS 4K random read and an incredible 118,000 IOPS 4K random write. Mixed 4K read/write performance is extremely good as well as the drive was able to reach 116,000 IOPS.
[section label=8. FIO – Steady State]
Kingston HyperX Predator 480GB Performance
FIO – Steady State Testing
After prolonged use of an SSD, it will reach “steady state” where performance levels off to a minimum level. The FOB state is the “best case scenario” for SSD performance while “steady state” is going to be your worst. Here, we ran the exact same set of benchmarks we just completed in the FOB state; except this time around, we’ll be preconditioning the drive by filling 100% of the drive’s LBAs with two sequential passes of 128k data followed by hammering the drive for six hours with 4K random data prior to actual testing.
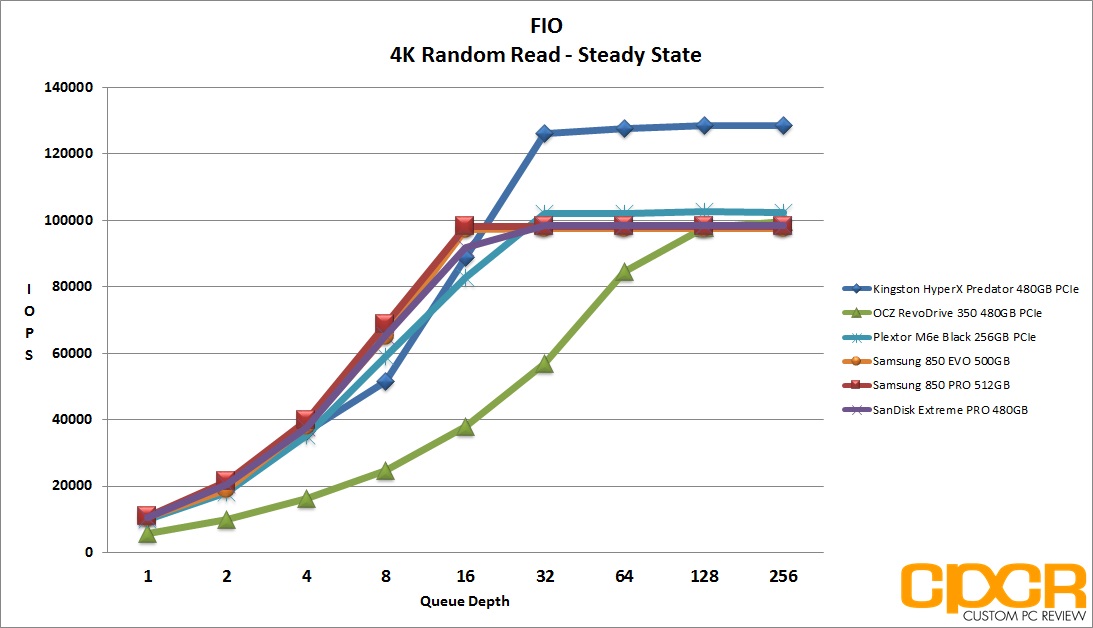
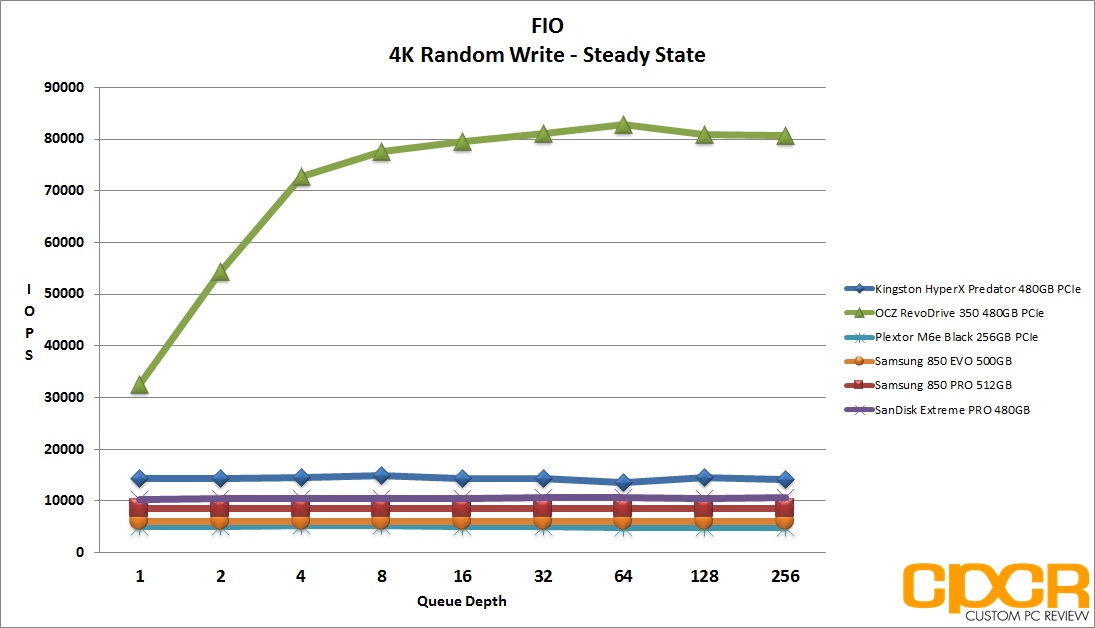
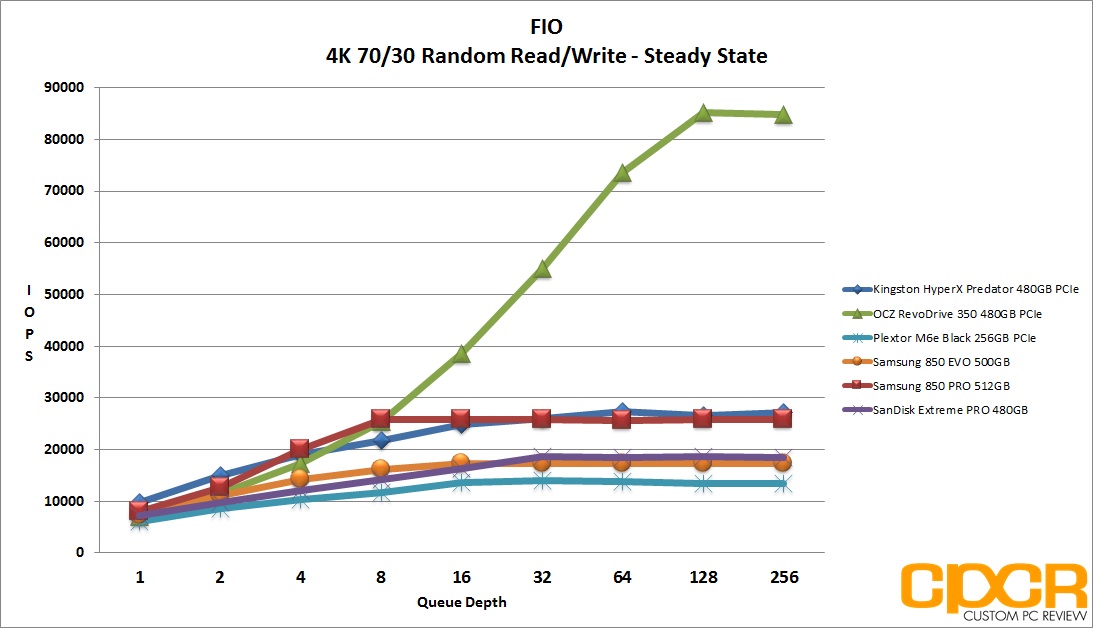
Performance Analysis
Since I haven’t had much experience with the Marvell 88SS9293 controller onboard the Kingston HyperX Predator, I was pleasantly surprised to see that steady state performance is quite good. Steady state 4K random read performance is among the best I’ve seen on a consumer SSD coming in just shy of 130,000 IOPS. Steady state 4K random write performance is decent was well with performance coming in at ~14,500 IOPS, beating both the enthusiast oriented Samsung 850 PRO and SanDisk Extreme PRO.
[section label=”9. FIO – 4K Random Write Consistency”]
Kingston HyperX Predator 480GB Performance
FIO 4K Random Write Consistency Testing
Another one of the benefits of testing with FIO is the flexibility of running consistency tests, which is one of the most important metrics when considering SSDs going forward. Looking at the results of our benchmarks such as ATTO Disk Benchmark and Crystal Disk Benchmark, we can see that practically every top tier SSD is capable of saturating SATA 6Gb/s in the FOB state. However, what really differentiates these SSDs is their ability to hold a certain level of performance even after extended periods of use.
For our consistency testing, we used a fairly standard method, which includes both filling up 75% of capacity as well as 100% capacity twice with sequential 128k data followed by the actual test itself, which is simply running 4K random writes at a queue depth of 32. By recording the IOPS every second for 2,000 seconds, we’re able to get a good look at what kind of performance can be expected when the drive is relatively new, when it’s heading towards steady state, and when it’s actually in steady state.
[tabgroup]
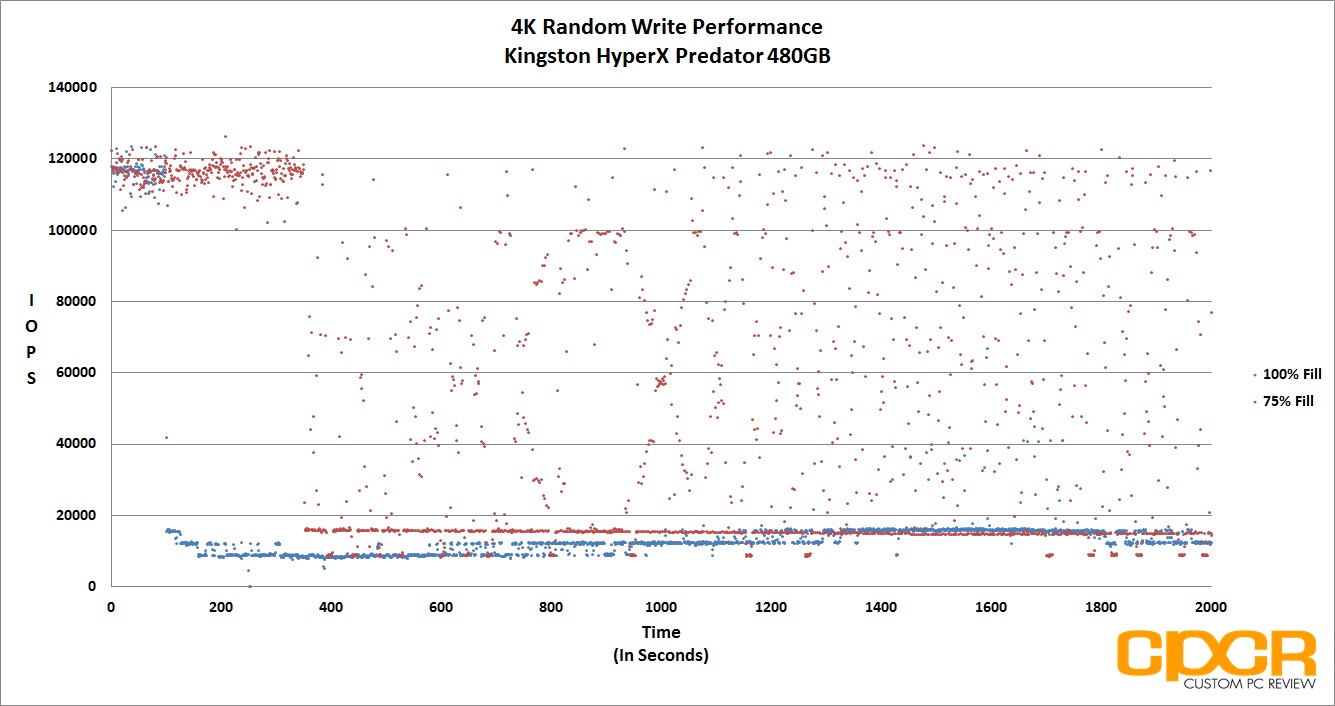
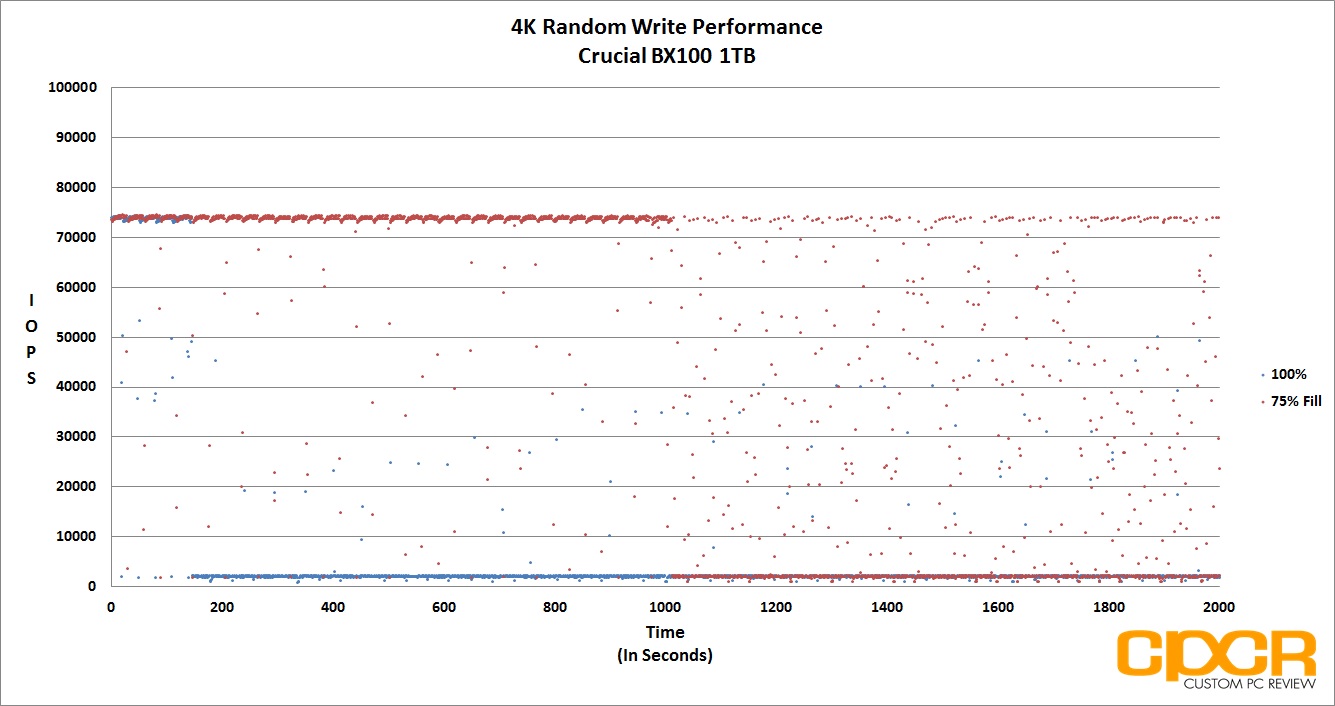
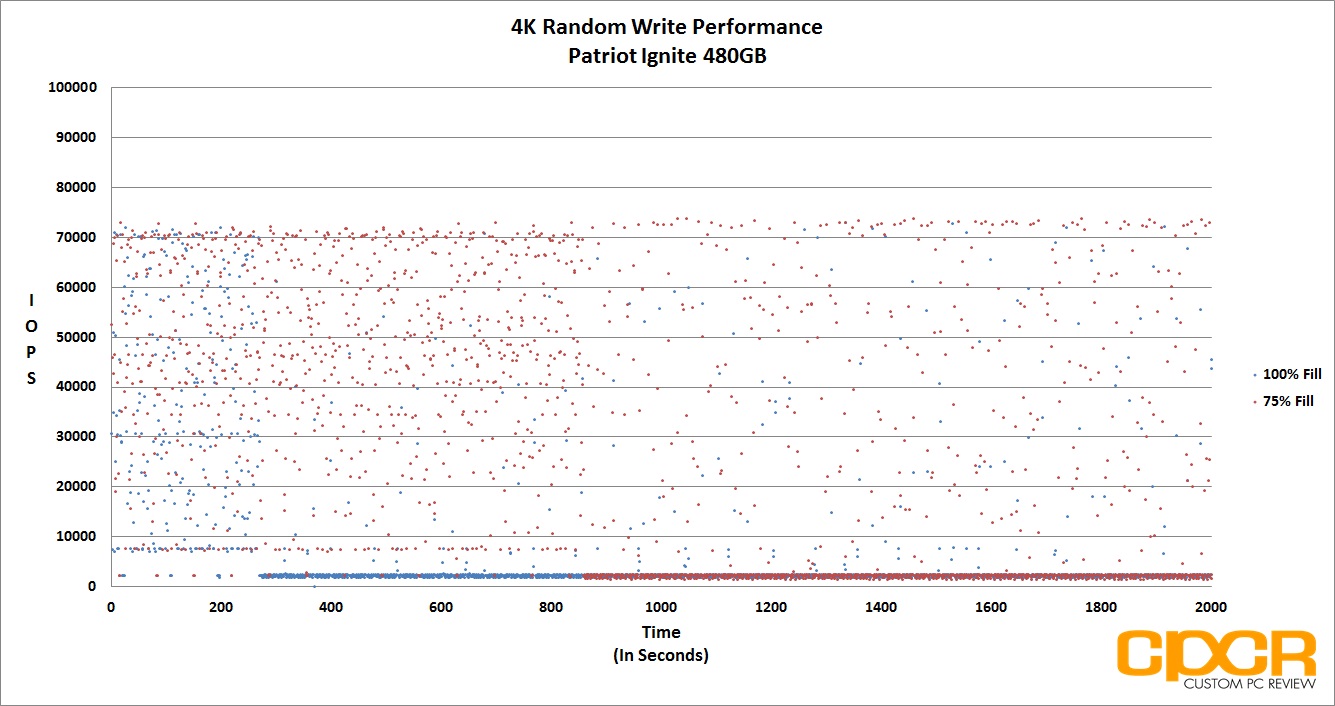
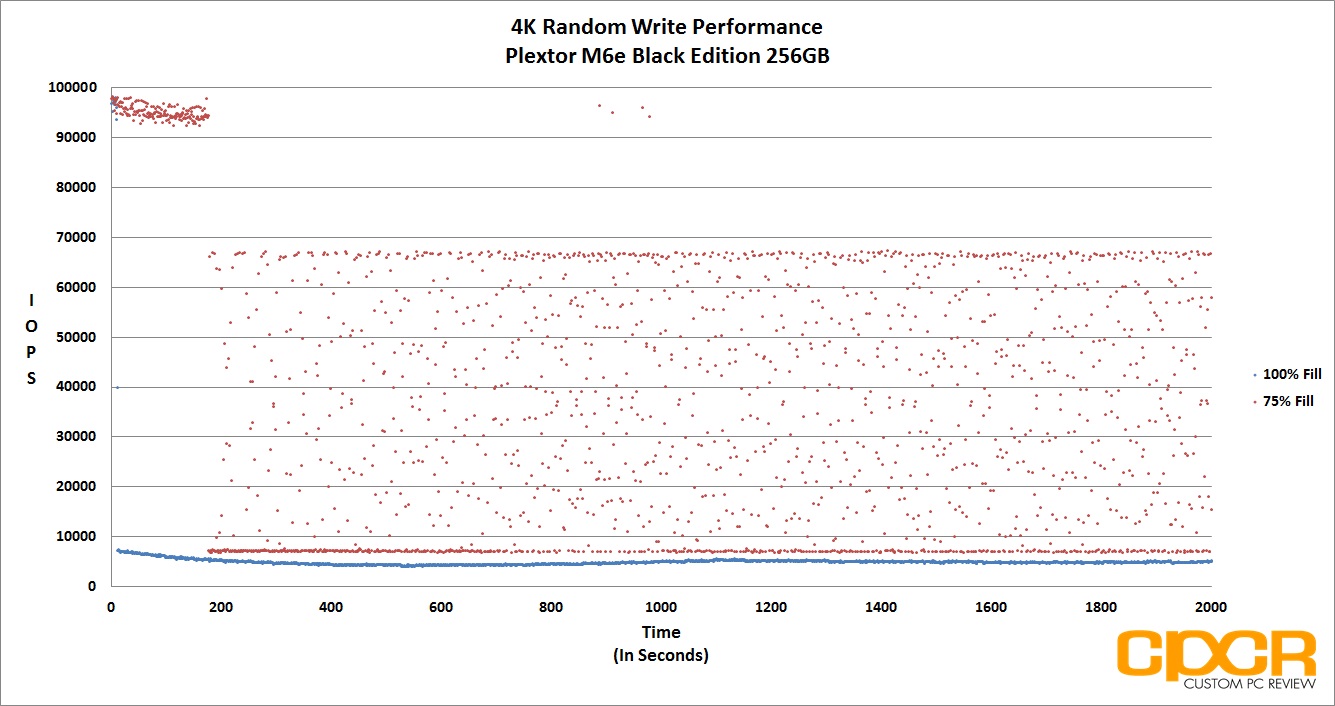
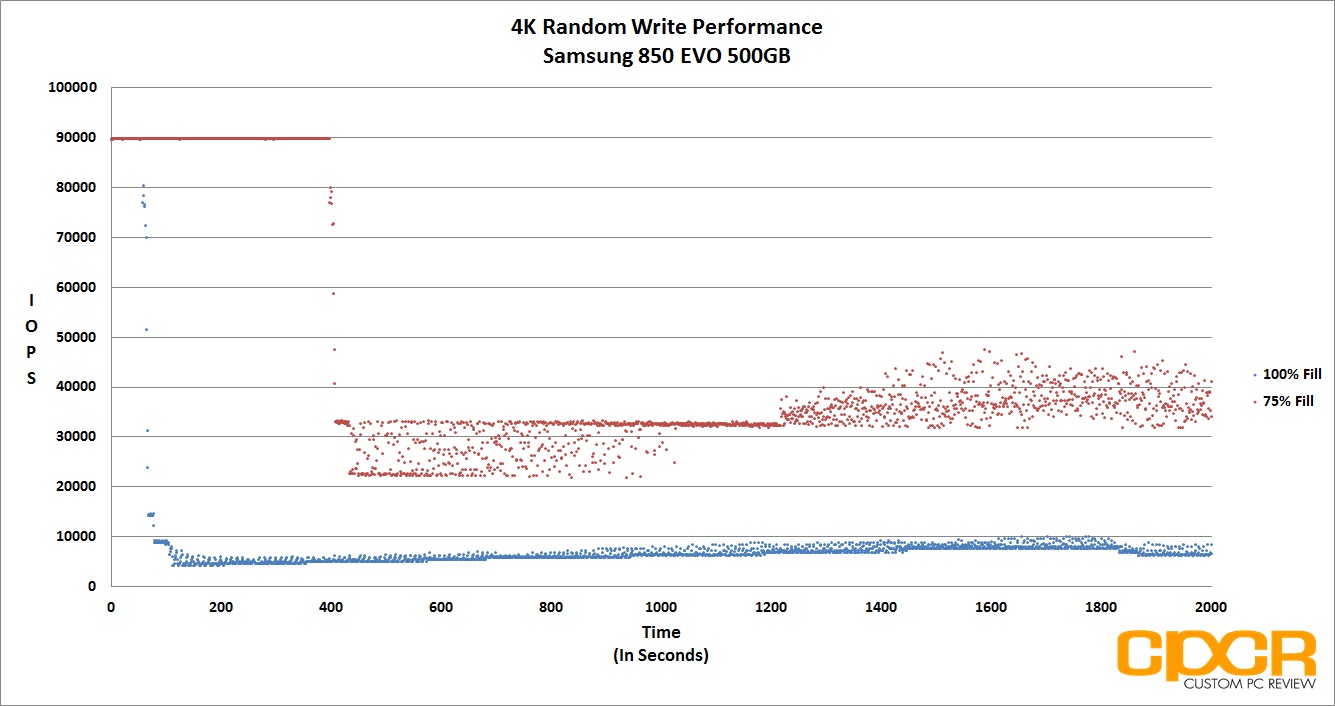
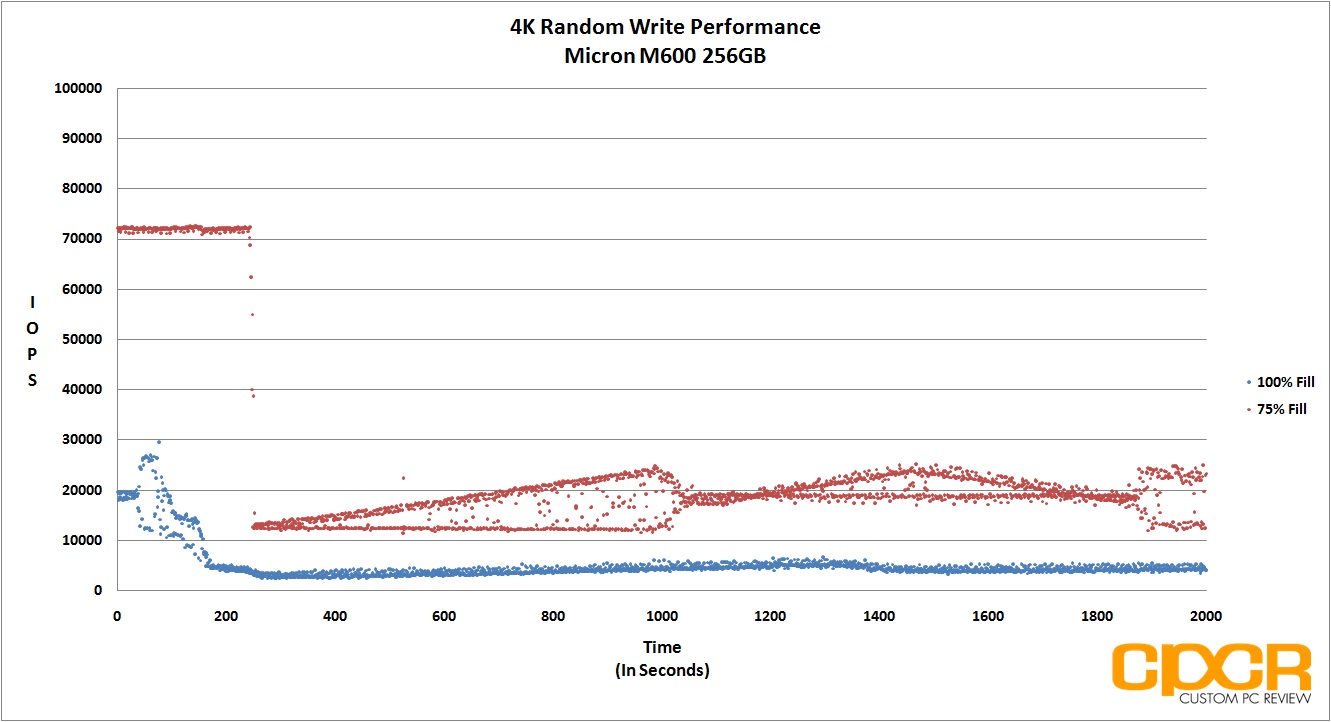
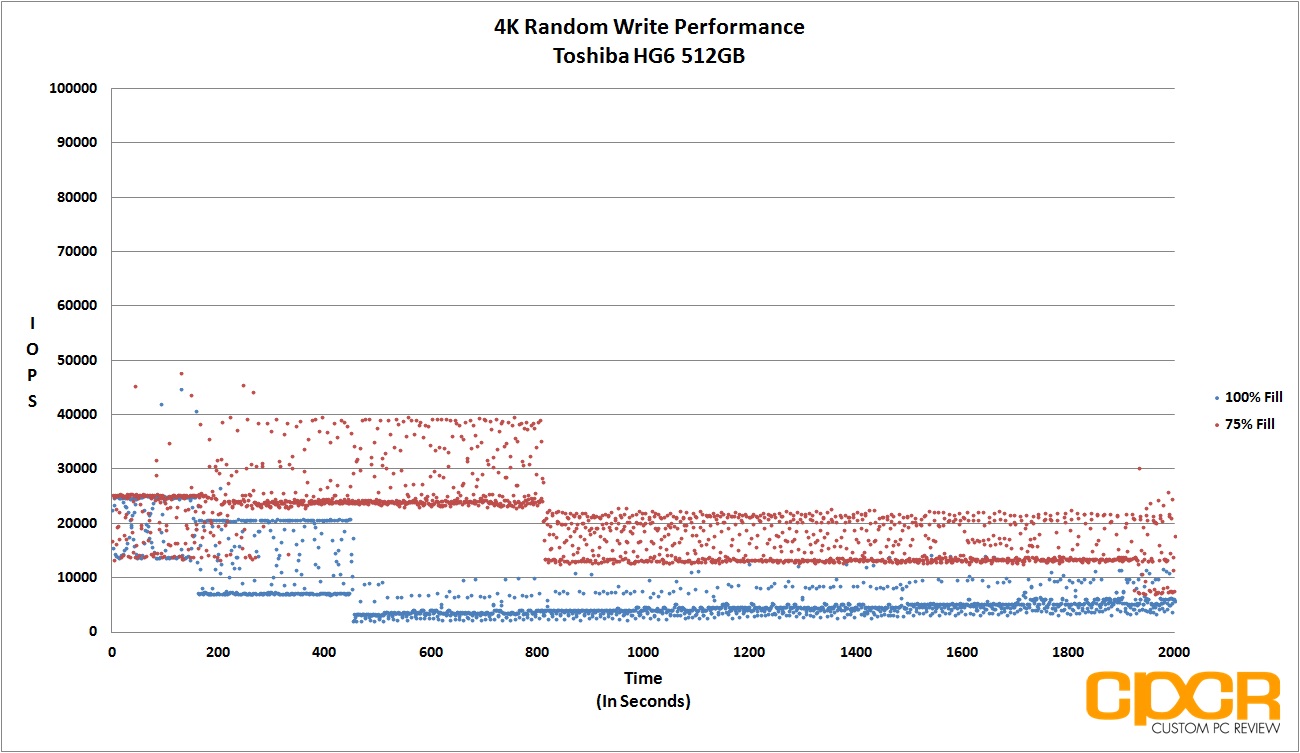
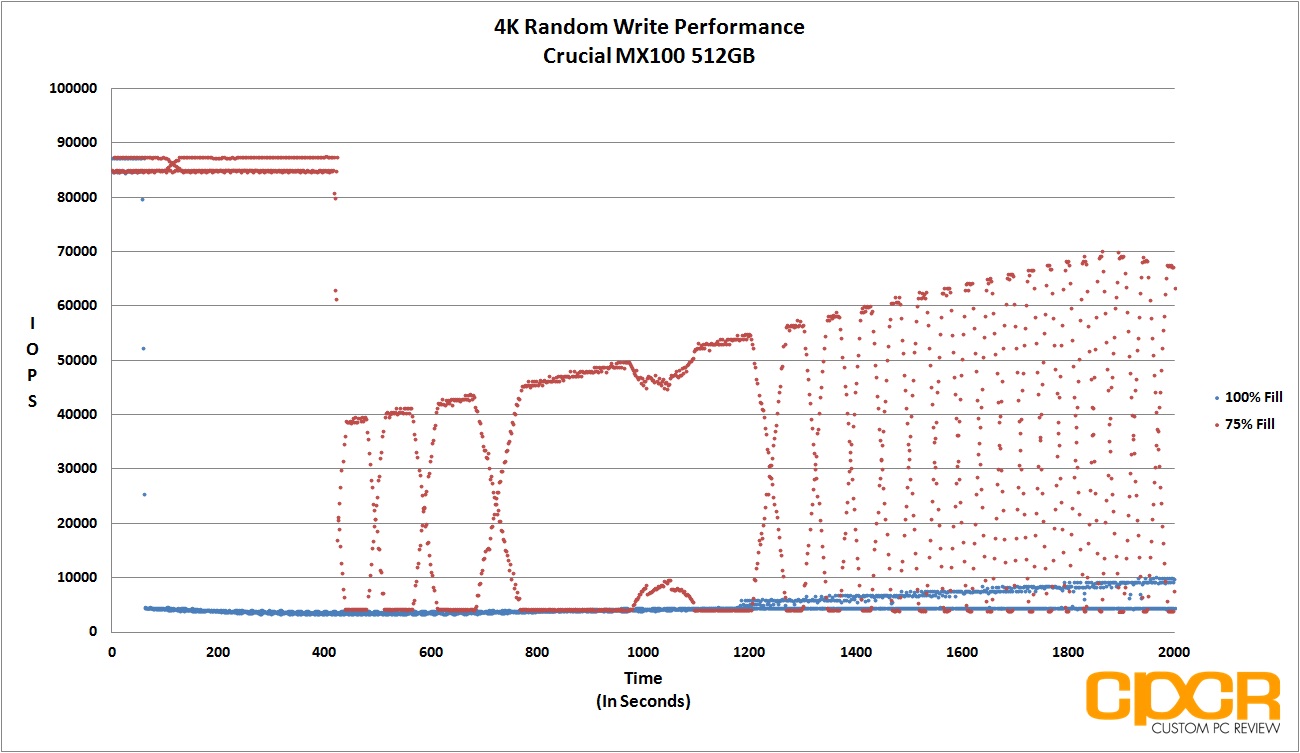
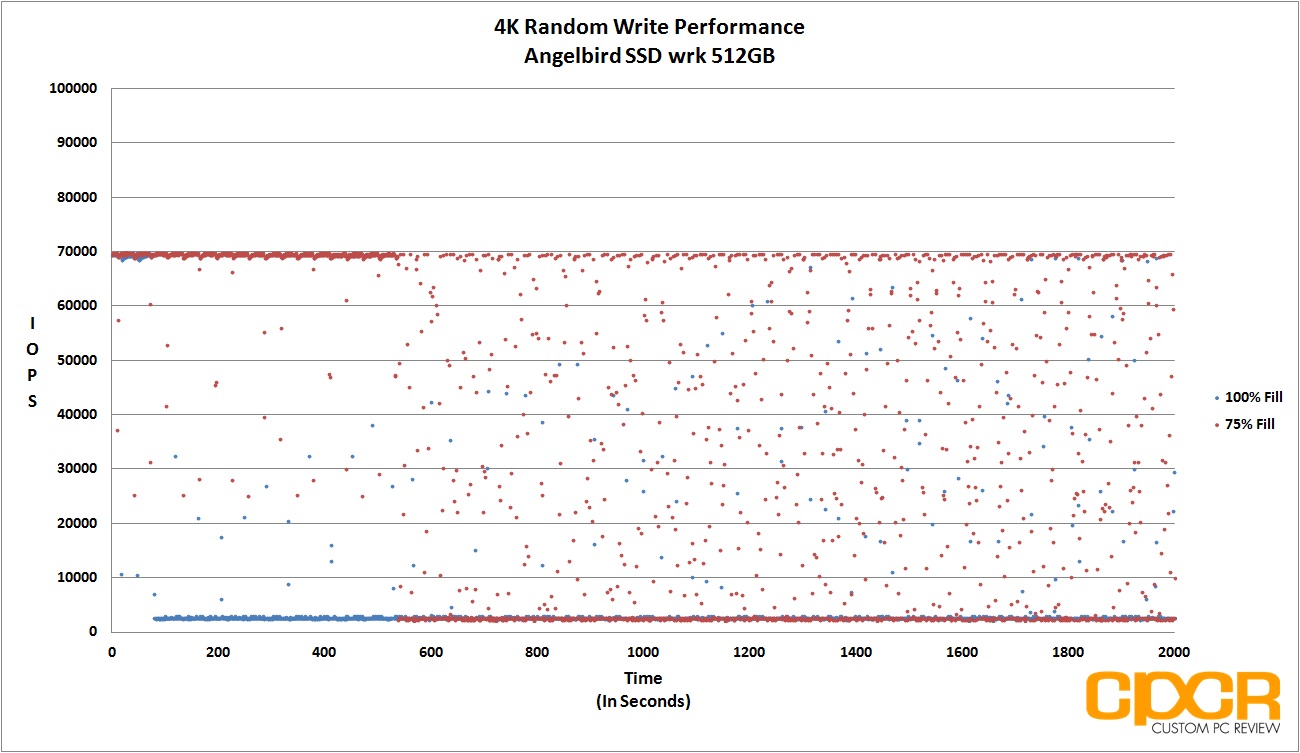
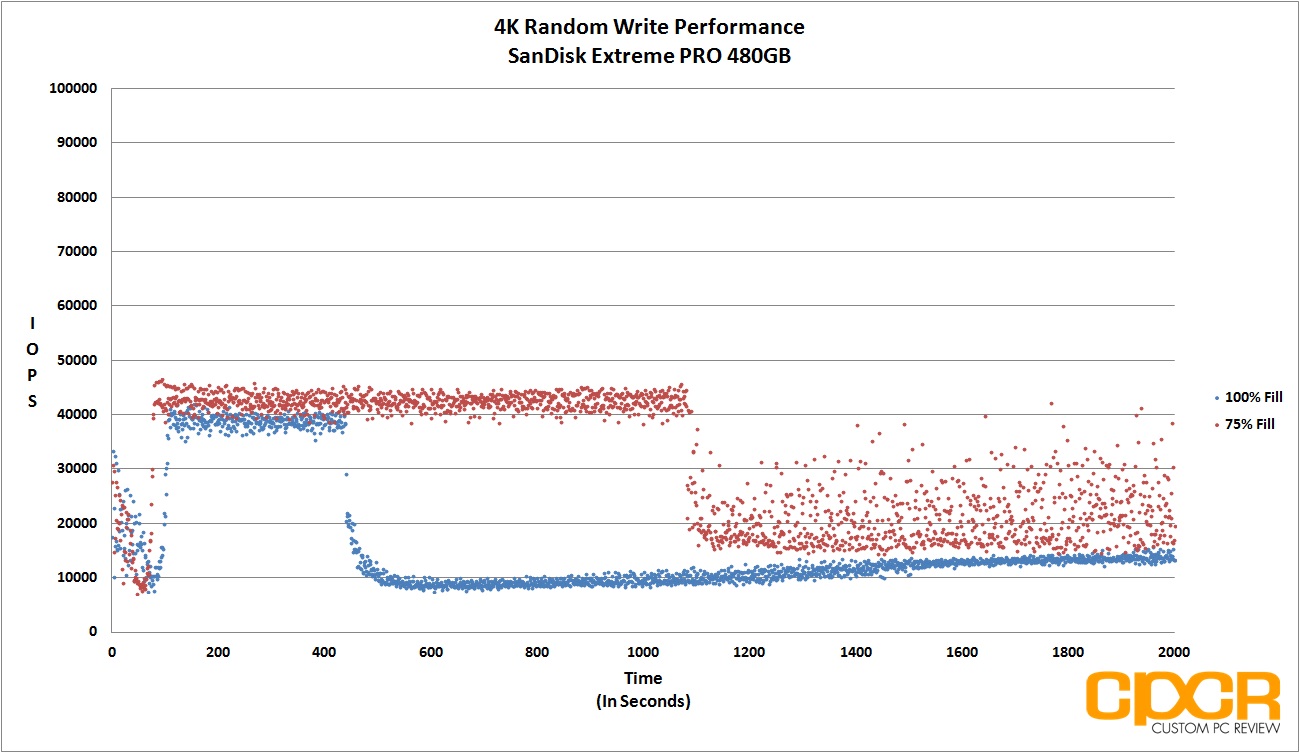
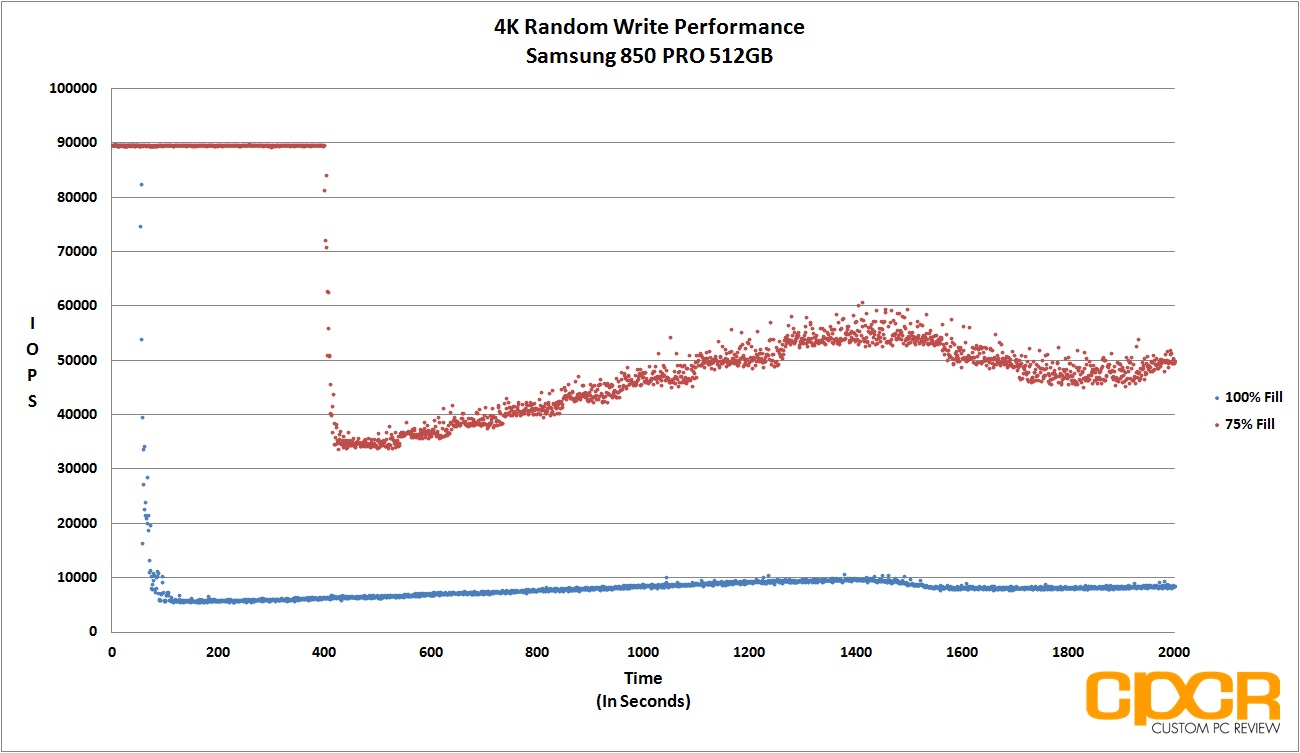
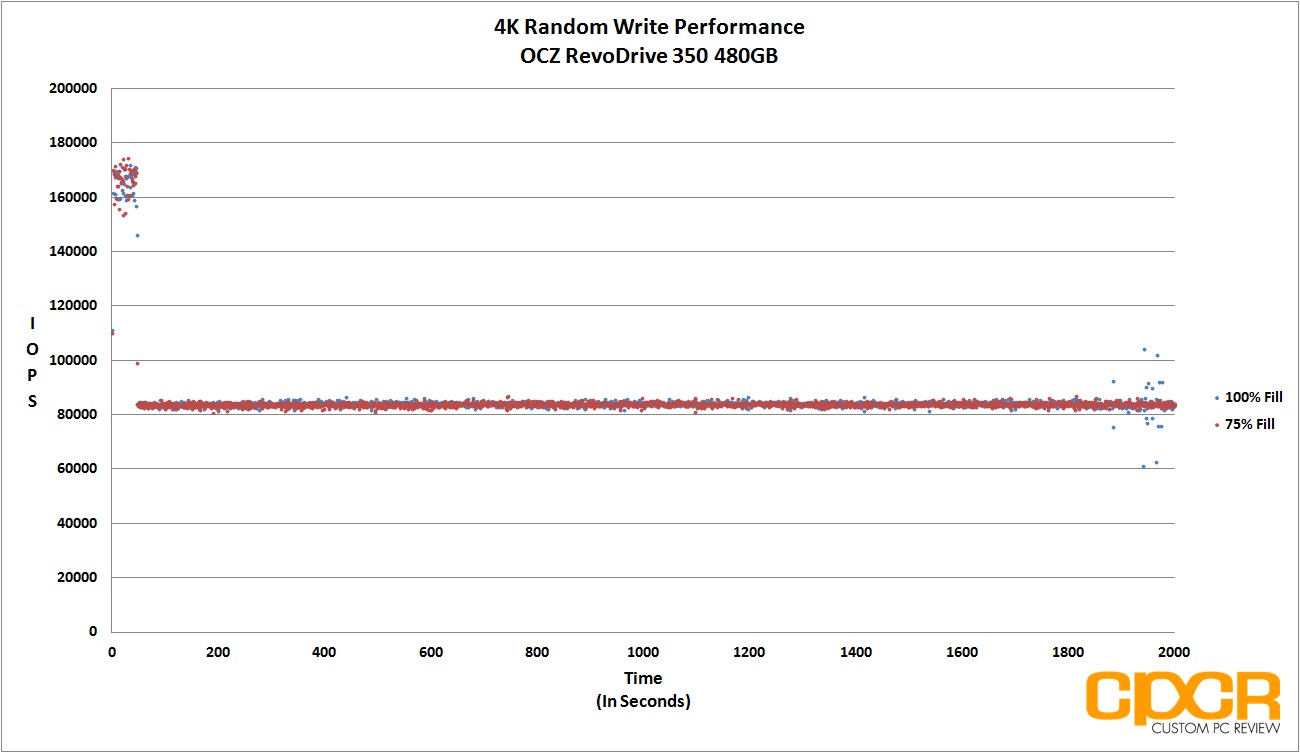
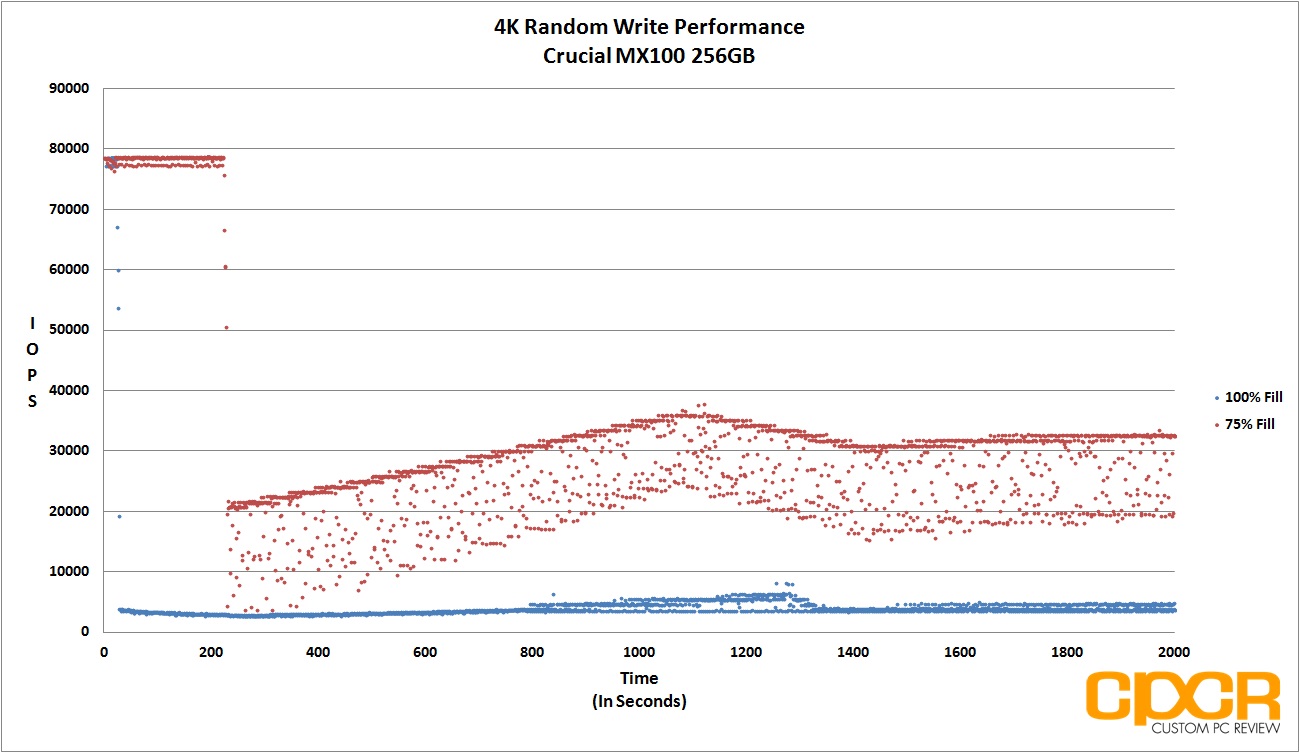
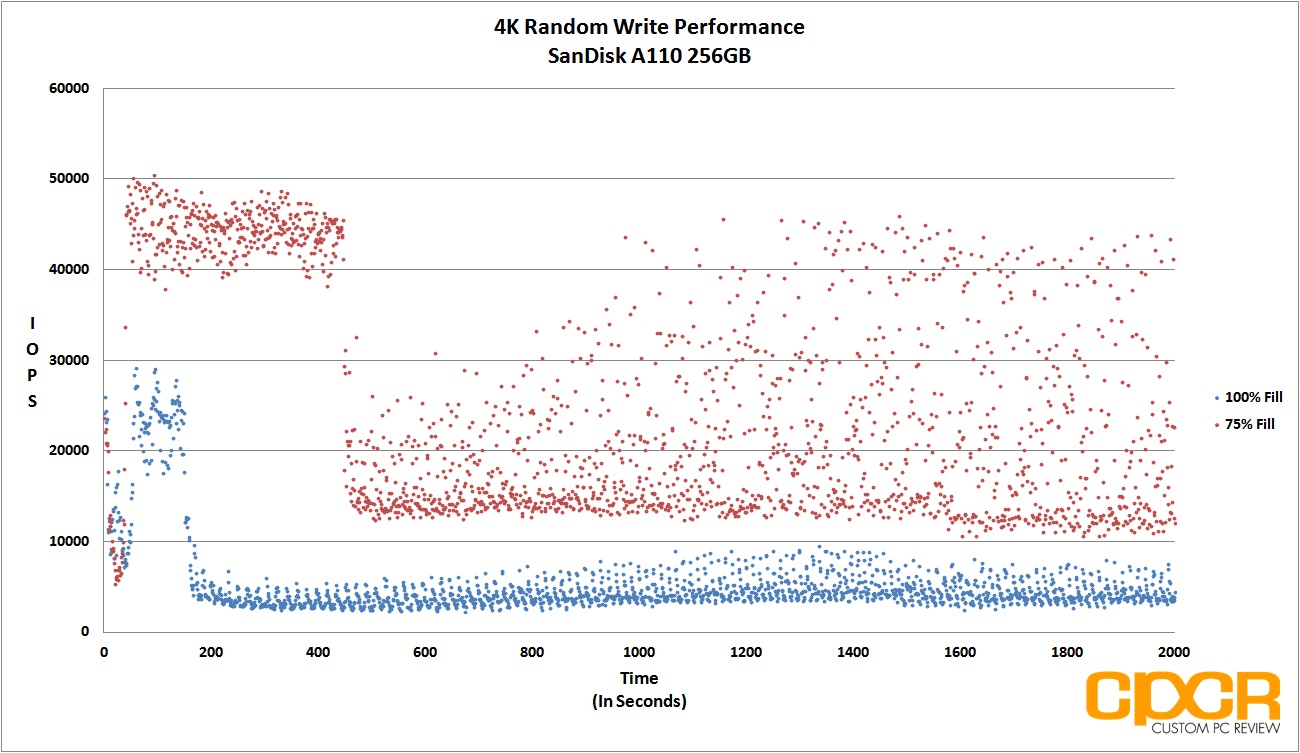
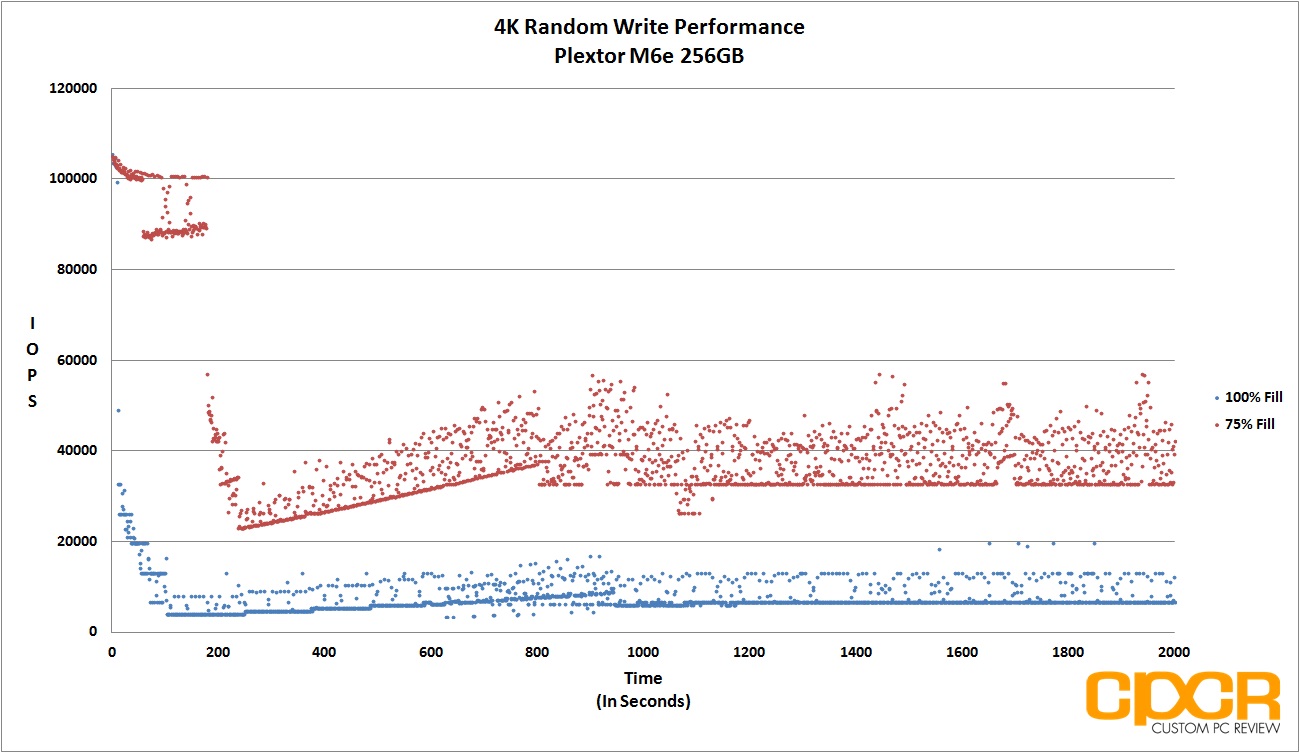
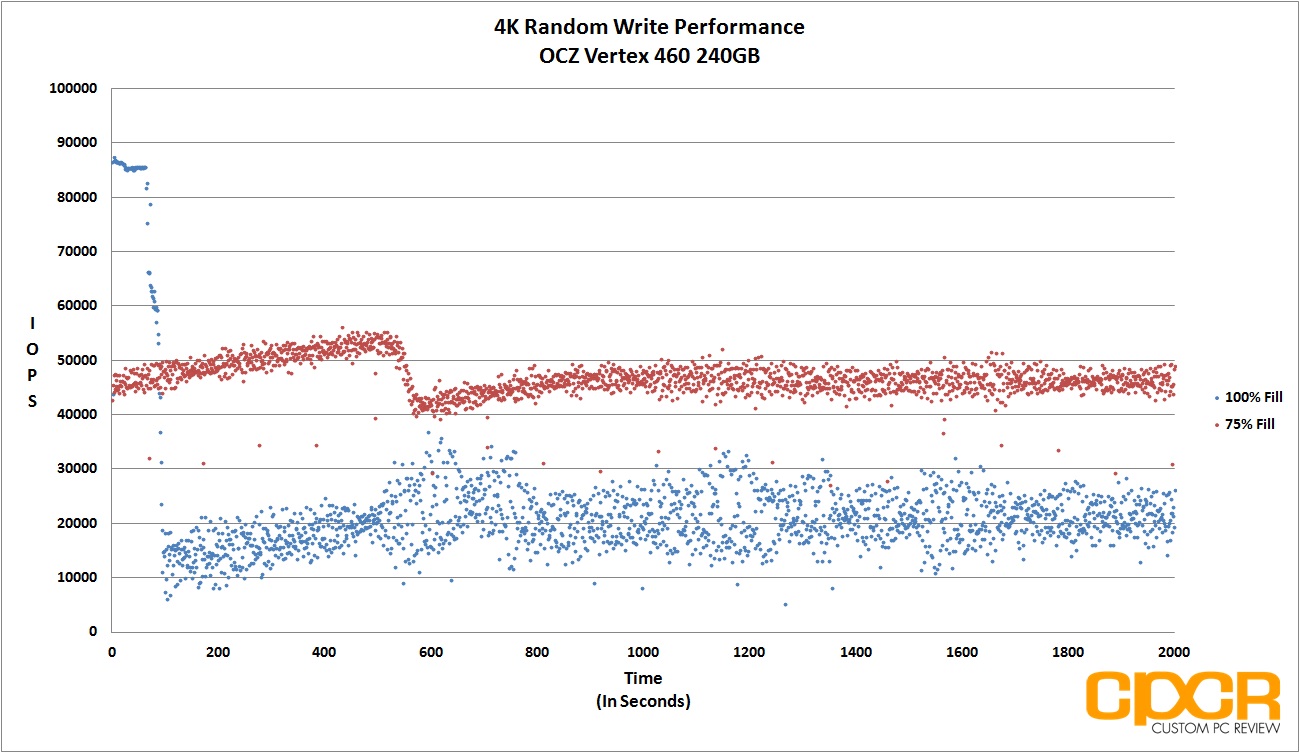
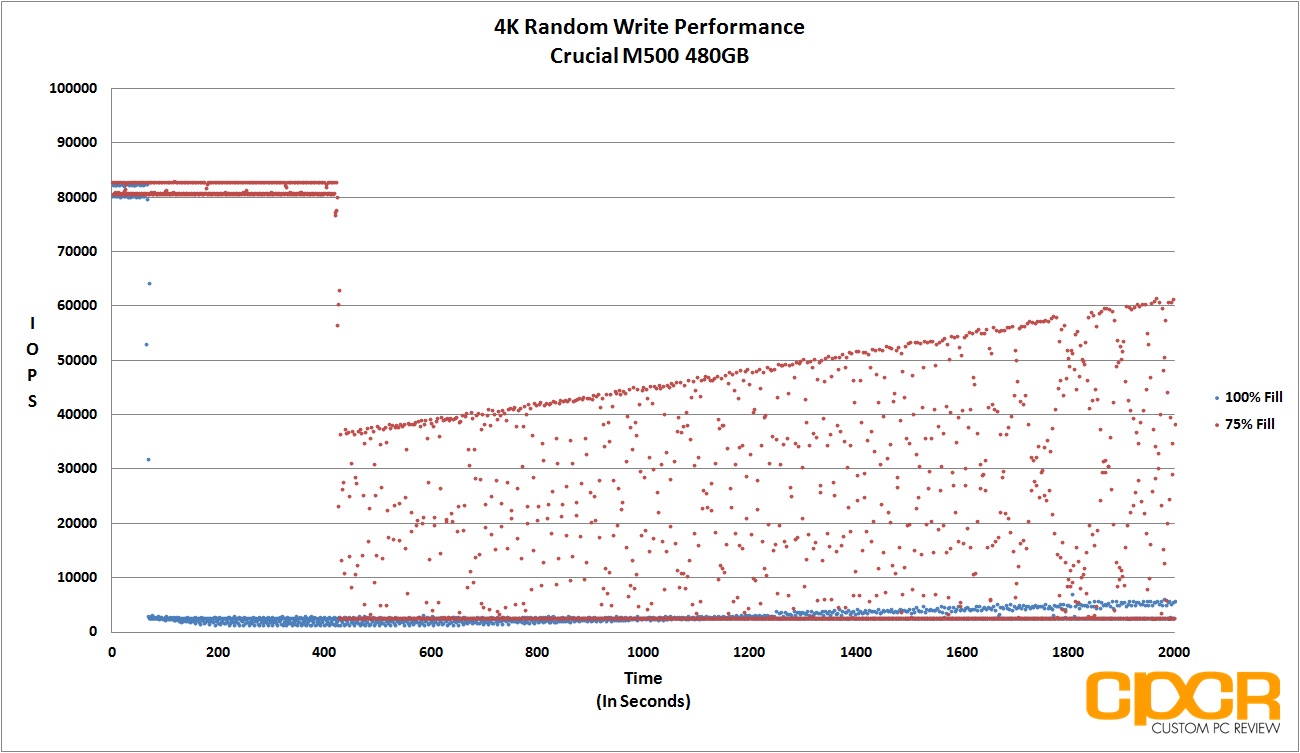
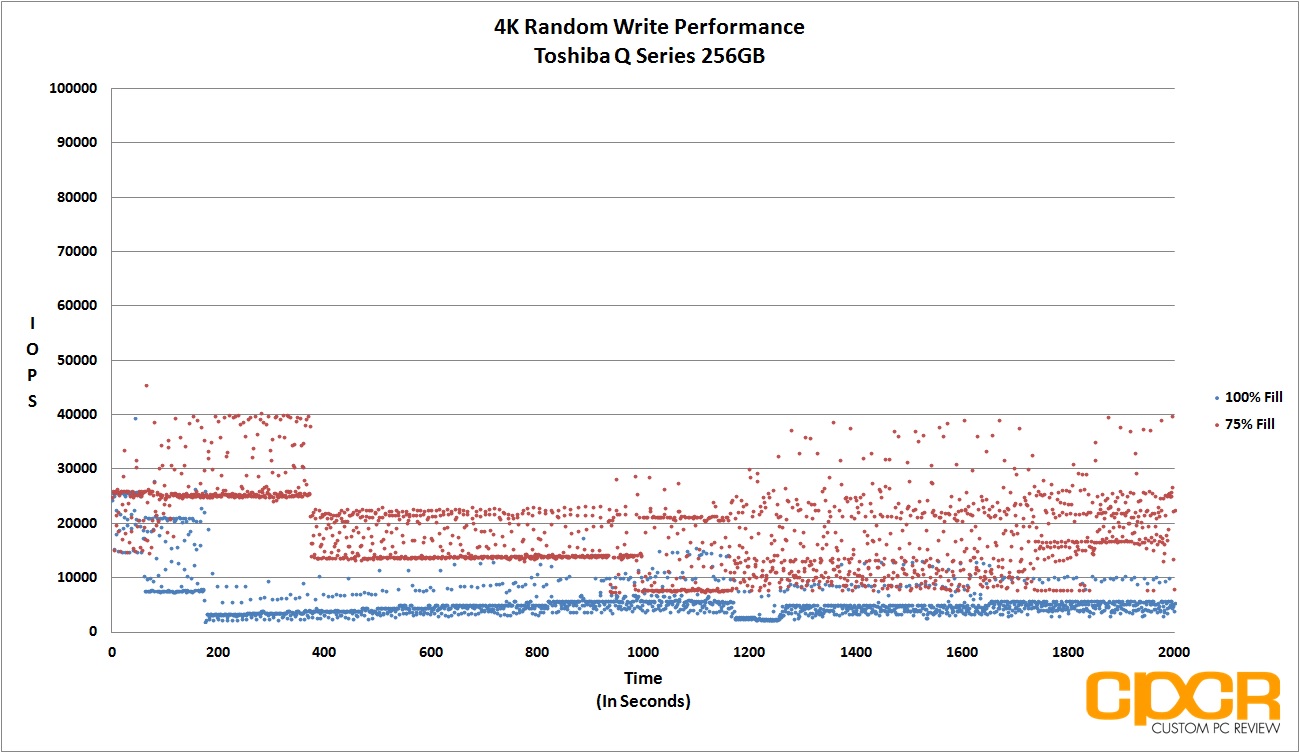
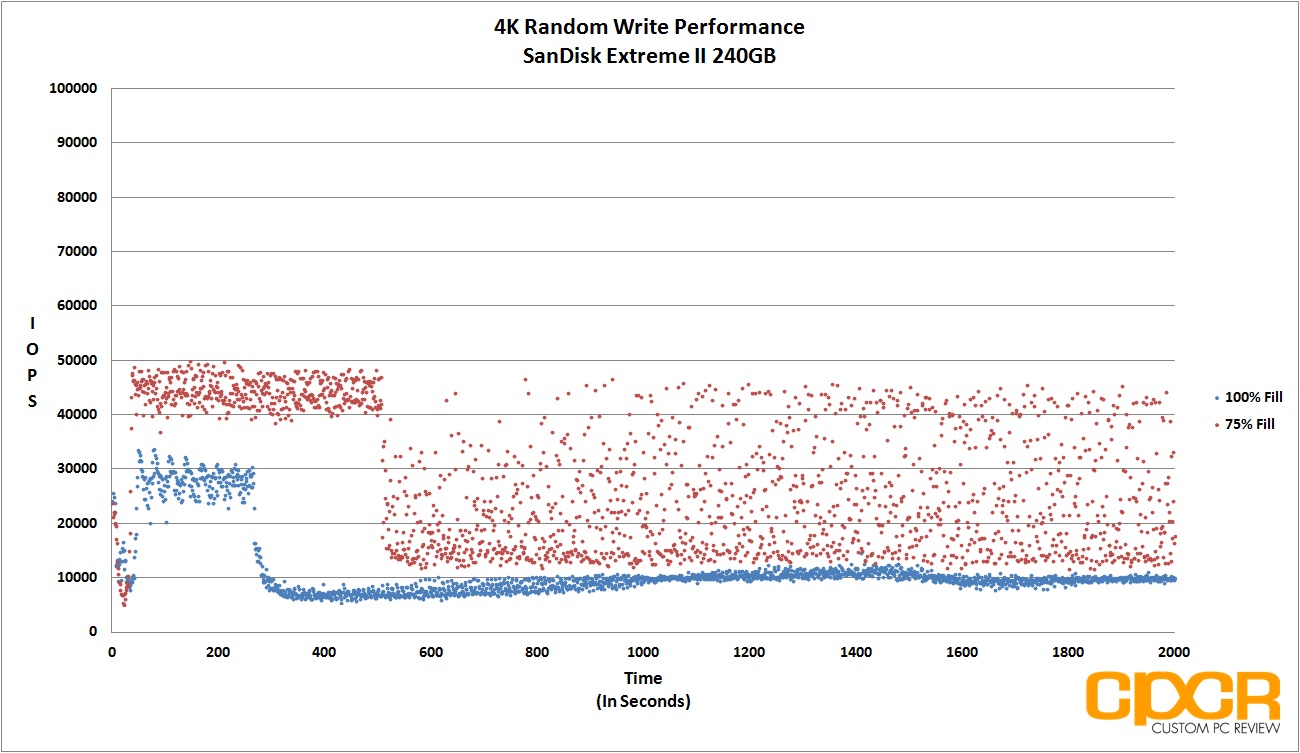
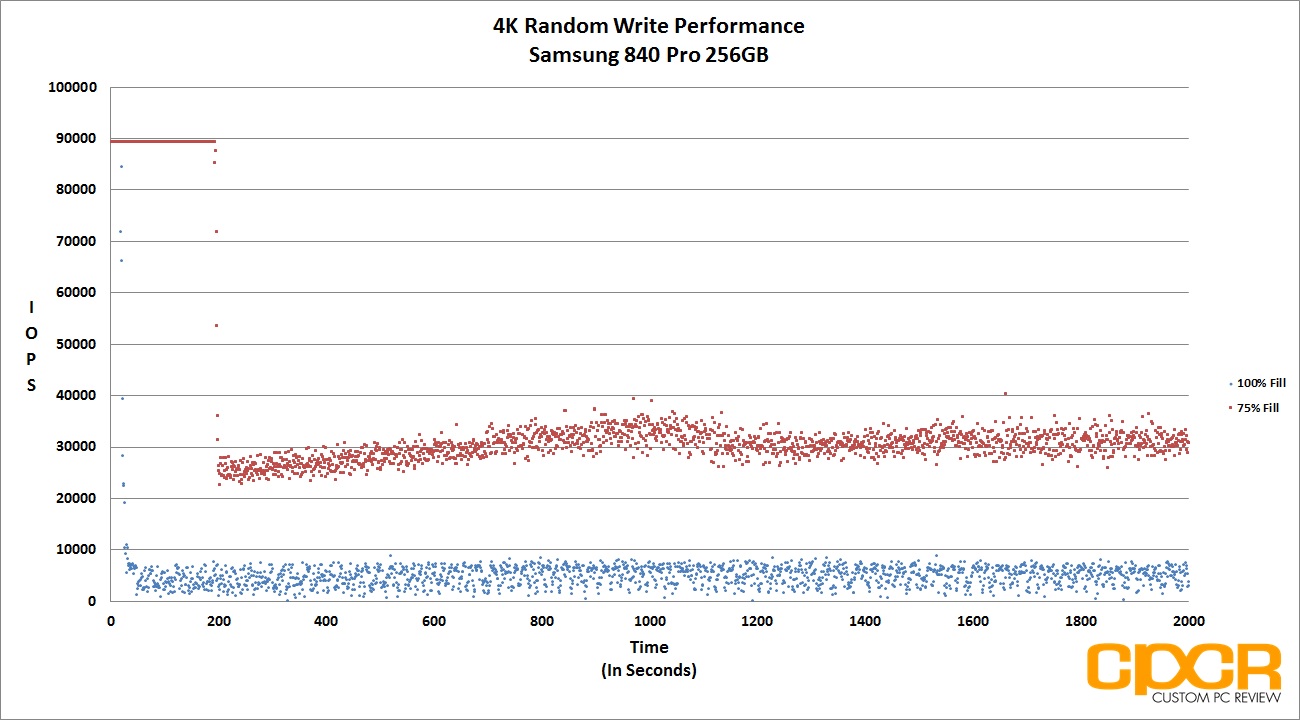
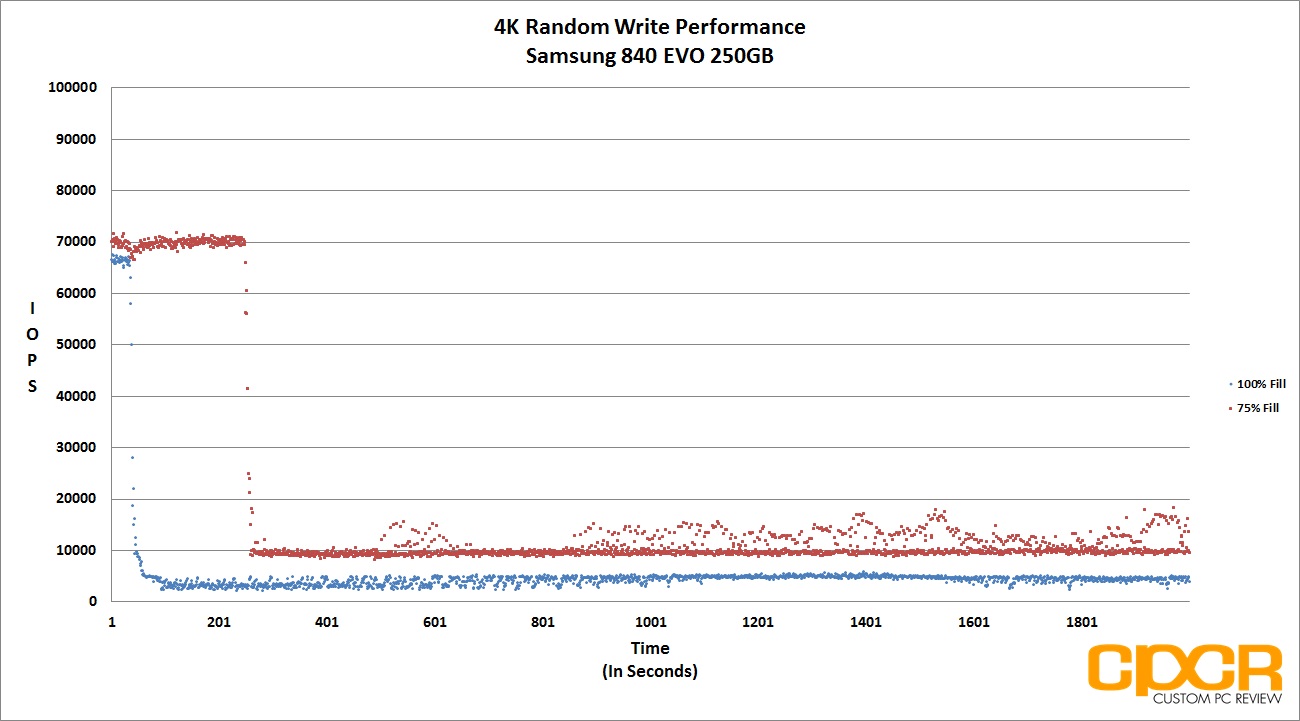
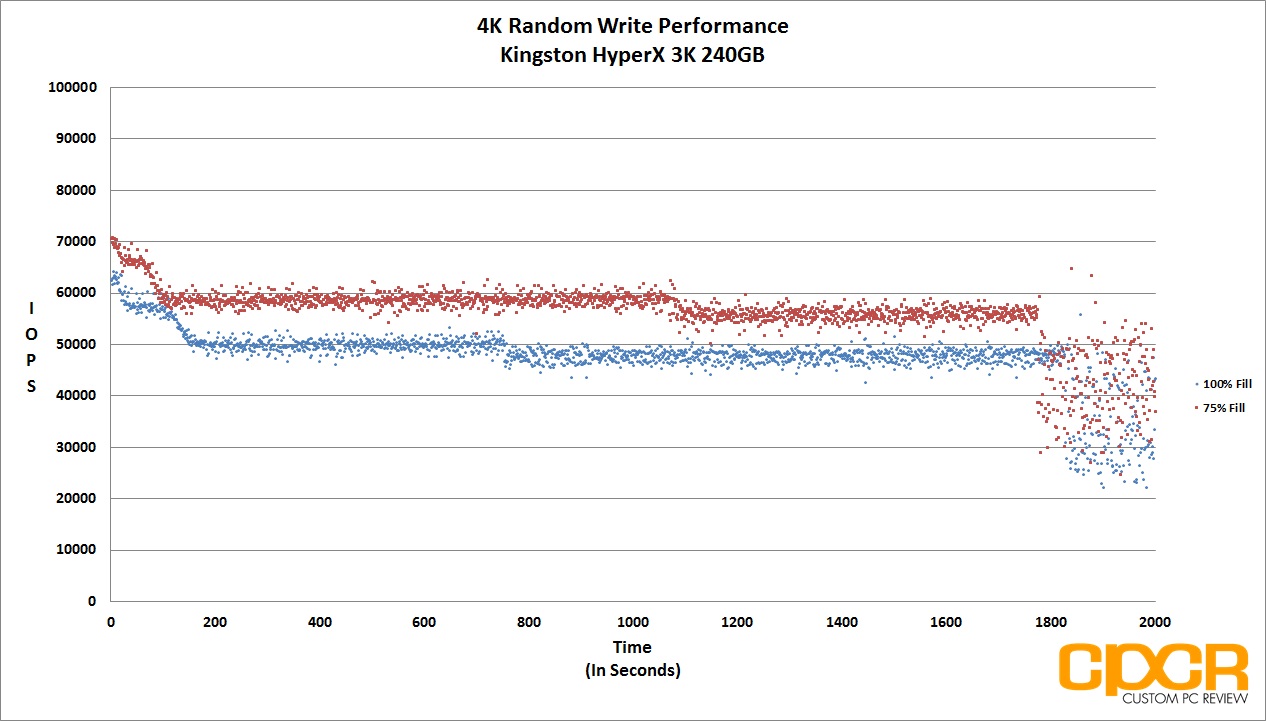
Performance Analysis
While steady state performance is good, consistent performance is another story altogether. As a consumer drive designed for consumer workloads, I didn’t expect too much performance consistency out of the HyperX Predator and I wasn’t surprised with the results. Performance variances are huge in both 75% and 100% fill as performance constantly ranges from ~100,000+ IOPS down to ~15,000 IOPS.
[section label=”10. FIO – 4K Random Write Latency”]
Kingston HyperX Predator 480GB Performance
FIO 4K Random Write Latency Testing
Another metric that’s becoming increasingly important in SSDs is its ability to keep latency low despite being subjected to a heavy workload. Even if a SSD were capable of ultra high and ultra consistent IOPS performance, if latency were high, users would still feel that the drive is slow. Ideally, SATA SSDs should always be capable of latencies under 50ms, even during heavy workloads.
For latency testing, we’ll be using the exact same testing parameters as IOPS consistency testing, except instead of recording IOPS every second, we’ll be recording latency.
[tabgroup]
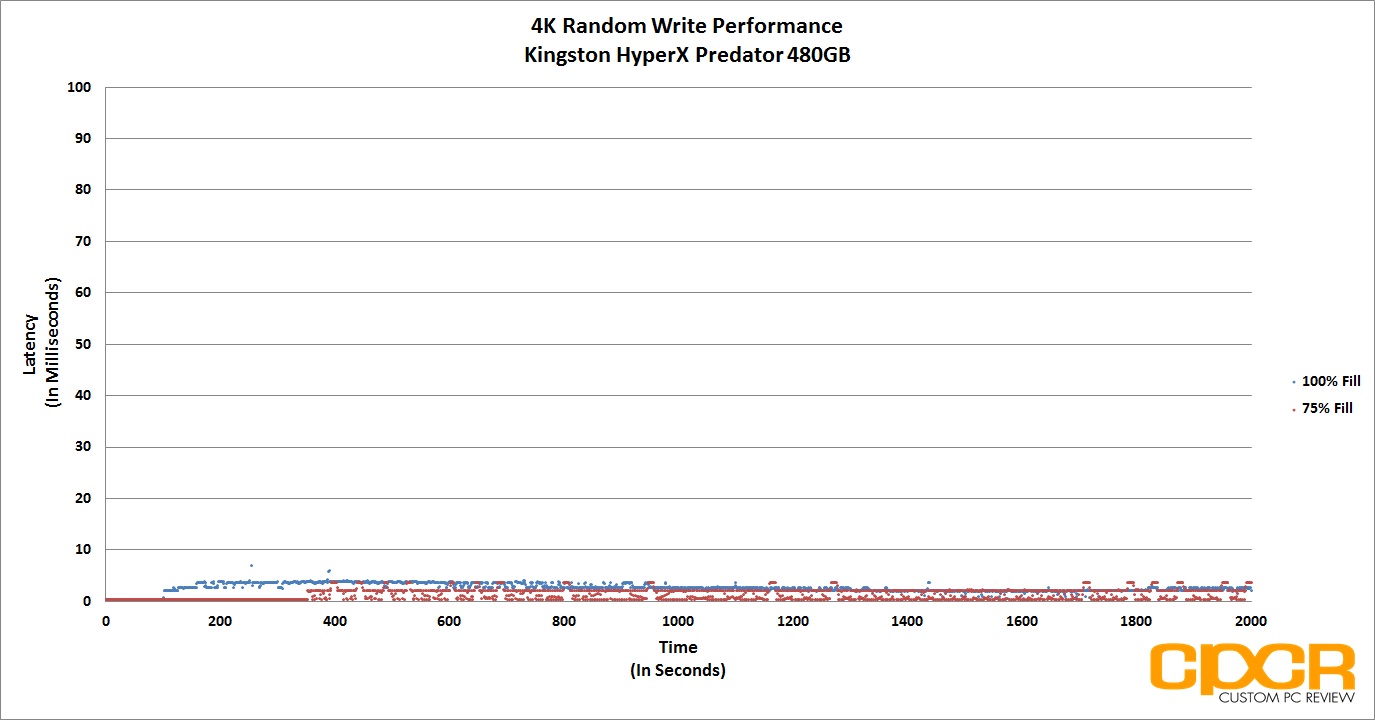
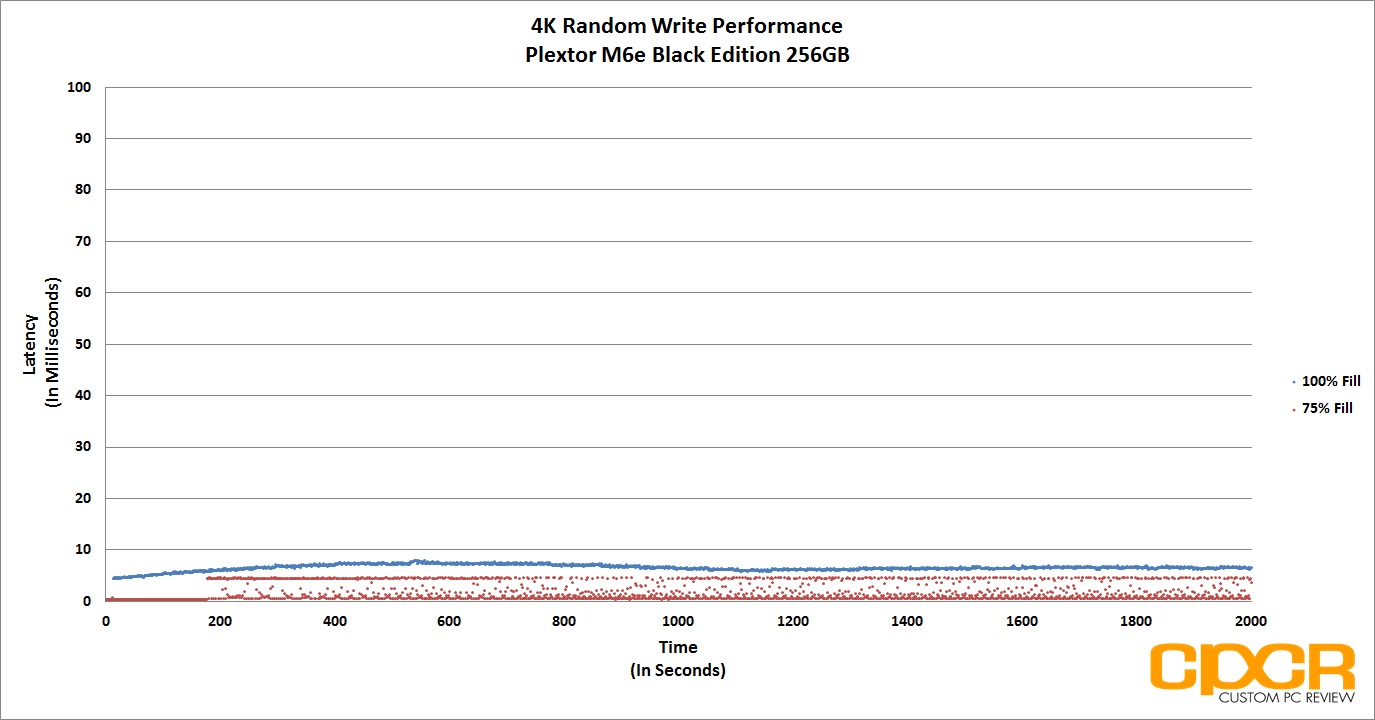
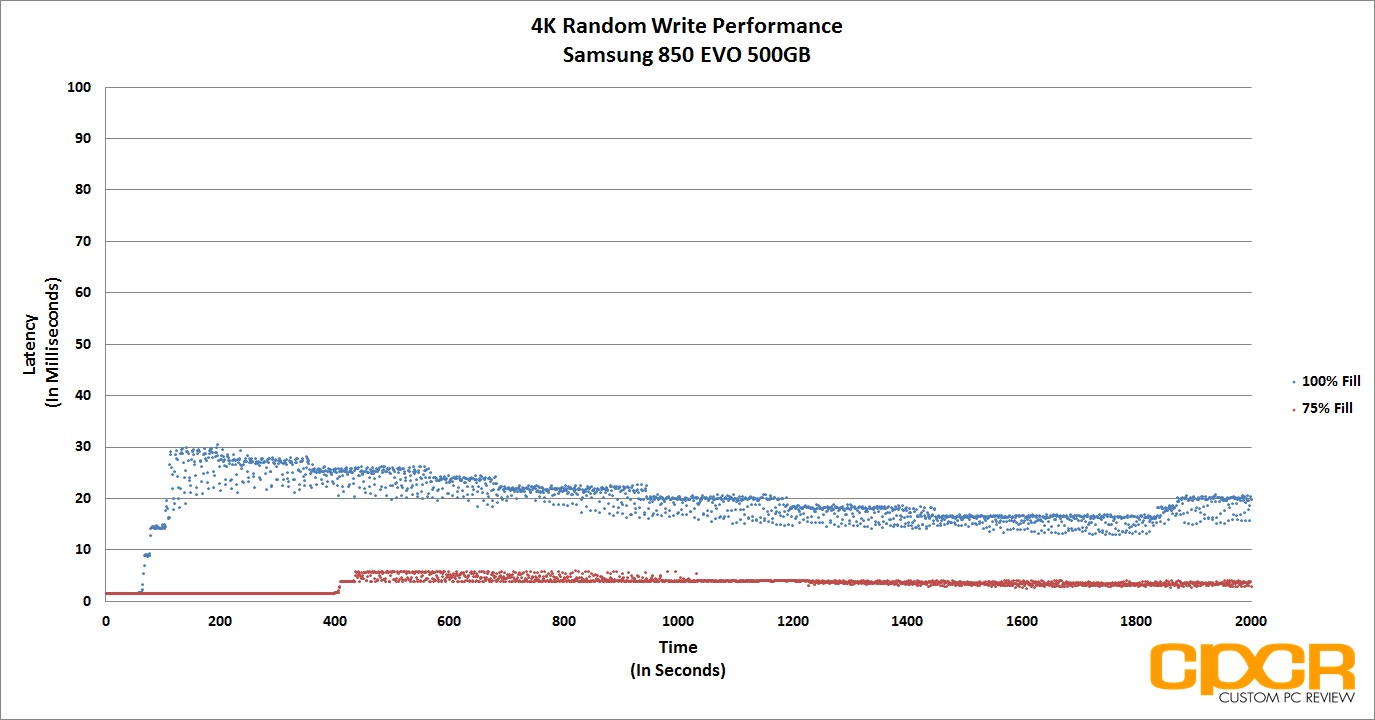
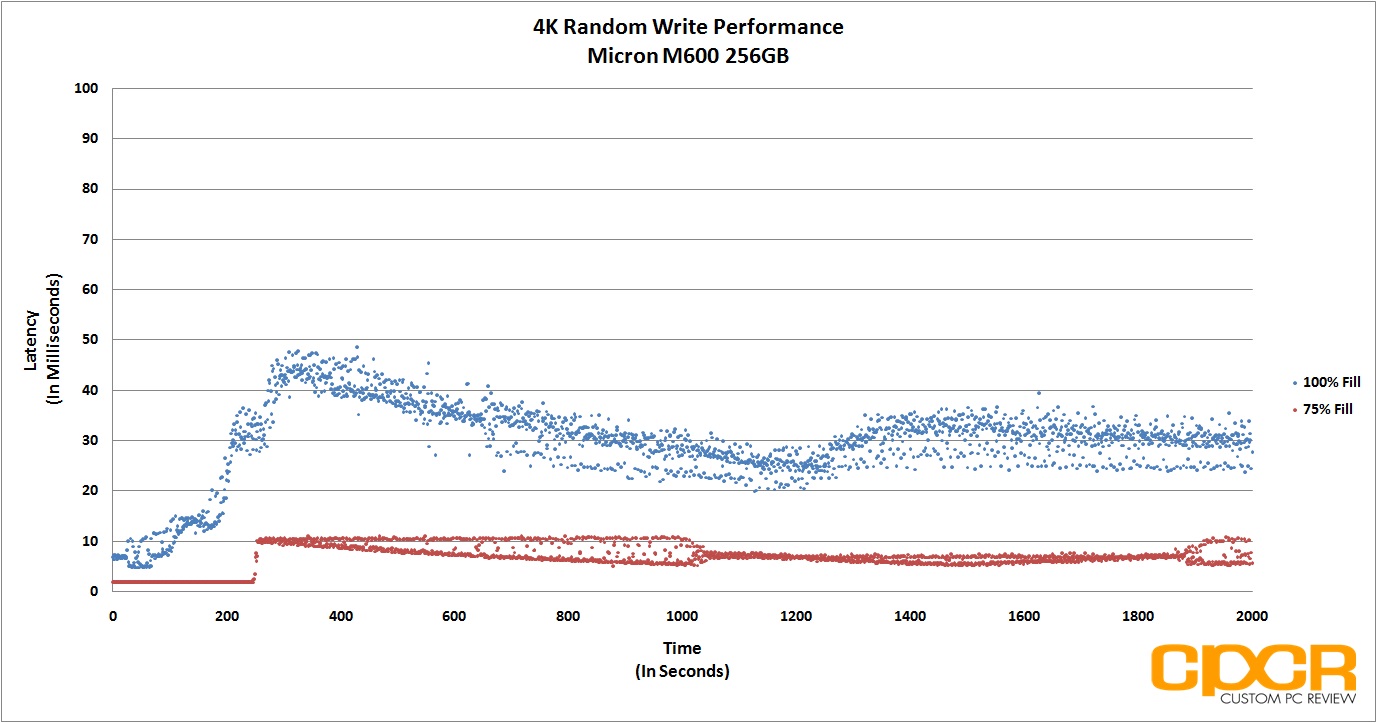
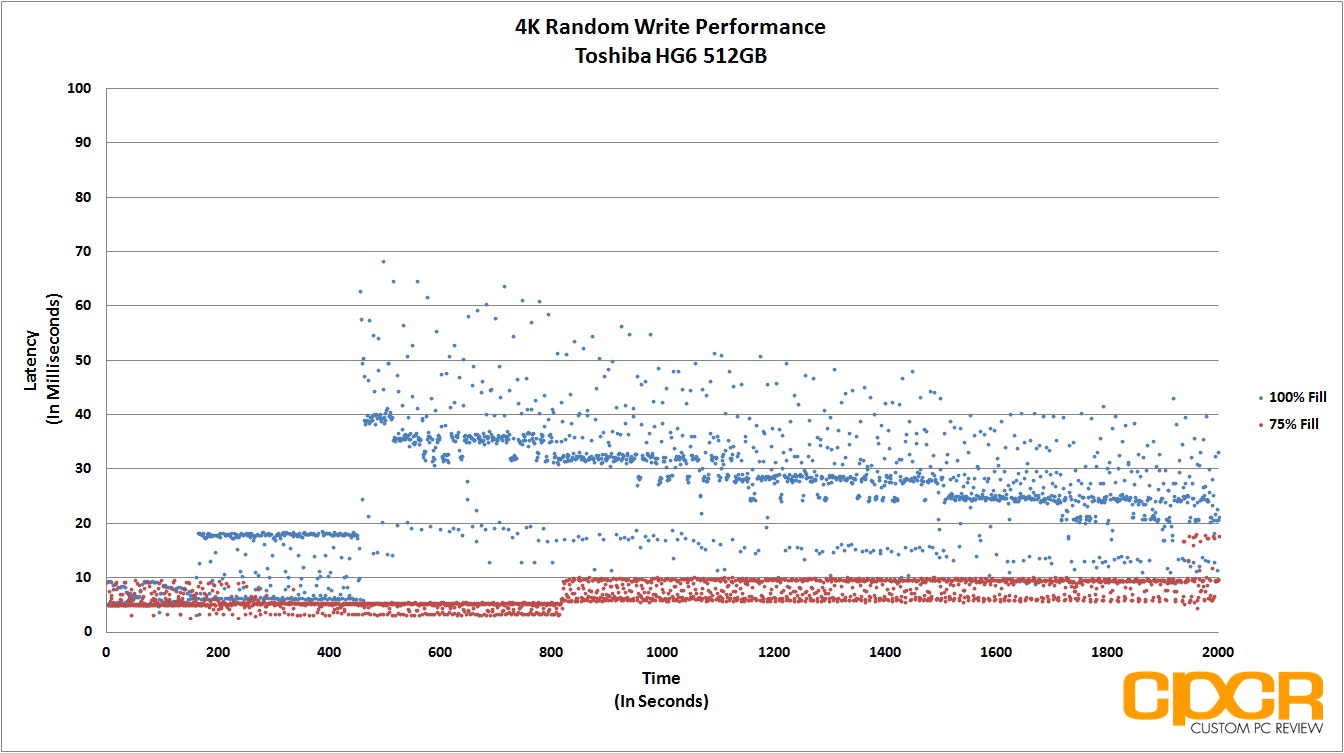
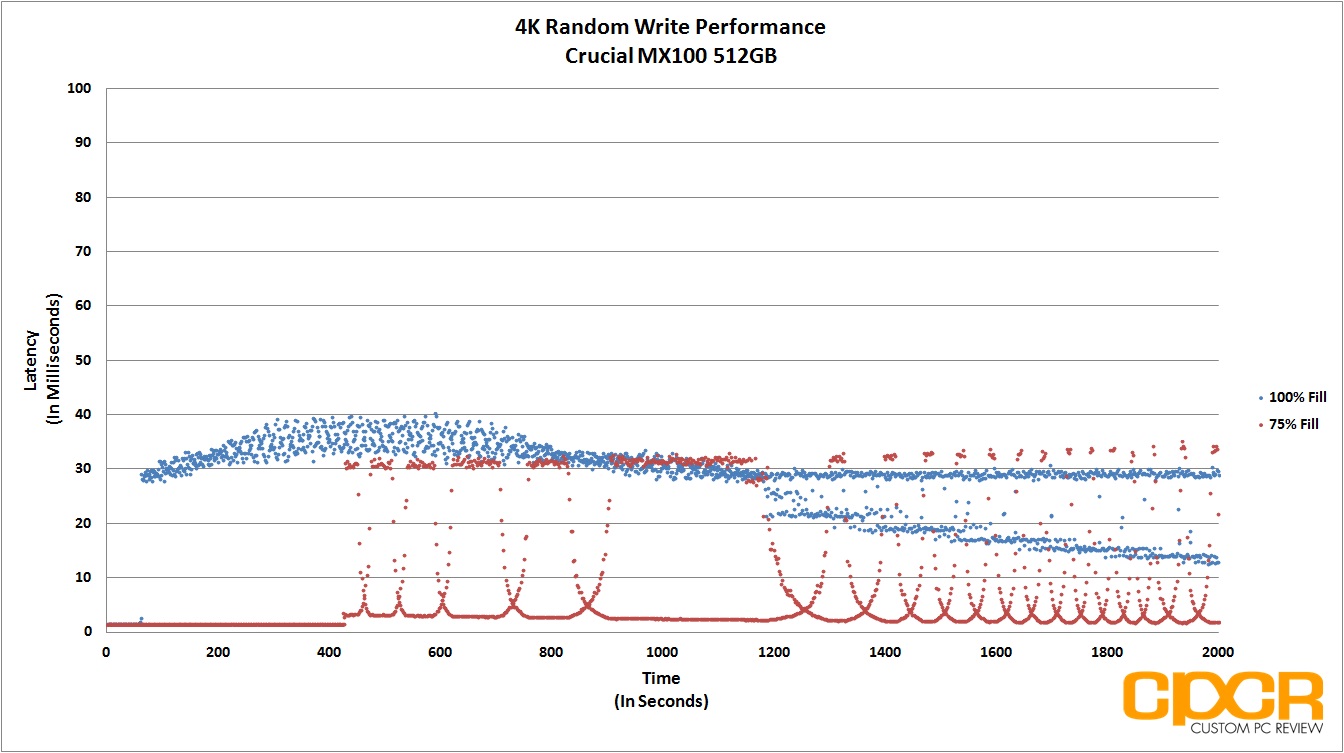
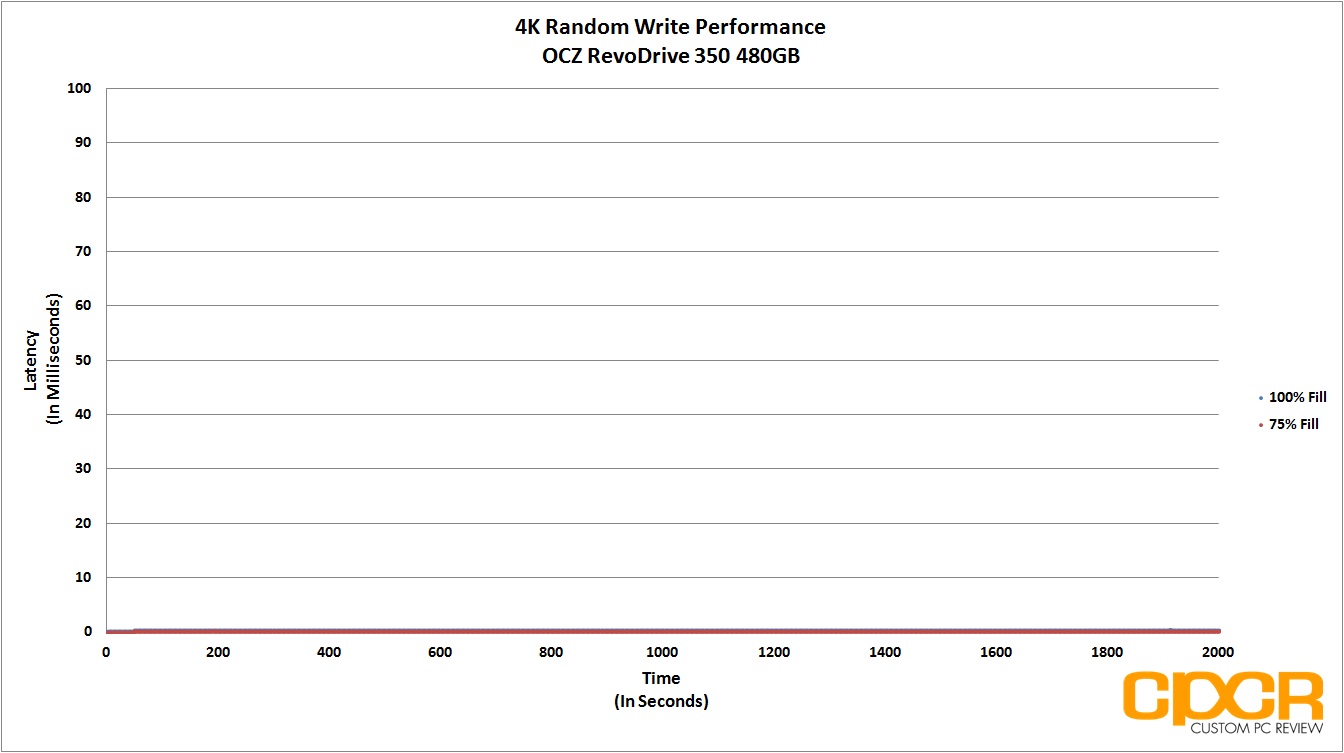
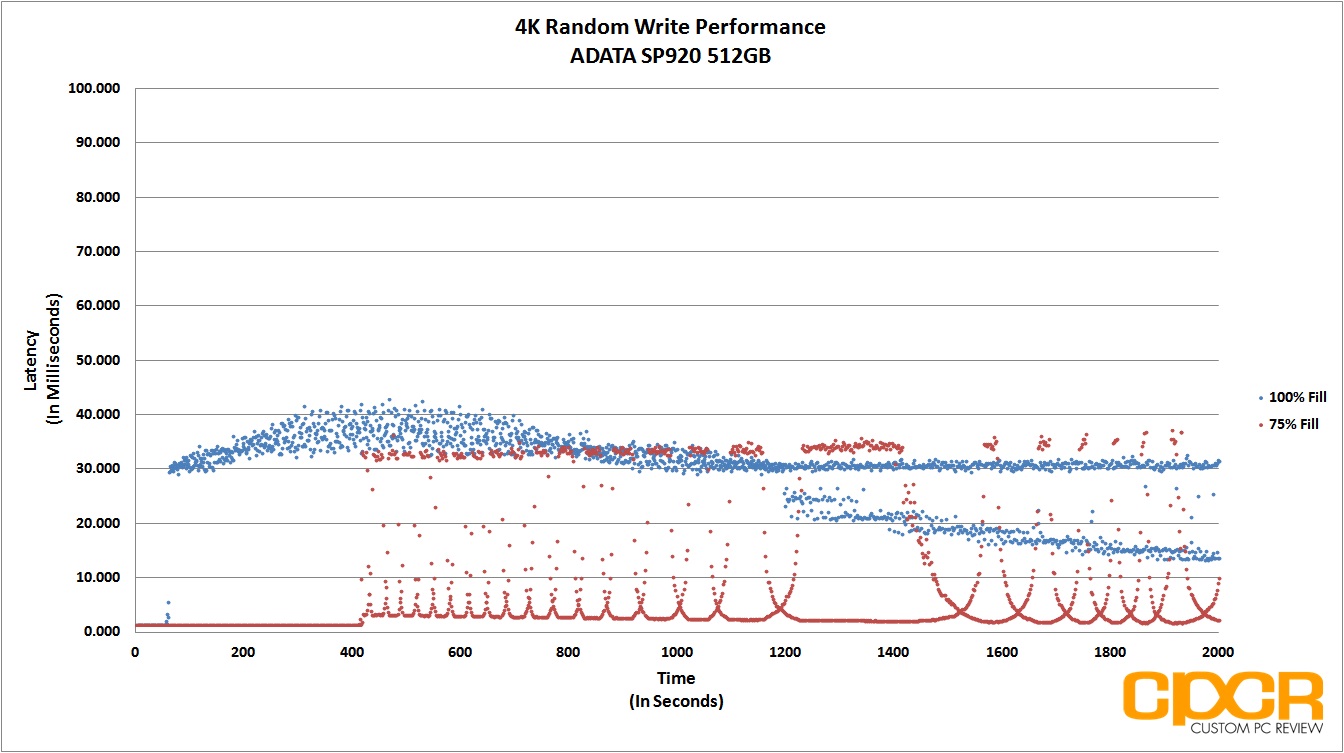
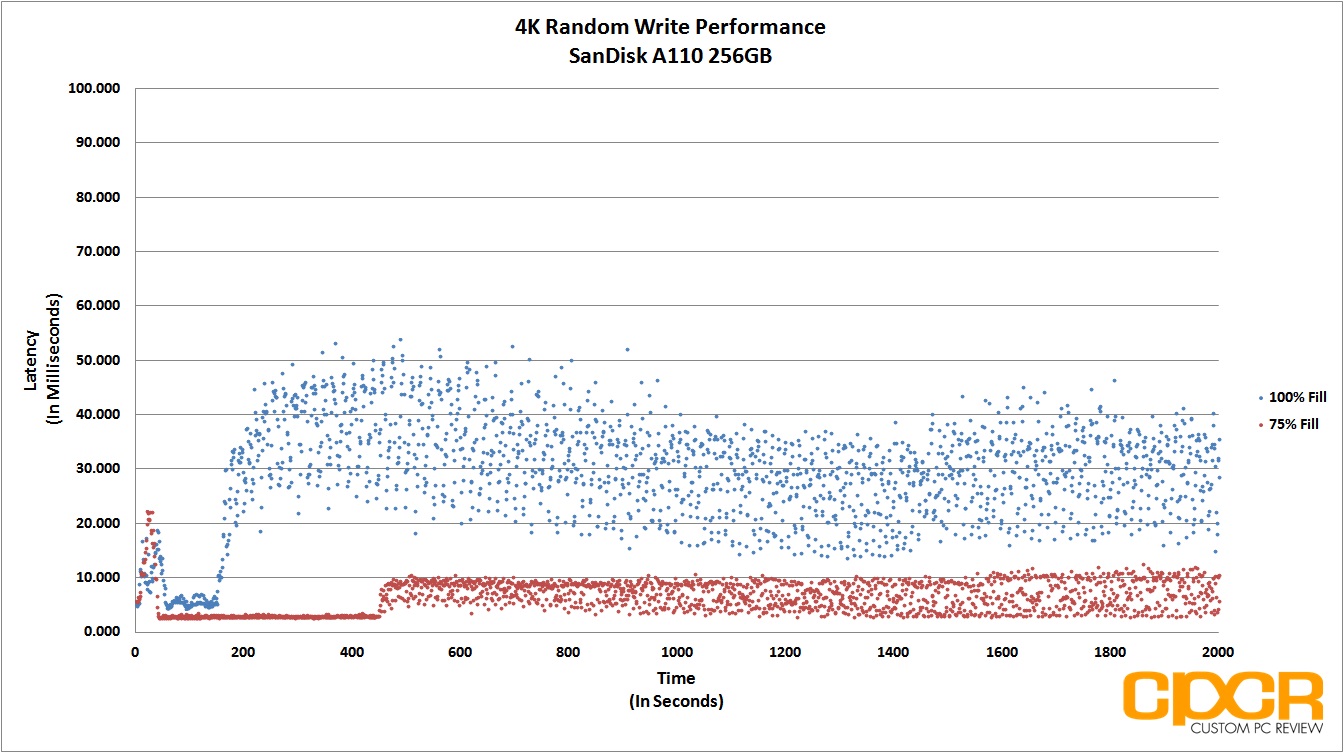
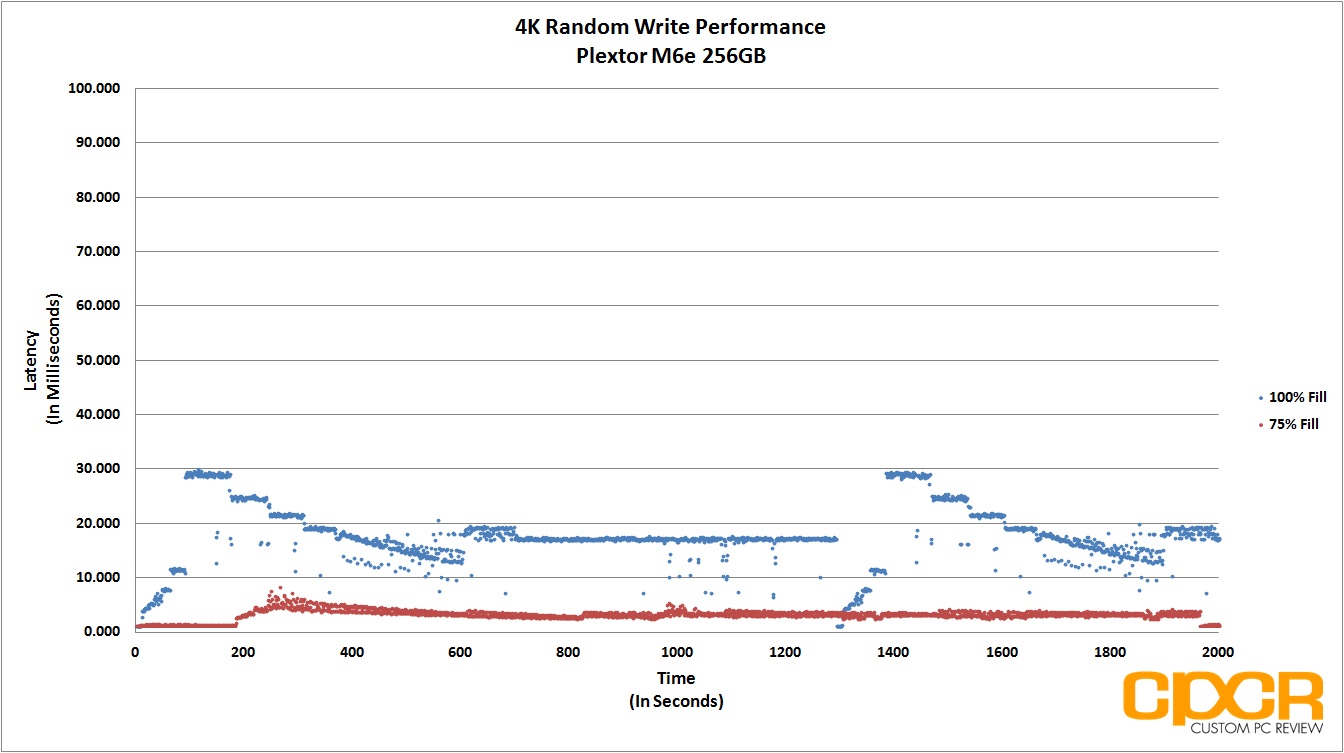
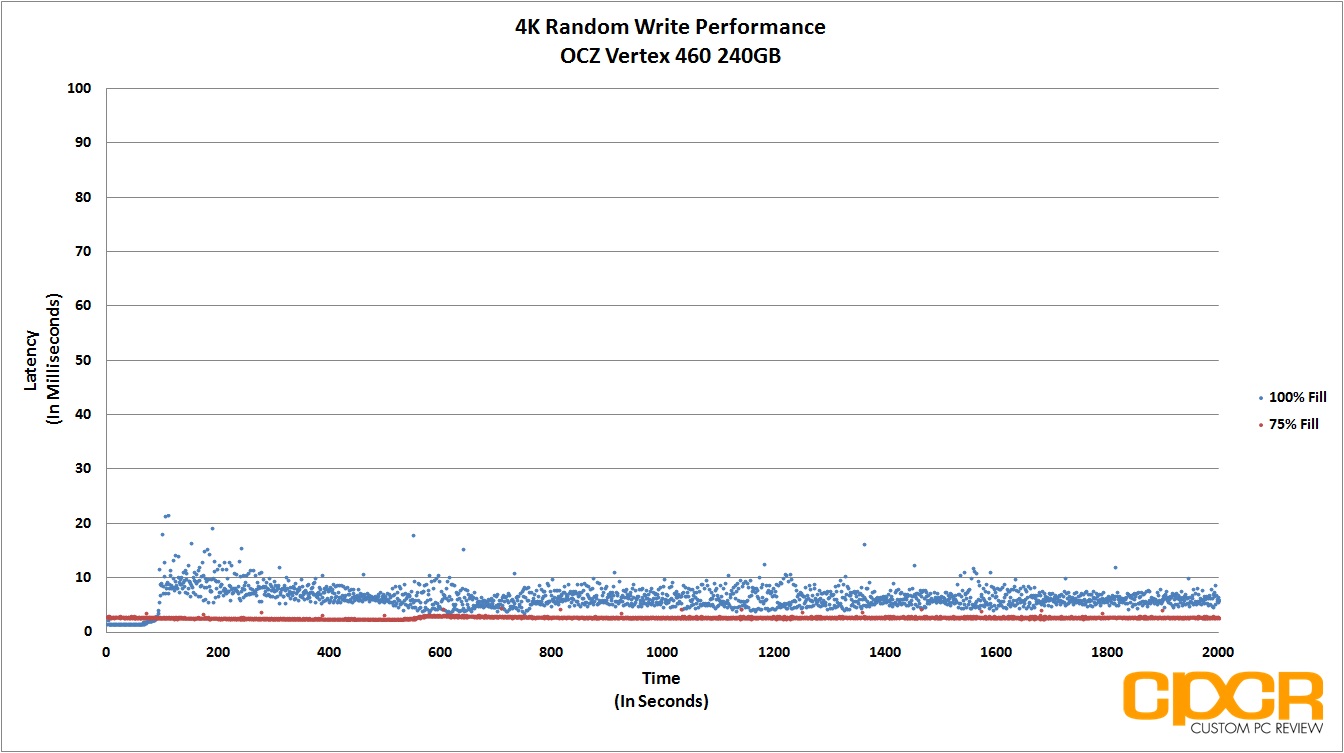
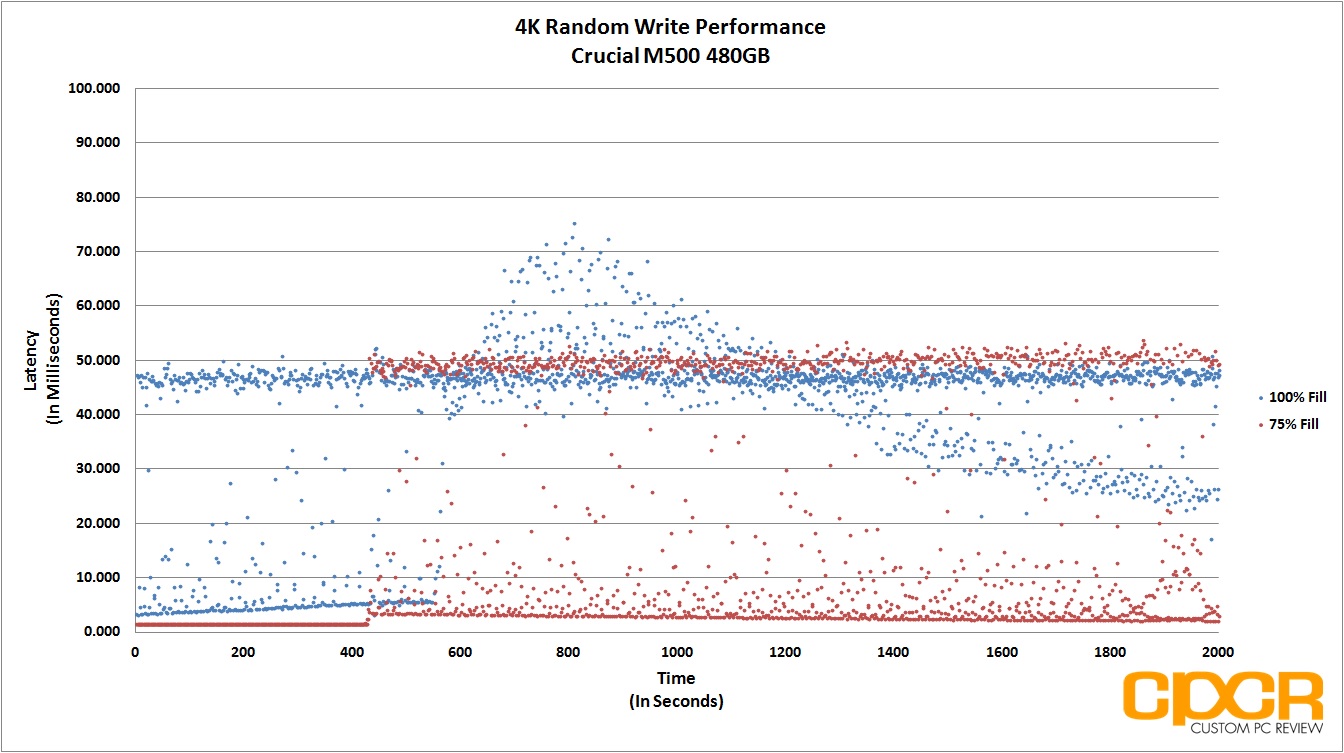

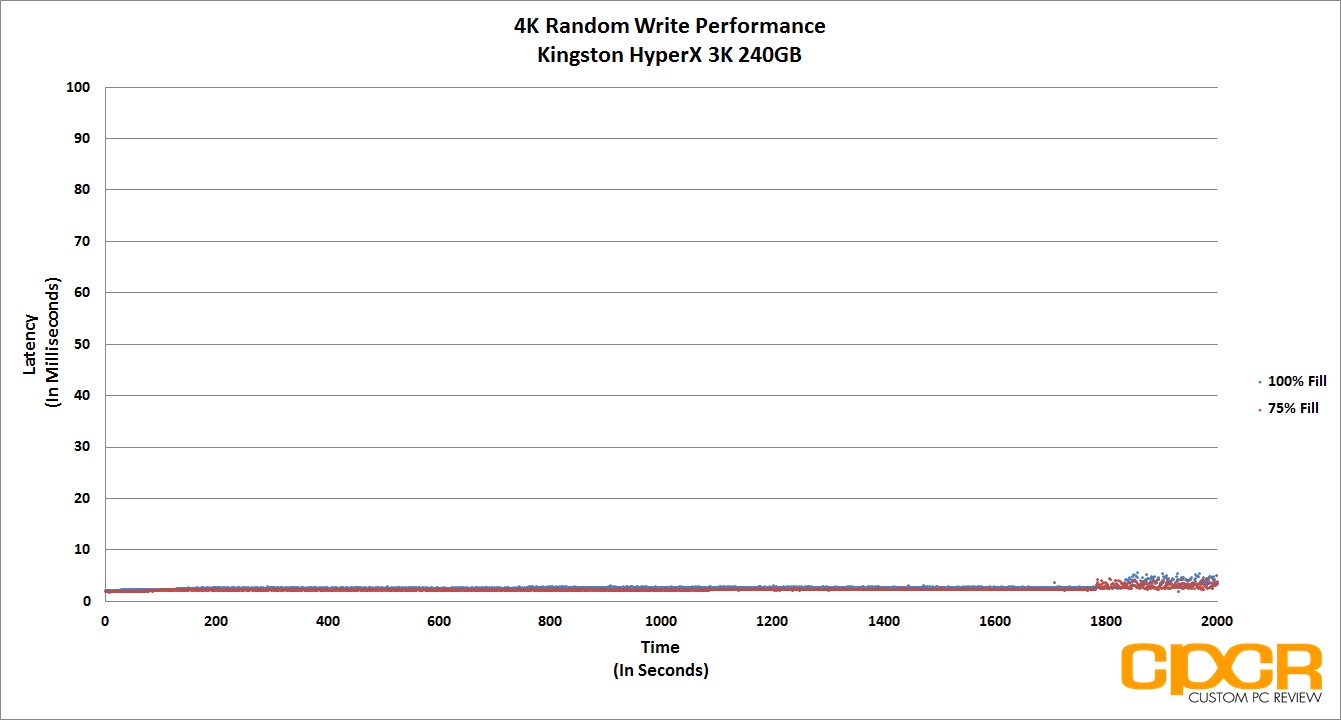
Performance Analysis
While consistent performance isn’t the HyperX Predator’s strong suit, latency on the Kingston HyperX Predator was fairly impressive. In both 75% and 100% fill, the drive was for the most part able to maintain sub-5ms response times.
[section label=”11. FIO – 128K Random Write”]
Kingston HyperX Predator 480GB Performance
FIO 128K Random Write Consistency Testing
In addition to testing 4K random write consistency, we’ll also test for 128K random write consistency to see how well a SSD is able to hold itself to a level of performance when getting hammered with larger file transfers.
Testing methodology is very similar to our testing for 4K random write consistency. We use a fairly standard method, which includes both filling up 75% of capacity as well as 100% capacity twice with sequential 128k data followed by the actual test itself, which is running 128K random writes at a queue depth of 32. By recording the IOPS every second for 2,000 seconds, we’re able to get a good look at what kind of performance can be expected when the drive is relatively new, when it’s heading towards steady state, and when it’s actually in steady state.
[tabgroup]
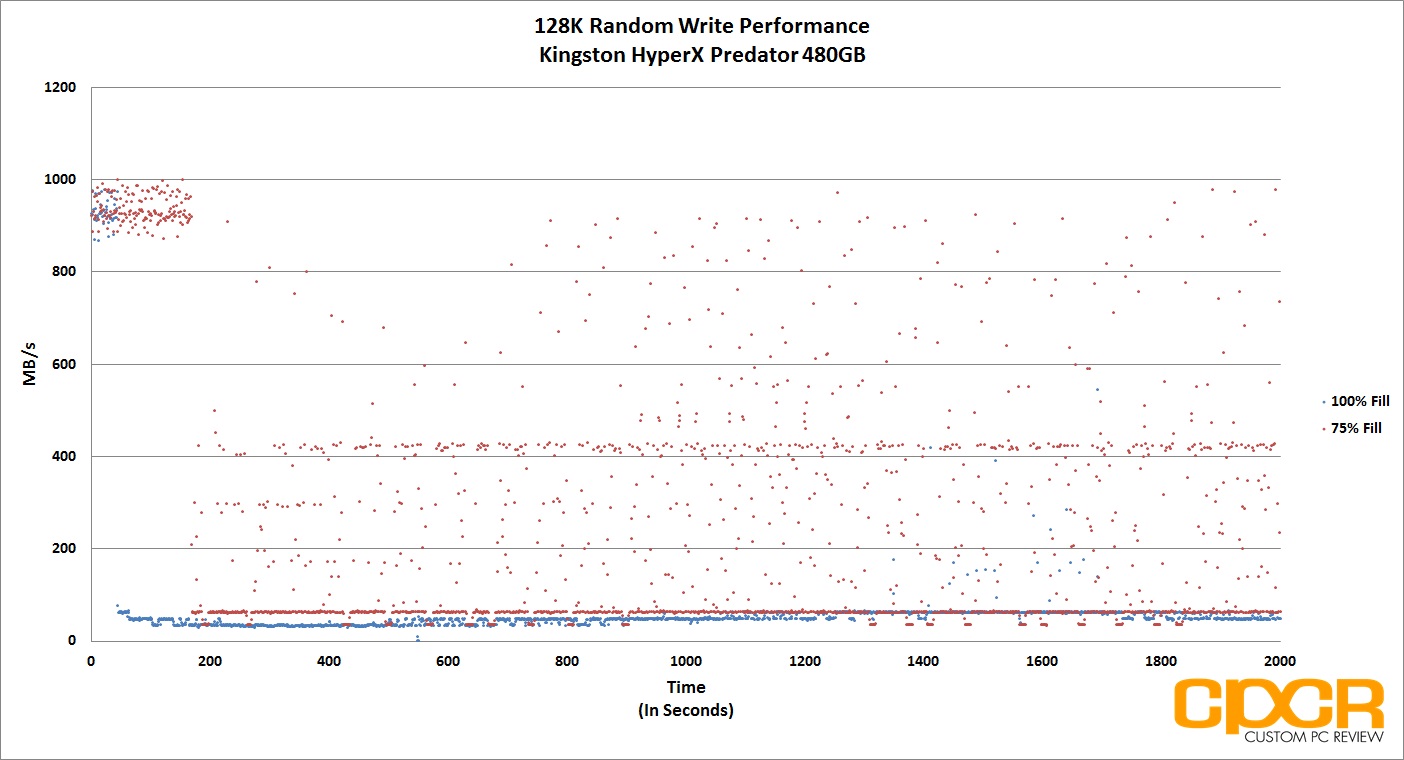
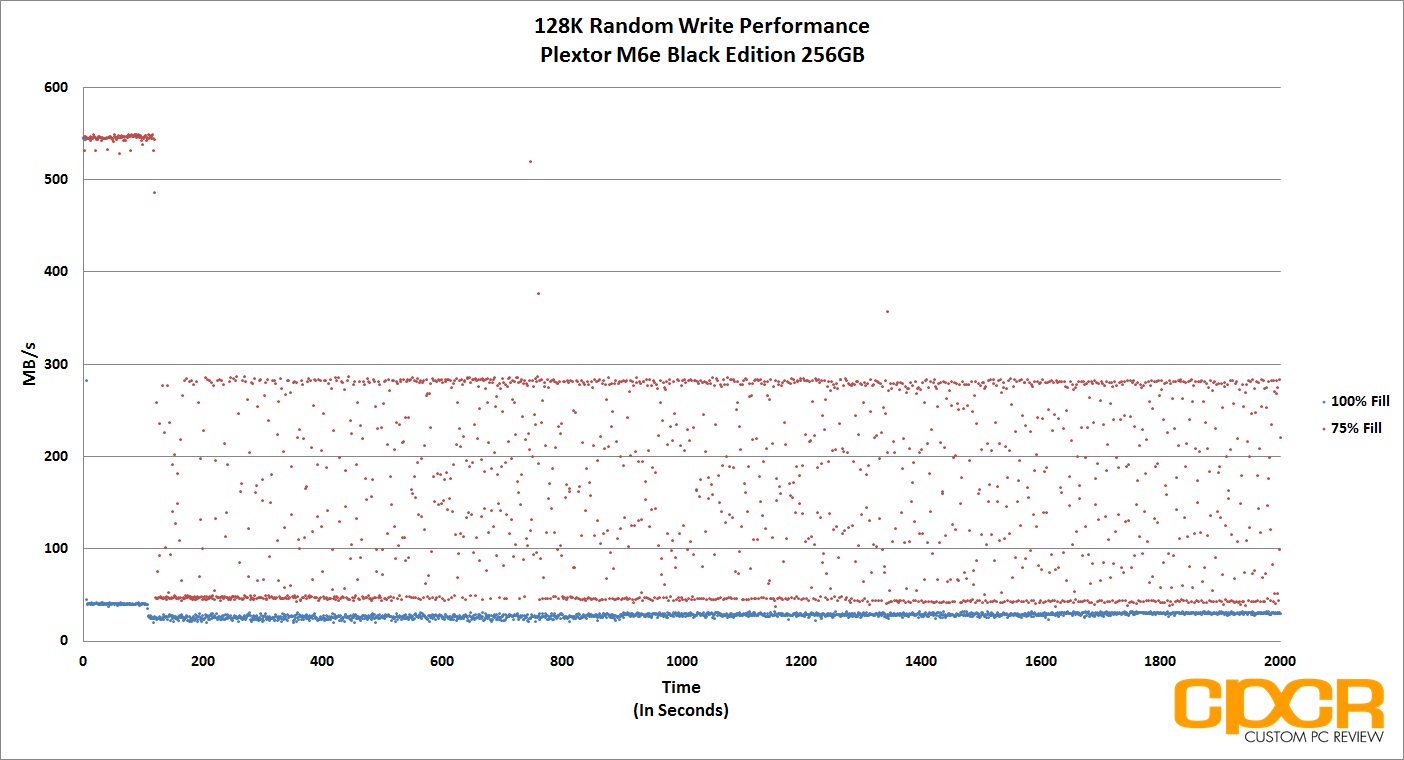
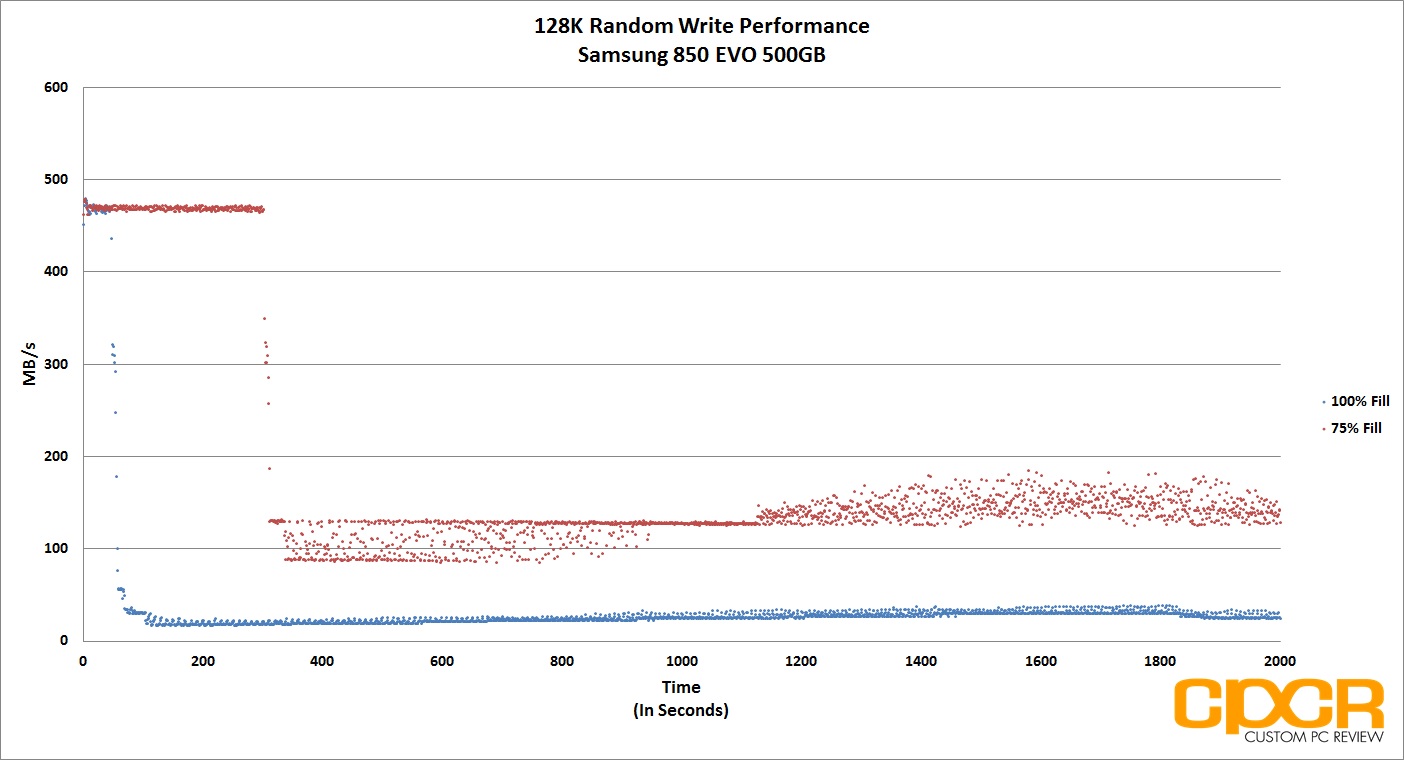
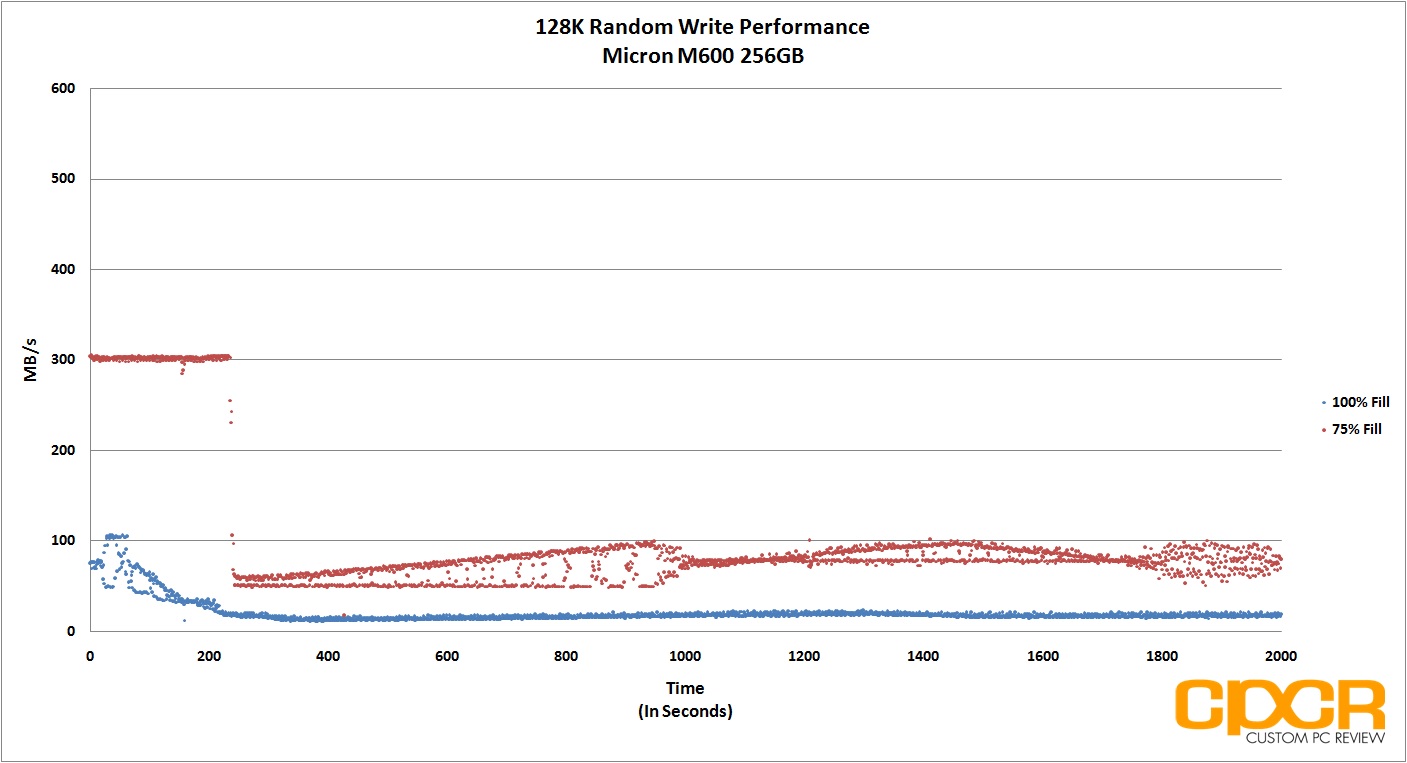
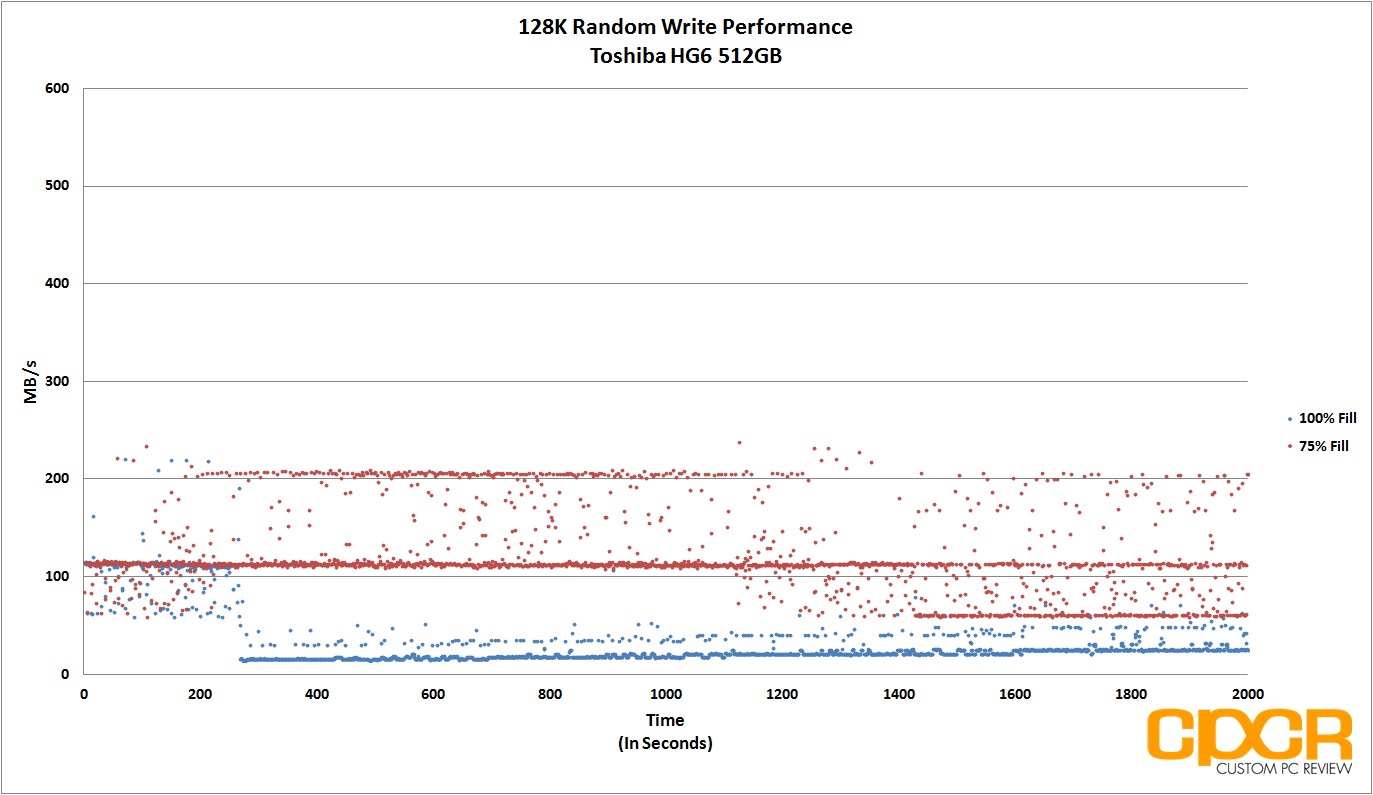
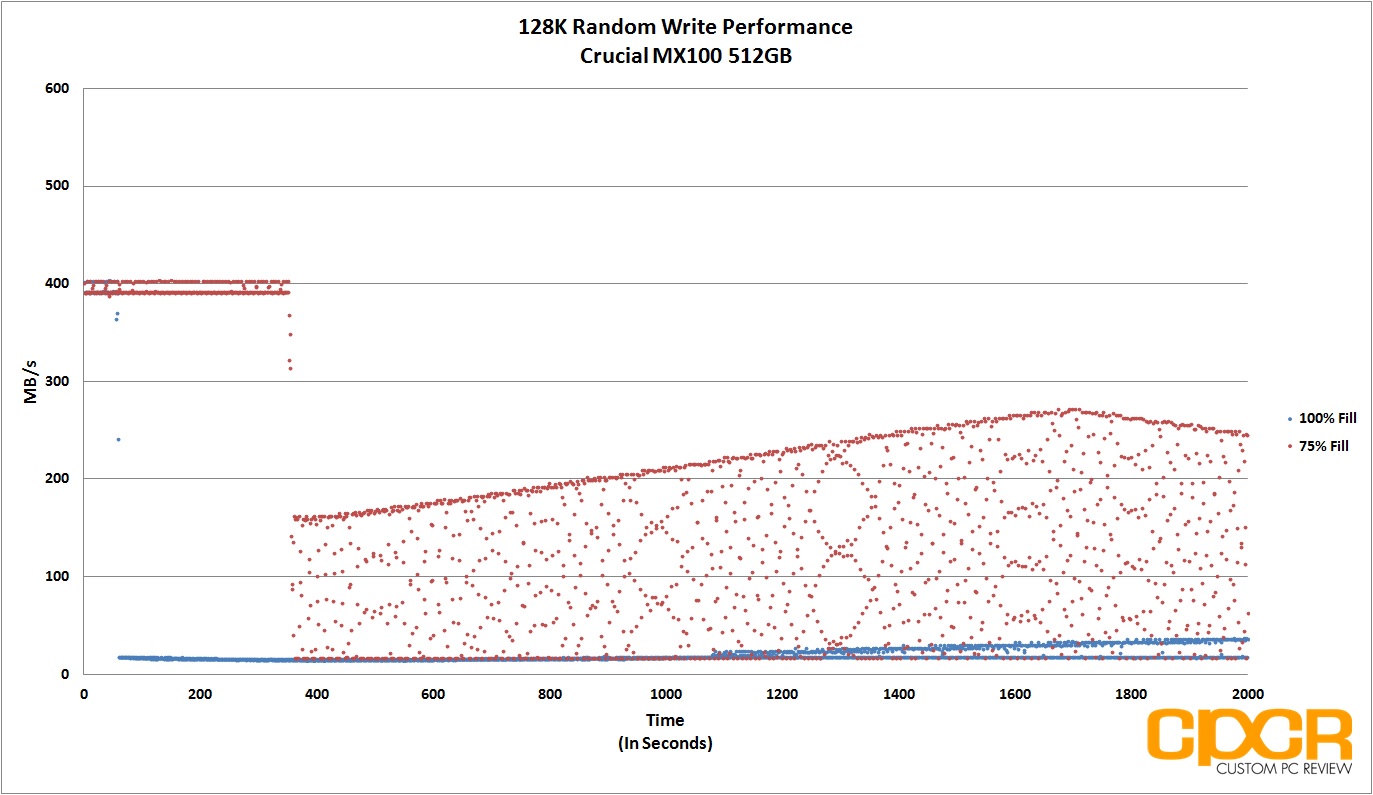
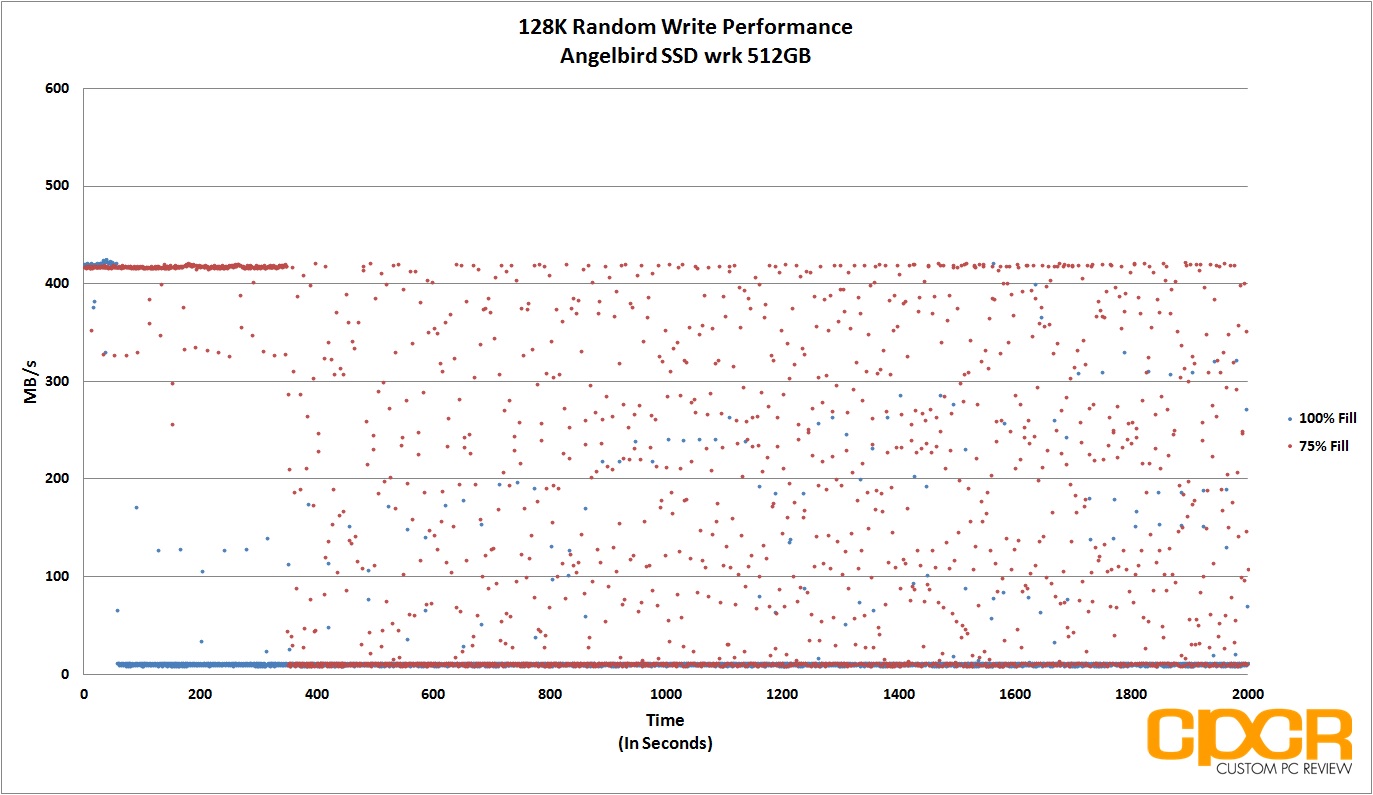

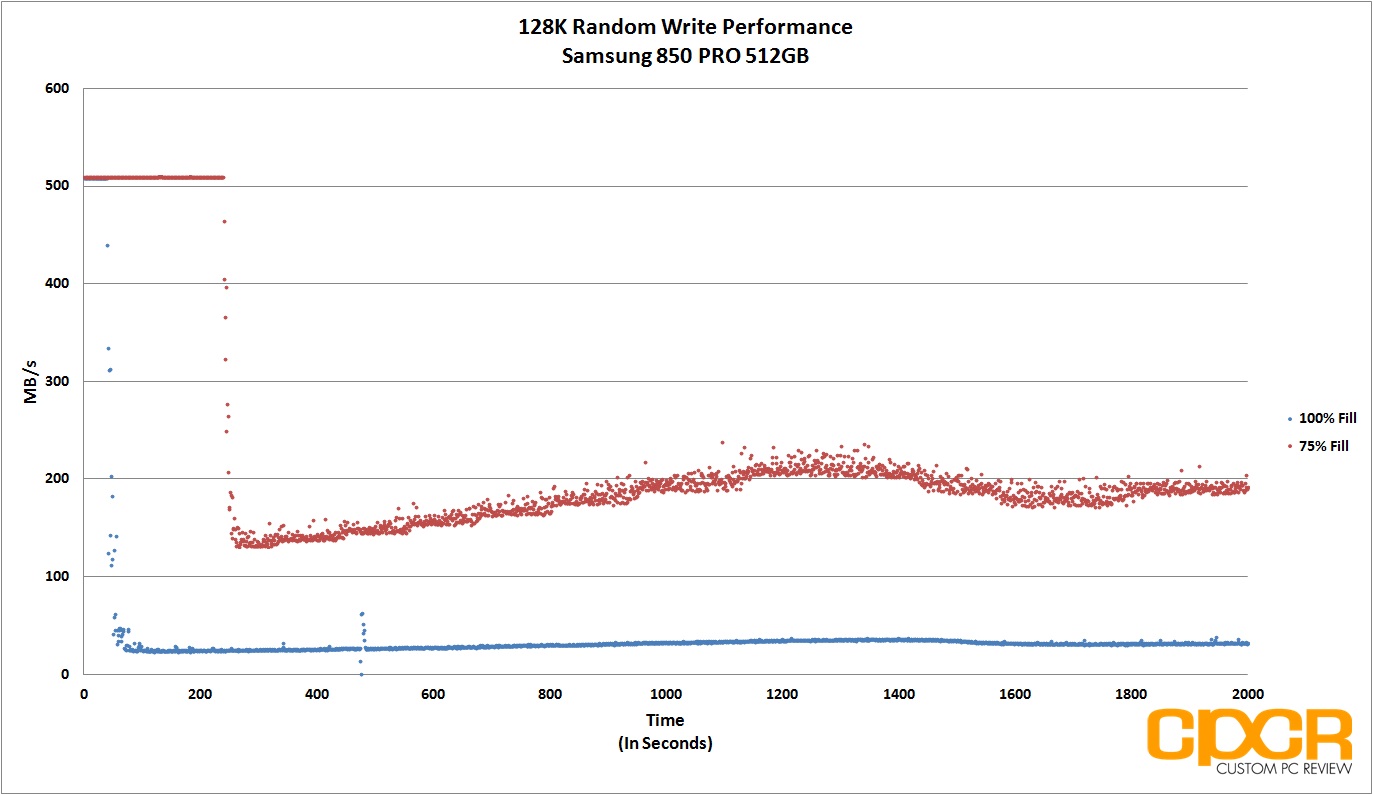
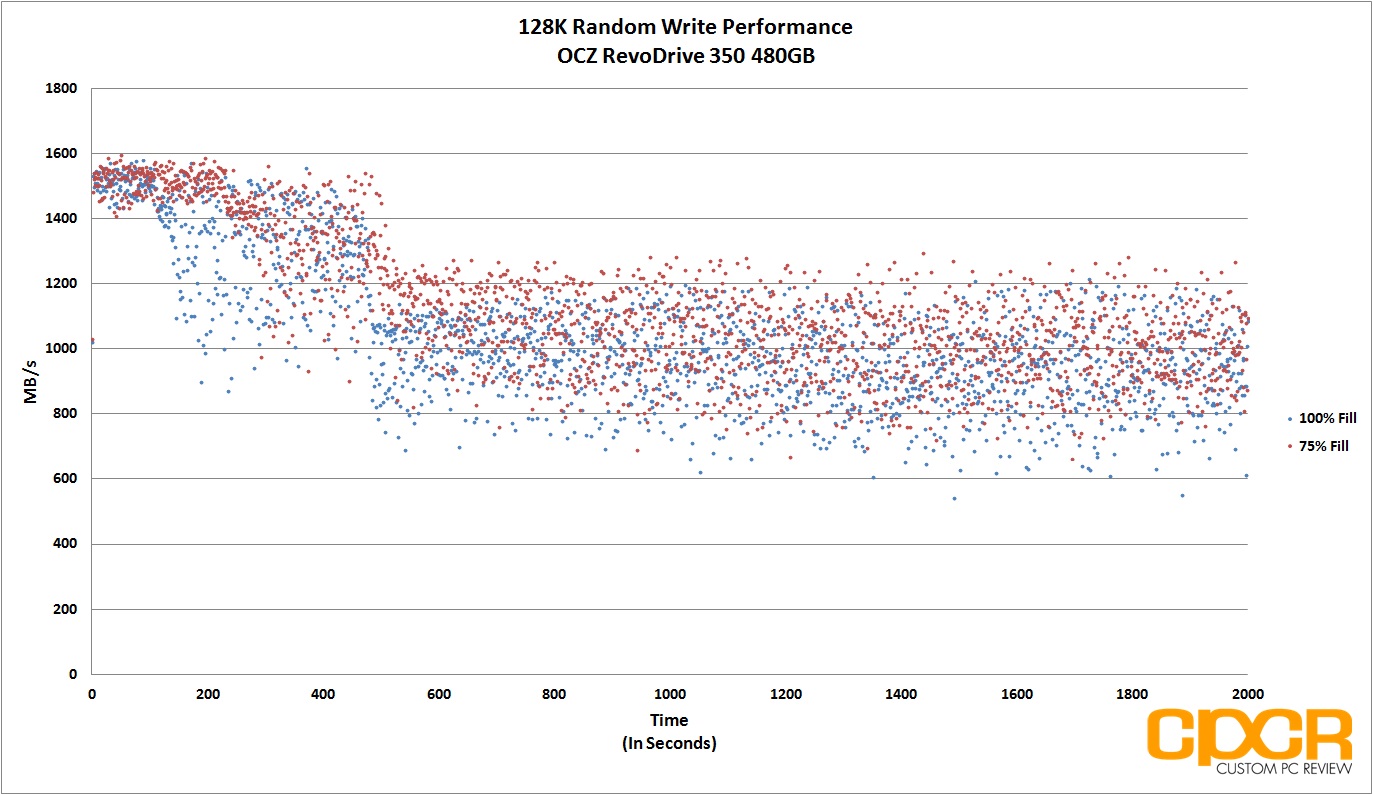
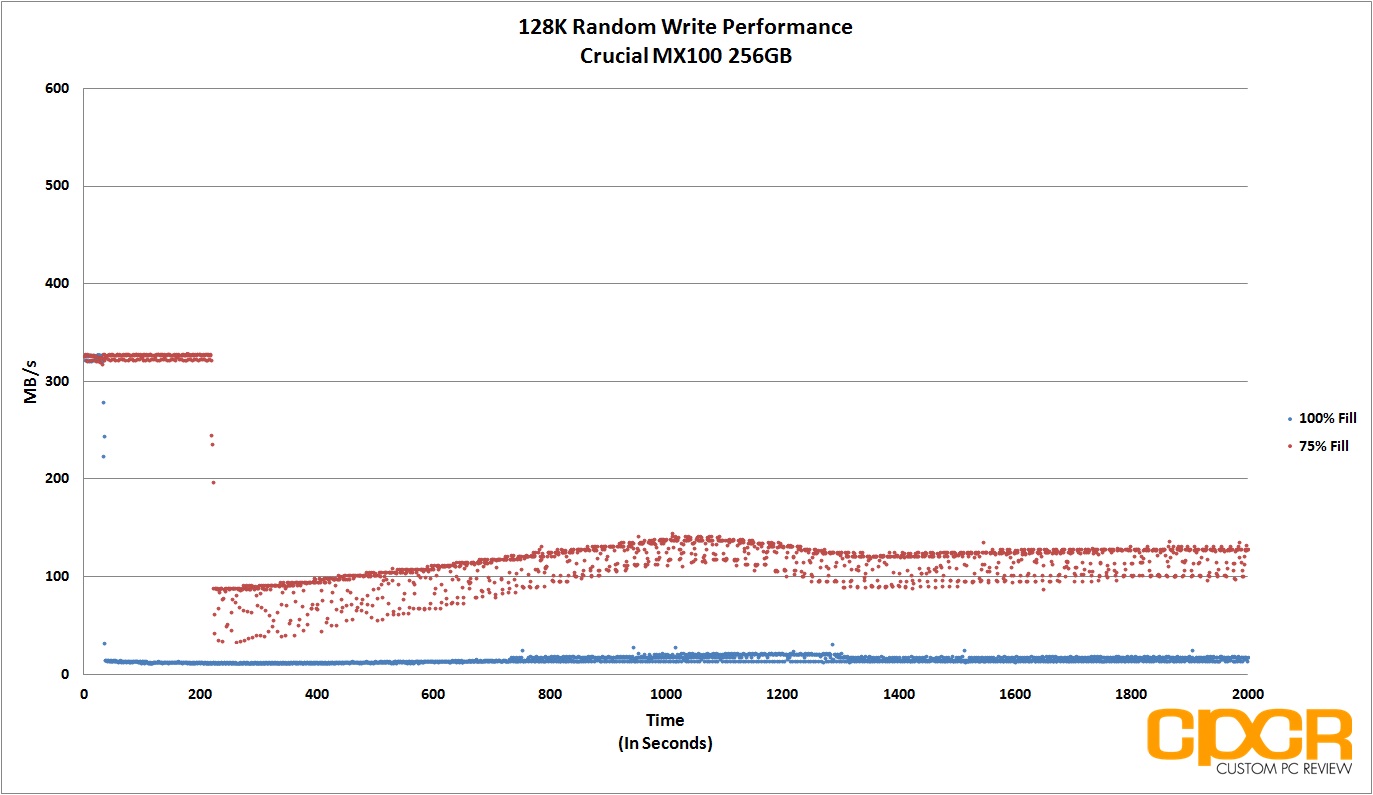
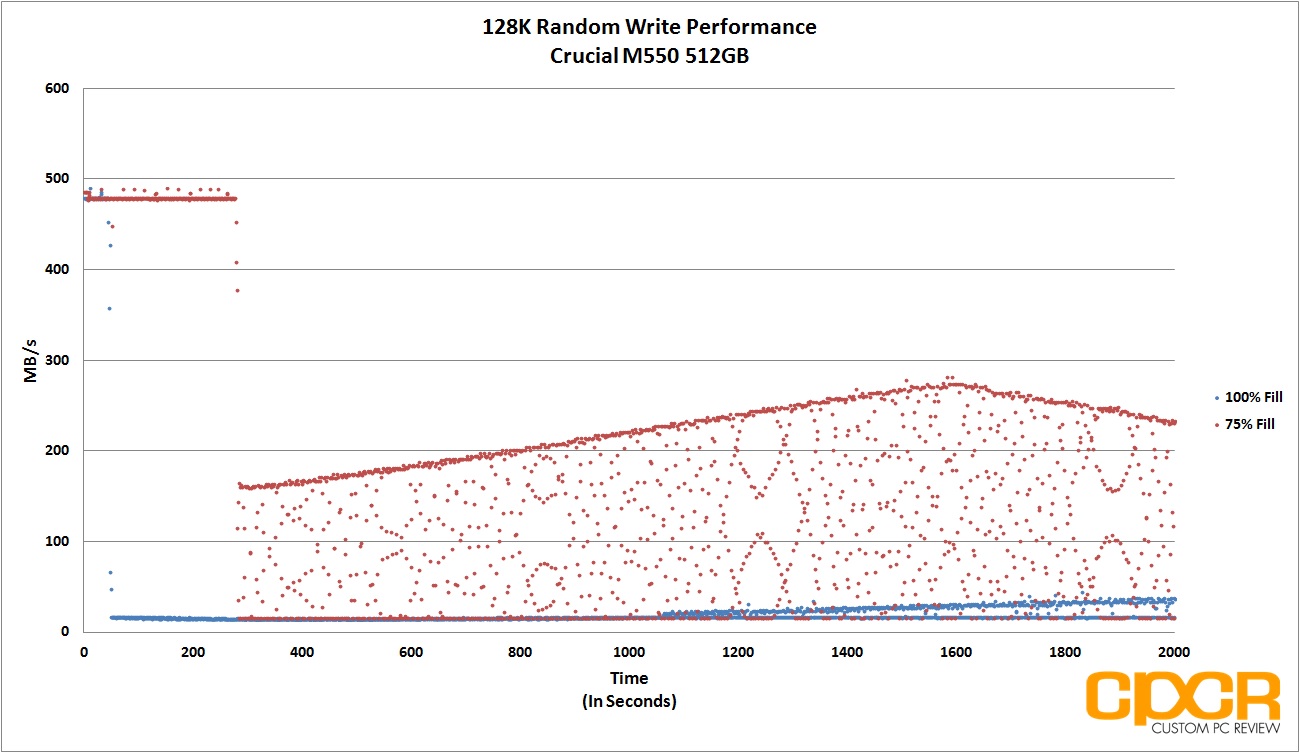
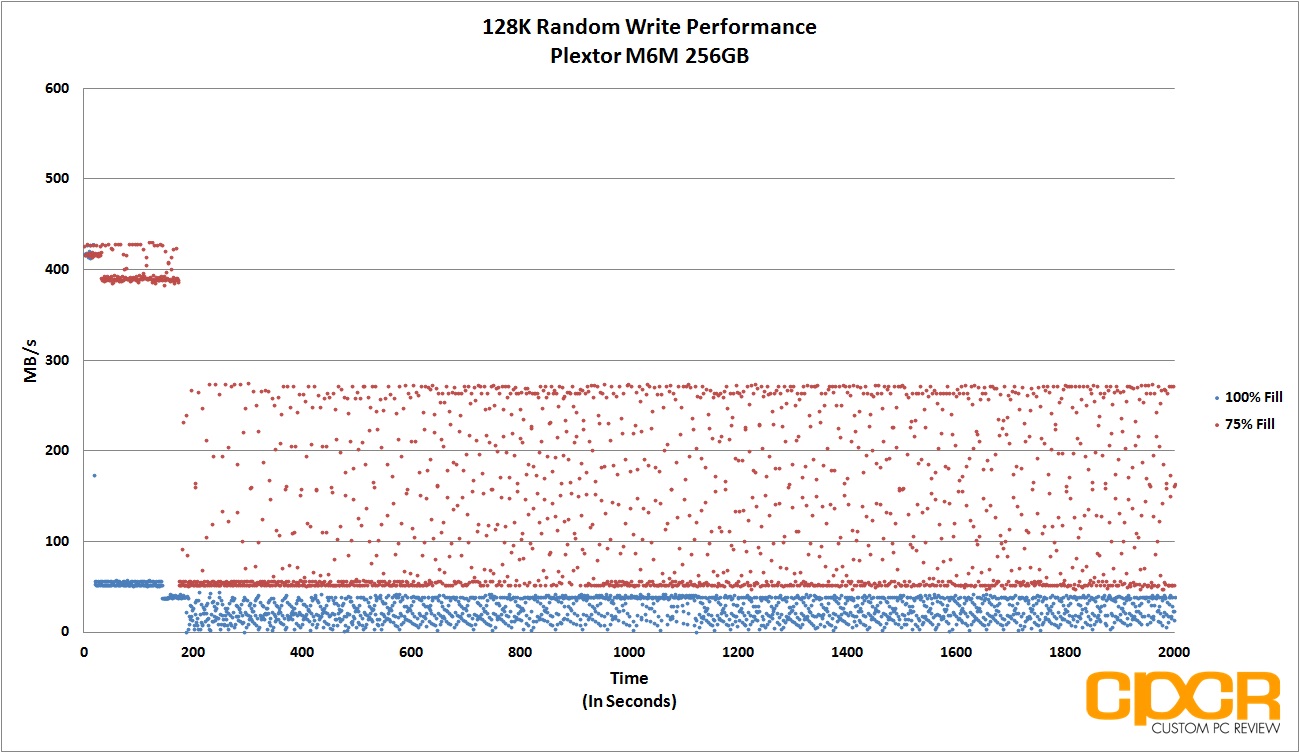
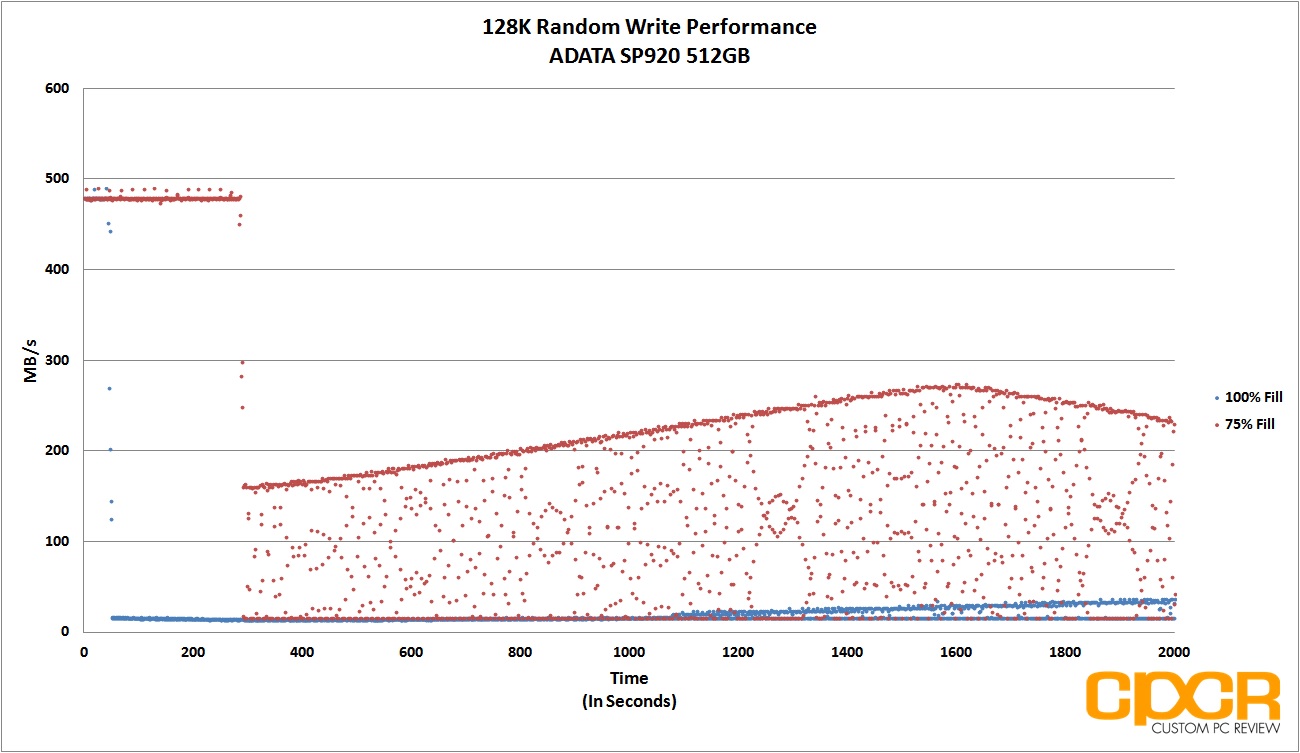
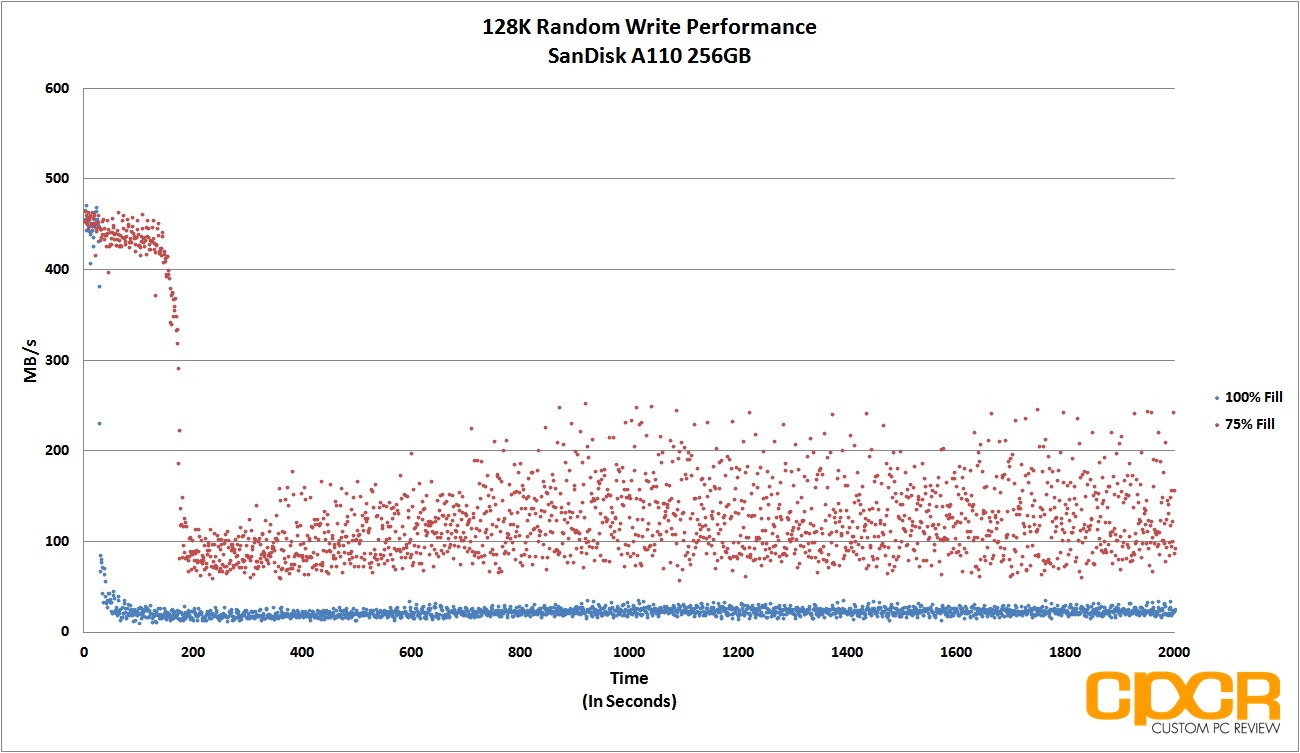
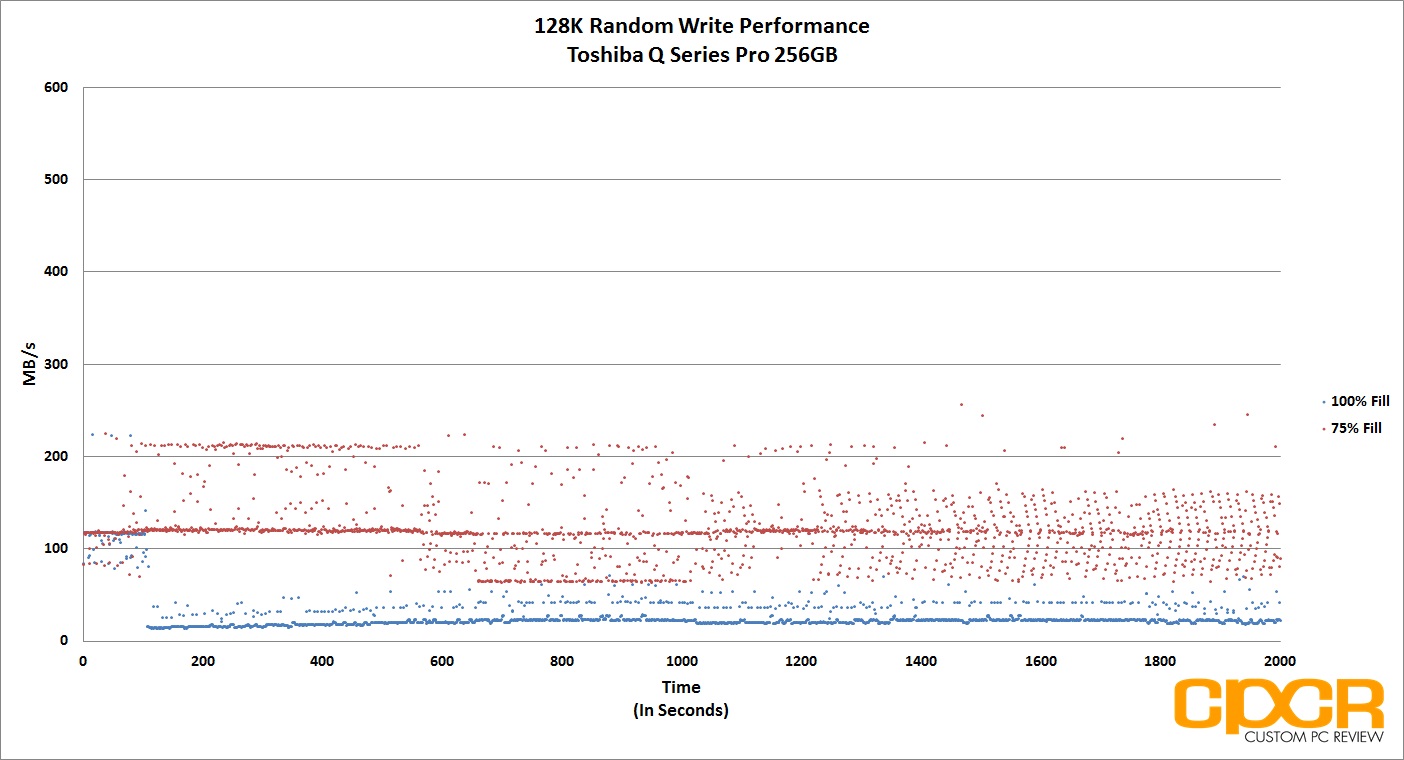
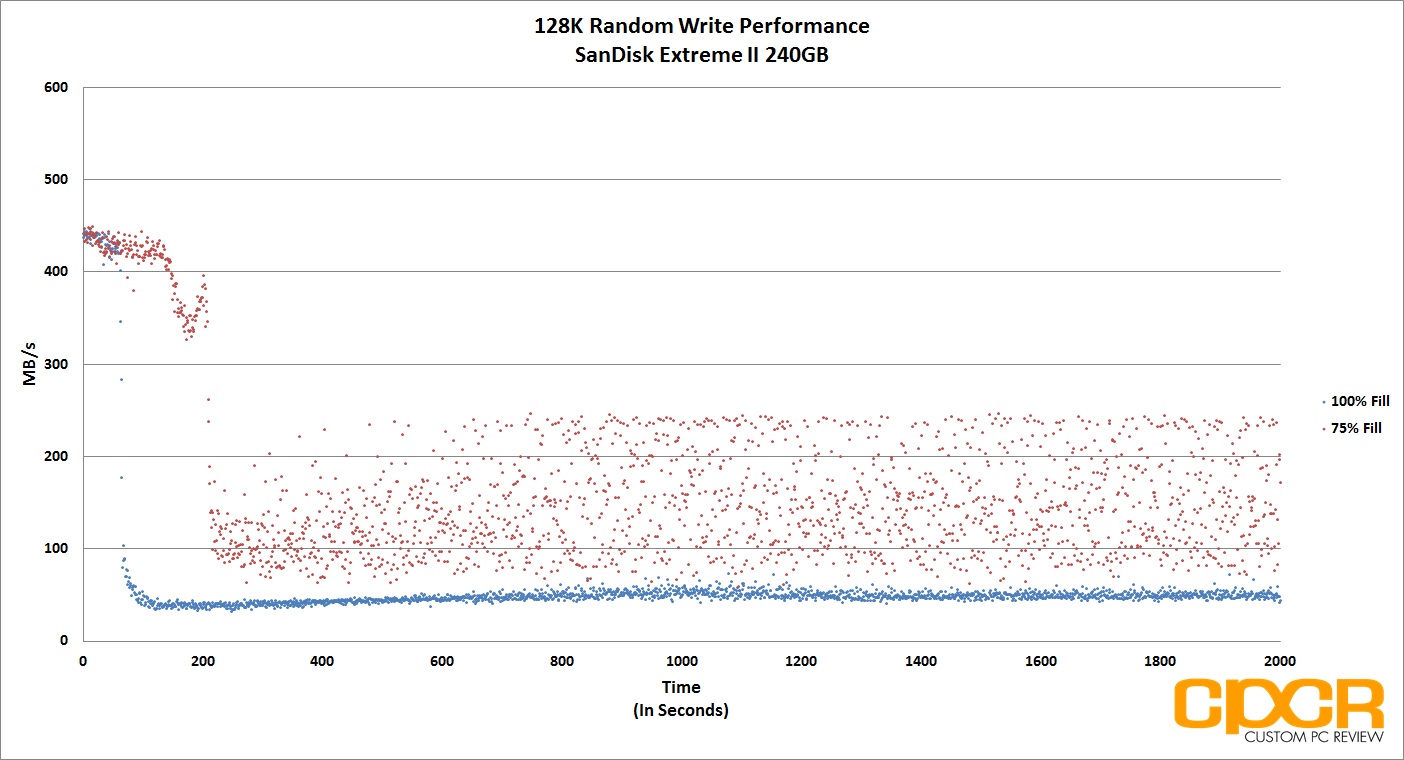
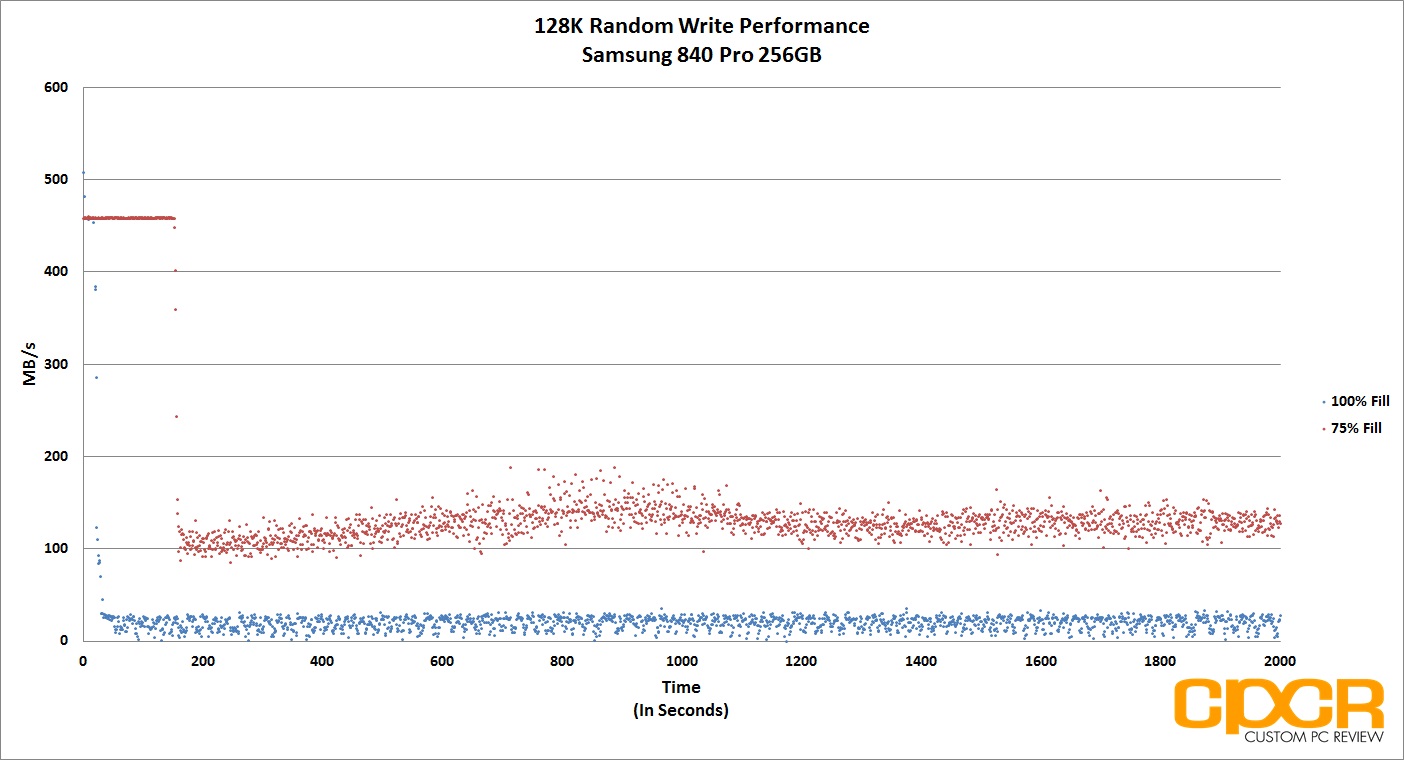
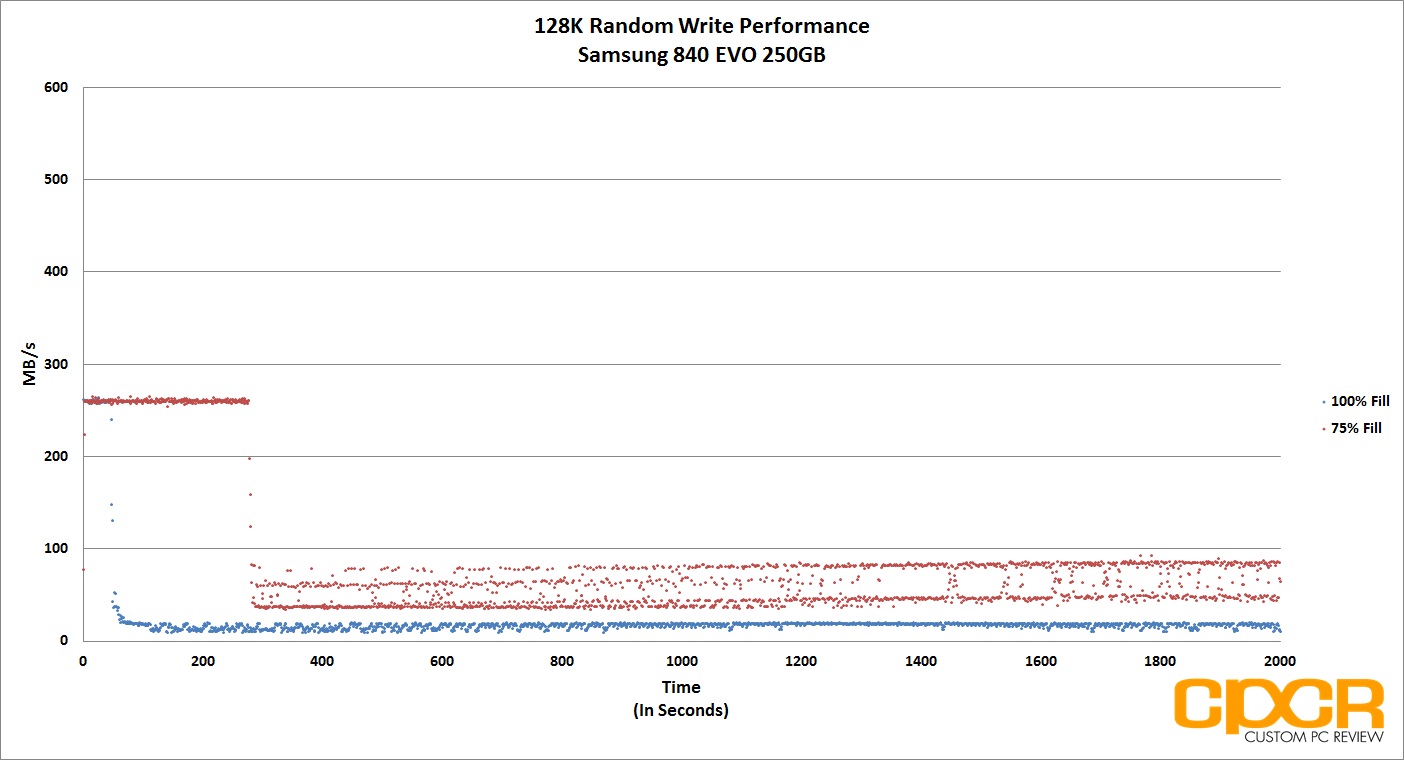
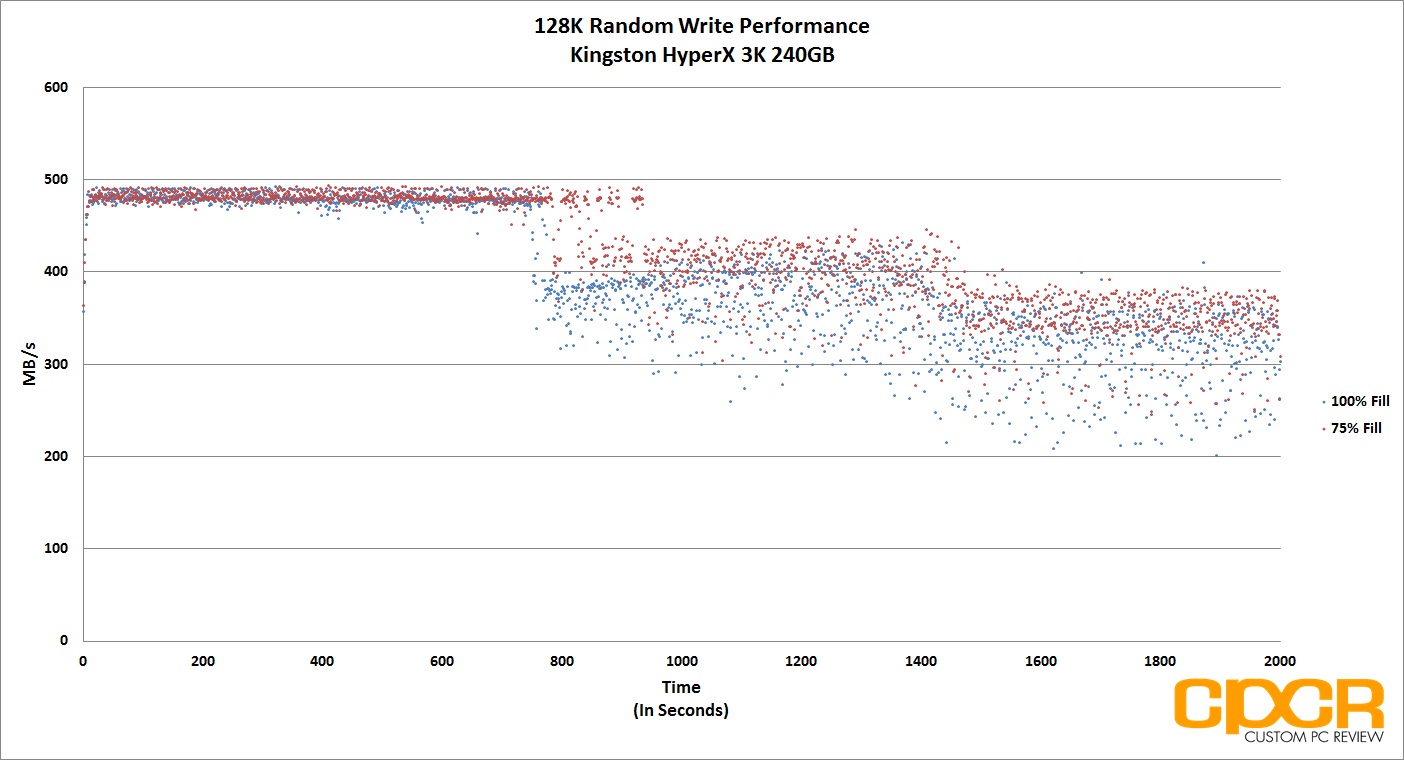
Performance Analysis
Similar to 4K random writes, there wasn’t much consistency in 128K random writes either. Performance fluctuated between 1GB/s and 30 MB/s in both 100% and 75% fill.
[section label=12. Conclusion]
Kingston HyperX Predator 480GB Conclusions
 When I first heard that Kingston had unveiled a non-SandForce PCIe M.2 based SSD back at Computex of last year, I was pretty surprised. I knew a number of SSD controller vendors had been developing native PCIe SSD controllers for quite some time, but Kingston had stuck by SandForce for so long that it simply didn’t seem like they’d have anything new to show me until the SandForce SF3700. Luckily they did and they not only surprised me by going with a Marvell controller for the first time, but also by being the first to market with a Marvell 88SS9293 based SSD.
Being a Kingston HyperX component, the HyperX Predator SSD is expected to be the flagship performance product in the consumer SSD lineup and in testing, it definitely delivers. Performance on the drive was able to hit the rated 1,400 MB/s sequential read and 1,000 MB/s sequential write mark and it came in right behind the 4x SandForce SF-2281 powered OCZ RevoDrive 350 as the second fastest drive we’ve tested using the PC Mark 7 storage benchmark. The HyperX Predator does fall short of some of the top end enthusiast SATA drives when it comes to very heavy workloads, but otherwise, it’s an extremely fast drive that utilizes the additional bandwidth offered by the PCIe Gen 2 x4 interface very well.
| Manufacturer | Kingston | Kingston |
|---|---|---|
| Model | HyperX Predator PCIe SSD | HyperX Predator PCIe SSD |
| SKU | SHPM2280P2/240G | SHPM2280P2/480G |
| Capacity | 240 GB | 480 GB |
| Street Price | $266.48 | $498.69 |
| Price/GB | ~$1.11 | ~$1.04 |
| Check Price | Click Here |
Click Here |
The Kingston HyperX Predator PCIe SSD 480GB
Overall the Kingston HyperX Predator is an excellent first entry into the M.2 market for Kingston and it also happens to be the the fastest M.2 drive you can purchase in a retail box today. There’s really not much more to say. Recommended!

Sample provided by: Kingston
Availability: Amazon

